Uncategorized
Offsetting Currents Leave Market in Flux as Bond Yields Rise
The investing landscape is about as mixed and garbled as one could imagine, with all the conflicting data showing a lot of fragmentation within several…
Share this:

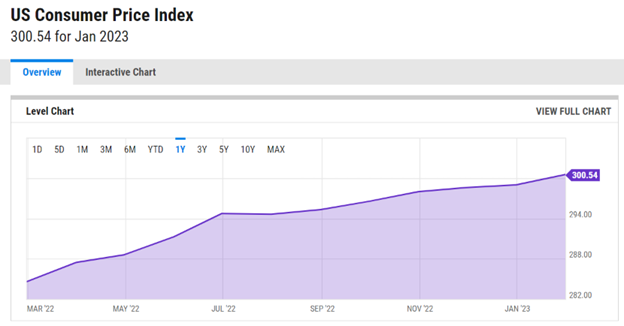
The investing landscape is about as mixed and garbled as one could imagine, with all the conflicting data showing a lot of fragmentation within several sectors of the economy amid tightening monetary policy, and a stock market that is demonstrating resilience against seemingly mounting odds. The bears point to an inverted yield curve, a hot shelter index within the CPI, lower oil prices, negative monthly manufacturing data, flat growth in industrial production, talk of a 50-basis-point (BPS) hike at the March 22 FOMC meeting, record household credit and a resumption of rising commodity prices.
Source: www.ycharts.com
It is widely understood that the consumer drives U.S. GDP, and though anecdotal evidence would suggest the consumer is just fine, the hard data would imply otherwise, to be sure. Consumer spending was nothing short of spectacular in January, buttressing everything from new car purchases, travel, hospitality, entertainment, furniture, home furnishings, electronics, clothing and accessories. The key takeaway from the report is that consumers were spending freely on goods in January, despite the ongoing inflation pressure. In fact, every single sales category showed a month-over-month increase, led by a 7.2% surge in sales at food-and-beverage establishments.

The narrative that has been making the rounds within investment circles to explain this “damn inflation, full spending ahead” is a strange and surreal admission by believers of LTS — i.e., life’s too short. Others in the financial world would call this whistling by the graveyard, and that all the stimulus and relief experienced during the pandemic infected millions upon millions of people with the idea that extreme debt is no big deal.
After all, the federal government has no problem running up $31.46 trillion in debt and mortgaging the future of our great-grandchildren. It’s like, “when my stuff hits the fan, I’ll just stop paying on my rent, cry foul when they come to repossess my Tesla, wait for the government to bail me out of my student loans and go tell my credit card issuers to go pound sand, because you shouldn’t have extended me that much credit in the first place. It’s not my fault I have no margin. I’m the victim! How much are Taylor Swift tickets? Sweet, I’m in. I’ll figure it out, but I’m not missing the show!”
I’m not so sure this example is that extreme. The hard data would corroborate my rant. According to the New York Fed, “mortgage balances shown on consumer credit reports increased by $254 billion during the fourth quarter of 2022 and stood at $11.92 trillion at the end of December, marking a nearly $1 trillion increase in mortgage balances during 2022. Balances on home equity lines of credit (HELOC) increased by $14 billion, the third consecutive quarterly increase and the largest increase seen in more than a decade; the outstanding HELOC balance stands at $336 billion.
“Credit card balances saw a $61 billion increase in the fourth quarter, surpassing the pre-pandemic high of $927 billion. Credit card balances now stand at $986 billion, after declining to $770 billion in 2021Q1. Auto loan balances increased by $28 billion in the fourth quarter to $1.55 trillion, continuing the upward trajectory that has been in place since 2011. Other balances, which include retail cards and other consumer loans, increased by $16 billion. Student loan balances now stand at $1.60 trillion, up by $21 billion from the previous quarter. In total, non-housing balances grew by $126 billion. The share of all current debt transitioning into delinquency increased for nearly all debt types.”

The bulls would contend that air is coming out of the housing bubble, and the spike in household debt is unfortunate for those hard-working people on fixed wages and salaries, but it is also the fault of people not living within their means. As long as the 1% of Americans that own 53% of all stocks are in good shape, then the market is in good shape. Roughly 150 million people, or 55%, of all Americans own stocks in some form or another, but the top 1% have the full attention of market forces.

So, investors shouldn’t lose focus as to why the market trades as well as it does in the face of inflationary pressure. The top 1% can handle 4-5% inflation just fine. They have the financial horsepower to cope with rising prices and the costs of doing business. Anyone over the age of 60 can easily recall the days of the mid-1980s, when many were buying their first home and mortgages dipped below 10% for the first time in a while. At the time, it was celebrated like having hit the lottery. Today’s rate of 7.4% is being treated as an OMG moment because most new home buyers have been living in a perma-stimulus, quantitative easing (QE) bubble for the past 15 years.
News flash — 4% inflation is historically normal. During the observation period from 1960 to 2021, the average inflation rate was 3.8% per year. Overall, the price increase was 829.57%. An item that cost $100 in 1960 cost $929.57 at the beginning of 2022. For January 2023, the year-over-year inflation rate was 6.4%. One could argue a lot has happened in the past 50 years during which this metric is drawn from. And the stock market has managed just fine in a 4% world. Jobs are plentiful, prices for goods produced allow for decent profits, household wealth increases, real estate appreciates and America generally prospers.

Source: www.worlddatainfo.com
The vocal and divided debate as to whether the economy, S&P earnings, the health of the consumer and the stock market’s price to earnings (PE) valuation will continue to rage on for the days and weeks ahead, because there is simply no consensus. This will continue to foster ongoing volatility until the forthcoming data begins to shed light on economic conditions and whether the eight rate hikes, and the likely two more to come, are priced in. Right now, it is a very hard task to forecast the future, but if one has good stocks, then sitting tight is probably the best plan of action. Sometimes it just pays to show patience.
Sincerely,

Bryan Perry
Editor, Cash Machine
Editor, Premium Income PRO
Editor, Quick Income Trader
Editor, Breakout Options Alert
Editor, Micro-Cap Stock Trader
The post Offsetting Currents Leave Market in Flux as Bond Yields Rise appeared first on Stock Investor.
stimulus pandemic yield curve stocks monetary policy fomc qe fed real estate mortgages pound micro-cap gdp consumer spending stimulus oilUncategorized
February Employment Situation
By Paul Gomme and Peter Rupert The establishment data from the BLS showed a 275,000 increase in payroll employment for February, outpacing the 230,000…
Share this:


By Paul Gomme and Peter Rupert
The establishment data from the BLS showed a 275,000 increase in payroll employment for February, outpacing the 230,000 average over the previous 12 months. The payroll data for January and December were revised down by a total of 167,000. The private sector added 223,000 new jobs, the largest gain since May of last year.

Temporary help services employment continues a steep decline after a sharp post-pandemic rise.


Average hours of work increased from 34.2 to 34.3. The increase, along with the 223,000 private employment increase led to a hefty increase in total hours of 5.6% at an annualized rate, also the largest increase since May of last year.

The establishment report, once again, beat “expectations;” the WSJ survey of economists was 198,000. Other than the downward revisions, mentioned above, another bit of negative news was a smallish increase in wage growth, from $34.52 to $34.57.

The household survey shows that the labor force increased 150,000, a drop in employment of 184,000 and an increase in the number of unemployed persons of 334,000. The labor force participation rate held steady at 62.5, the employment to population ratio decreased from 60.2 to 60.1 and the unemployment rate increased from 3.66 to 3.86. Remember that the unemployment rate is the number of unemployed relative to the labor force (the number employed plus the number unemployed). Consequently, the unemployment rate can go up if the number of unemployed rises holding fixed the labor force, or if the labor force shrinks holding the number unemployed unchanged. An increase in the unemployment rate is not necessarily a bad thing: it may reflect a strong labor market drawing “marginally attached” individuals from outside the labor force. Indeed, there was a 96,000 decline in those workers.


Earlier in the week, the BLS announced JOLTS (Job Openings and Labor Turnover Survey) data for January. There isn’t much to report here as the job openings changed little at 8.9 million, the number of hires and total separations were little changed at 5.7 million and 5.3 million, respectively.

As has been the case for the last couple of years, the number of job openings remains higher than the number of unemployed persons.

Also earlier in the week the BLS announced that productivity increased 3.2% in the 4th quarter with output rising 3.5% and hours of work rising 0.3%.

The bottom line is that the labor market continues its surprisingly (to some) strong performance, once again proving stronger than many had expected. This strength makes it difficult to justify any interest rate cuts soon, particularly given the recent inflation spike.
unemployment pandemic unemploymentUncategorized
Mortgage rates fall as labor market normalizes
Jobless claims show an expanding economy. We will only be in a recession once jobless claims exceed 323,000 on a four-week moving average.
Share this:


Everyone was waiting to see if this week’s jobs report would send mortgage rates higher, which is what happened last month. Instead, the 10-year yield had a muted response after the headline number beat estimates, but we have negative job revisions from previous months. The Federal Reserve’s fear of wage growth spiraling out of control hasn’t materialized for over two years now and the unemployment rate ticked up to 3.9%. For now, we can say the labor market isn’t tight anymore, but it’s also not breaking.
The key labor data line in this expansion is the weekly jobless claims report. Jobless claims show an expanding economy that has not lost jobs yet. We will only be in a recession once jobless claims exceed 323,000 on a four-week moving average.
From the Fed: In the week ended March 2, initial claims for unemployment insurance benefits were flat, at 217,000. The four-week moving average declined slightly by 750, to 212,250
Below is an explanation of how we got here with the labor market, which all started during COVID-19.
1. I wrote the COVID-19 recovery model on April 7, 2020, and retired it on Dec. 9, 2020. By that time, the upfront recovery phase was done, and I needed to model out when we would get the jobs lost back.
2. Early in the labor market recovery, when we saw weaker job reports, I doubled and tripled down on my assertion that job openings would get to 10 million in this recovery. Job openings rose as high as to 12 million and are currently over 9 million. Even with the massive miss on a job report in May 2021, I didn’t waver.
Currently, the jobs openings, quit percentage and hires data are below pre-COVID-19 levels, which means the labor market isn’t as tight as it once was, and this is why the employment cost index has been slowing data to move along the quits percentage.

3. I wrote that we should get back all the jobs lost to COVID-19 by September of 2022. At the time this would be a speedy labor market recovery, and it happened on schedule, too
Total employment data
4. This is the key one for right now: If COVID-19 hadn’t happened, we would have between 157 million and 159 million jobs today, which would have been in line with the job growth rate in February 2020. Today, we are at 157,808,000. This is important because job growth should be cooling down now. We are more in line with where the labor market should be when averaging 140K-165K monthly. So for now, the fact that we aren’t trending between 140K-165K means we still have a bit more recovery kick left before we get down to those levels.

From BLS: Total nonfarm payroll employment rose by 275,000 in February, and the unemployment rate increased to 3.9 percent, the U.S. Bureau of Labor Statistics reported today. Job gains occurred in health care, in government, in food services and drinking places, in social assistance, and in transportation and warehousing.
Here are the jobs that were created and lost in the previous month:

In this jobs report, the unemployment rate for education levels looks like this:
- Less than a high school diploma: 6.1%
- High school graduate and no college: 4.2%
- Some college or associate degree: 3.1%
- Bachelor’s degree or higher: 2.2%

Today’s report has continued the trend of the labor data beating my expectations, only because I am looking for the jobs data to slow down to a level of 140K-165K, which hasn’t happened yet. I wouldn’t categorize the labor market as being tight anymore because of the quits ratio and the hires data in the job openings report. This also shows itself in the employment cost index as well. These are key data lines for the Fed and the reason we are going to see three rate cuts this year.
recession unemployment covid-19 fed federal reserve mortgage rates recession recovery unemploymentUncategorized
Inside The Most Ridiculous Jobs Report In History: Record 1.2 Million Immigrant Jobs Added In One Month
Inside The Most Ridiculous Jobs Report In History: Record 1.2 Million Immigrant Jobs Added In One Month
Last month we though that the January…
Share this:


Last month we though that the January jobs report was the "most ridiculous in recent history" but, boy, were we wrong because this morning the Biden department of goalseeked propaganda (aka BLS) published the February jobs report, and holy crap was that something else. Even Goebbels would blush.
What happened? Let's take a closer look.
On the surface, it was (almost) another blockbuster jobs report, certainly one which nobody expected, or rather just one bank out of 76 expected. Starting at the top, the BLS reported that in February the US unexpectedly added 275K jobs, with just one research analyst (from Dai-Ichi Research) expecting a higher number.
Some context: after last month's record 4-sigma beat, today's print was "only" 3 sigma higher than estimates. Needless to say, two multiple sigma beats in a row used to only happen in the USSR... and now in the US, apparently.

Before we go any further, a quick note on what last month we said was "the most ridiculous jobs report in recent history": it appears the BLS read our comments and decided to stop beclowing itself. It did that by slashing last month's ridiculous print by over a third, and revising what was originally reported as a massive 353K beat to just 229K, a 124K revision, which was the biggest one-month negative revision in two years!

Of course, that does not mean that this month's jobs print won't be revised lower: it will be, and not just that month but every other month until the November election because that's the only tool left in the Biden admin's box: pretend the economic and jobs are strong, then revise them sharply lower the next month, something we pointed out first last summer and which has not failed to disappoint once.
In the past month the Biden department of goalseeking stuff higher before revising it lower, has revised the following data sharply lower:
— zerohedge (@zerohedge) August 30, 2023
- Jobs
- JOLTS
- New Home sales
- Housing Starts and Permits
- Industrial Production
- PCE and core PCE
To be fair, not every aspect of the jobs report was stellar (after all, the BLS had to give it some vague credibility). Take the unemployment rate, after flatlining between 3.4% and 3.8% for two years - and thus denying expectations from Sahm's Rule that a recession may have already started - in February the unemployment rate unexpectedly jumped to 3.9%, the highest since February 2022 (with Black unemployment spiking by 0.3% to 5.6%, an indicator which the Biden admin will quickly slam as widespread economic racism or something).

And then there were average hourly earnings, which after surging 0.6% MoM in January (since revised to 0.5%) and spooking markets that wage growth is so hot, the Fed will have no choice but to delay cuts, in February the number tumbled to just 0.1%, the lowest in two years...

... for one simple reason: last month's average wage surge had nothing to do with actual wages, and everything to do with the BLS estimate of hours worked (which is the denominator in the average wage calculation) which last month tumbled to just 34.1 (we were led to believe) the lowest since the covid pandemic...

... but has since been revised higher while the February print rose even more, to 34.3, hence why the latest average wage data was once again a product not of wages going up, but of how long Americans worked in any weekly period, in this case higher from 34.1 to 34.3, an increase which has a major impact on the average calculation.

While the above data points were examples of some latent weakness in the latest report, perhaps meant to give it a sheen of veracity, it was everything else in the report that was a problem starting with the BLS's latest choice of seasonal adjustments (after last month's wholesale revision), which have gone from merely laughable to full clownshow, as the following comparison between the monthly change in BLS and ADP payrolls shows. The trend is clear: the Biden admin numbers are now clearly rising even as the impartial ADP (which directly logs employment numbers at the company level and is far more accurate), shows an accelerating slowdown.

But it's more than just the Biden admin hanging its "success" on seasonal adjustments: when one digs deeper inside the jobs report, all sorts of ugly things emerge... such as the growing unprecedented divergence between the Establishment (payrolls) survey and much more accurate Household (actual employment) survey. To wit, while in January the BLS claims 275K payrolls were added, the Household survey found that the number of actually employed workers dropped for the third straight month (and 4 in the past 5), this time by 184K (from 161.152K to 160.968K).

This means that while the Payrolls series hits new all time highs every month since December 2020 (when according to the BLS the US had its last month of payrolls losses), the level of Employment has not budged in the past year. Worse, as shown in the chart below, such a gaping divergence has opened between the two series in the past 4 years, that the number of Employed workers would need to soar by 9 million (!) to catch up to what Payrolls claims is the employment situation.

There's more: shifting from a quantitative to a qualitative assessment, reveals just how ugly the composition of "new jobs" has been. Consider this: the BLS reports that in February 2024, the US had 132.9 million full-time jobs and 27.9 million part-time jobs. Well, that's great... until you look back one year and find that in February 2023 the US had 133.2 million full-time jobs, or more than it does one year later! And yes, all the job growth since then has been in part-time jobs, which have increased by 921K since February 2023 (from 27.020 million to 27.941 million).

Here is a summary of the labor composition in the past year: all the new jobs have been part-time jobs!

But wait there's even more, because now that the primary season is over and we enter the heart of election season and political talking points will be thrown around left and right, especially in the context of the immigration crisis created intentionally by the Biden administration which is hoping to import millions of new Democratic voters (maybe the US can hold the presidential election in Honduras or Guatemala, after all it is their citizens that will be illegally casting the key votes in November), what we find is that in February, the number of native-born workers tumbled again, sliding by a massive 560K to just 129.807 million. Add to this the December data, and we get a near-record 2.4 million plunge in native-born workers in just the past 3 months (only the covid crash was worse)!

The offset? A record 1.2 million foreign-born (read immigrants, both legal and illegal but mostly illegal) workers added in February!

Said otherwise, not only has all job creation in the past 6 years has been exclusively for foreign-born workers...

... but there has been zero job-creation for native born workers since June 2018!

This is a huge issue - especially at a time of an illegal alien flood at the southwest border...

... and is about to become a huge political scandal, because once the inevitable recession finally hits, there will be millions of furious unemployed Americans demanding a more accurate explanation for what happened - i.e., the illegal immigration floodgates that were opened by the Biden admin.
Which is also why Biden's handlers will do everything in their power to insure there is no official recession before November... and why after the election is over, all economic hell will finally break loose. Until then, however, expect the jobs numbers to get even more ridiculous.


Wendy’s has a new deal for daylight savings time haters


Mortgage rates fall as labor market normalizes


Racial and Ethnic Wealth Inequality in the Post‑Pandemic Era


Wealth Inequality by Age in the Post‑Pandemic Era


Shipping company files surprise Chapter 7 bankruptcy, liquidation


Interest rates, the best it gets. It’s time to deploy cash


Is the biotech market rally real? Data suggest comeback in private, public markets


February Employment Situation
Wendy’s teases new $3 offer for upcoming holiday


Economic Earthquake Ahead? The Cracks Are Spreading Fast
-

 Uncategorized2 weeks ago
All Of The Elements Are In Place For An Economic Crisis Of Staggering Proportions
-

 Uncategorized1 month ago
Cathie Wood sells a major tech stock (again)
-

 Uncategorized3 weeks ago
California Counties Could Be Forced To Pay $300 Million To Cover COVID-Era Program
-

 Uncategorized2 weeks ago
Apparel Retailer Express Moving Toward Bankruptcy
-

 Uncategorized3 weeks ago
Industrial Production Decreased 0.1% in January
-

 International2 days ago
Walmart launches clever answer to Target’s new membership program
-

 International2 days ago
EyePoint poaches medical chief from Apellis; Sandoz CFO, longtime BioNTech exec to retire
-

 Uncategorized3 weeks ago
RFK Jr: The Wuhan Cover-Up & The Rise Of The Biowarfare-Industrial Complex