Uncategorized
New Pacific Intersects 524 Metres Grading 1.24 Grams Per Tonne Gold at the Carangas Project, Bolivia
New Pacific Intersects 524 Metres Grading 1.24 Grams Per Tonne Gold at the Carangas Project, Bolivia
PR Newswire
VANCOUVER, BC, Feb. 21, 2023
VANCOUVER, BC, Feb. 21, 2023 /PRNewswire/ – New Pacific Metals Corp. (“New Pacific” or the “Company”) (TS…
Share this:

New Pacific Intersects 524 Metres Grading 1.24 Grams Per Tonne Gold at the Carangas Project, Bolivia
PR Newswire
VANCOUVER, BC, Feb. 21, 2023
VANCOUVER, BC, Feb. 21, 2023 /PRNewswire/ - New Pacific Metals Corp. ("New Pacific" or the "Company") (TSX: NUAG) (NYSE American: NEWP), together with its local Bolivian partner, reports assay results from a deep drill hole DCAr0096 from the 2022 drill program at its Carangas Silver-Gold Project, Oruro Department, Bolivia (the "Carangas Project" or the "Project"). To date, assay results of 86 drill holes from the 115 holes drilled in 2022 have been received and released while results of the remaining 29 drill holes are pending. Assay results and drill hole specifications are listed in Tables 1 and 2.
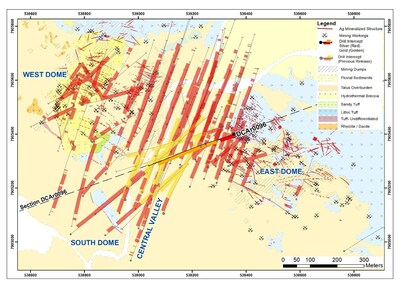
Hole DCAr0096 stepped out 60 m from hole DCAr0044 towards the northeast at the East Dome (Figures 1 & 2) and was drilled to the southwest at a 252-degree azimuth. As reported on August 8, 2022, hole DCAr0044 intercepted 515 m (from 266 m to 781 m) grading 1.10 g/t Au and 6 g/t Ag, including 88 m grading 2.57 g/t Au, 9 g/t Ag and 0.12% Cu (Figure 2).
Starting from surface, Hole DCAr0096 first intersected a silver horizon with a 164 m interval grading 94 g/t Ag, 0.65% Pb and 1.72% Zn, including a 44 m interval grading 289 g/t Ag, 1.61% Pb and 4.00% Zn. Then from 192 m to 319 m a polymetallic Pb-Zn-Au zone was intercepted with a 127 m interval grading 0.24 g/t Au, 5 g/t Ag, 0.26% Pb and 0.54% Zn.
Further down hole DCAr0096, from 333 m to 857 m, a gold zone similar to hole DCAr0044 (Figure 2) was intercepted with a 524 m interval @ 1.24 g/t Au and 8 g/t Ag, including 51 m @ 4.56 g/t Au and 0.10% Cu, and 35 m @ 3.35 g/t Au, 8 g/t Ag and 0.20% Cu. Hole DCAr0096 has extended the thick gold mineralization at least 60 m to the northeast.
The most interesting finding from this hole is that high grade gold intervals occur in rhyolites with disseminated pyrite preferentially along flow-banded textures, as shown in drill core (Figure 3). In addition, high gold assay grades also occur along the contacts of rhyolites with strongly altered volcanoclastic rocks, implying that gold mineralization is related to the rhyolite intrusion. The mineralized rhyolites in hole DCAr0096 are likely part of a feeder zone to the northeast whereas previously, gold mineralization was thought to have extended to the south at depth.
Table 1 Summary of Drill Intercepts | ||||||||||
Hole_ID | Depth_from | Depth_to | Interval_m | Ag_g/t | Au_g/t | Pb_% | Zn_% | Cu_% | AgEq_g/t | |
DCAr0096 | 0.68 | 164.70 | 164.02 | 94 | 0.01 | 0.65 | 1.72 | 0.02 | 173 | |
incl. | 63.39 | 107.70 | 44.31 | 289 | 0.01 | 1.61 | 4.00 | 0.04 | 475 | |
191.71 | 318.94 | 127.23 | 5 | 0.24 | 0.26 | 0.54 | 0.01 | 49 | ||
333.45 | 857.37 | 523.92 | 8 | 1.24 | 0.02 | 0.03 | 0.09 | 107 | ||
incl. | 431.00 | 482.20 | 51.20 | 20 | 4.56 | 0.05 | 0.02 | 0.10 | 356 | |
incl. | 533.44 | 568.08 | 34.64 | 8 | 3.35 | 0.03 | 0.03 | 0.20 | 269 | |
Notes: |
1. Drill location, altitude, azimuth, and dip of drill holes are provided in Table 2 |
2. Drill intercept is core length, and grade is length weighted. True width of mineralization is unknown due to the early stage of exploration without adequate drill data. |
Calculation of silver equivalent ("AgEq") is based on the long-term median of the August 2021 Street Consensus Commodity Price Forecasts, which are US$22.50/oz for Ag, US$0.95/lb for Pb, US$1.10/lb for Zn, US$3.40/lb for Cu, and US$1,600/oz for Au. The formula used for the AgEq calculation is as follows: AgEq = Ag g/t + Pb g/t * 0.0029 + Zn g/t * 0.00335 + Cu g/t * 0.01036 + Au g/t * 71.1111. This calculation assumes 100% recovery. |
3. A cut-off of 20 g/t AgEq is applied to calculate the length-weighted intercept. At times, samples lower than 20 g/t AgEq may be included in the calculation of consolidation of mineralized intercepts. |
Figure 1 Simplified Geology and Drill Plan Map of the Carangas Project
 (CNW Group/New Pacific Metals Corp.)")
Figure 3 Core Photo of Mineralized Rhyolite from 453 m to 457 m in Hole DCAr0096
")
Assay results of Ag, Pb, Zn, Au and Cu are plotted for drill holes within a slice thickness of 400 m (+/- 200m) along cross section of hole DCAr0096, as shown in Figure 4 below. The assay results show apparent metal zoning: 1) gold-copper mineralization occurs at the centre related to rhyolite intrusions; 2) surrounded by a lower temperature polymetallic lead-zinc zone; and 3) a thick silver (plus lead and zinc) zone near surface.
A reasonable geological hypothesis for the Carangas Project supposes that rhyolites intruded into sub-horizontal volcanoclastic units and introduced hydrothermal fluids and metals that precipitated according to temperature gradients. Based on the intensity of mineralization the rhyolitic intrusive appears to dip to the northeast and will be the target of future drilling.
Based on this metal zoning and mineralization model, as well as the drill results from DCAr0096, nine deep holes are planned to step out to the east of DCAr0096 to test the potential extension of gold mineralization down dip of the interpreted orientation of the rhyolite intrusive. Concurrently, shallow holes are planned to test the southwest limb of the near-surface silver zone.
Figure 4: Cross Section DCAr0096 Assay Results (+/- 200m) Display Clear Zoning of Mineralization
 Display Clear Zoning of Mineralization (CNW Group/New Pacific Metals Corp.)")
Table 2 Summary of Drill Holes of Carangas Project | |||||||
Hole_id | Easting | Northing | Altitude | Depth_m | Azimuth (°) | Dip (°) | Target |
DCAr0096 | 539353.75 | 7905398.90 | 3919.75 | 950.00 | 252 | -70 | CV |
Note: | 1. Drill collar coordinate system is WGS1984 UTM Zone 19S | ||||||
2. Coordinate of drill collar is picked with Real Time Kinematics (RTK) GPS | |||||||
3. CV - Central Valley | |||||||
The Company maintains tight sample security and QA/QC for all aspects of its exploration program at the Carangas Project. Drill core is logged, photographed and split on-site by the company and stored under secure conditions until being shipped in security-sealed bags by New Pacific staff in Company vehicles, directly from the project to ALS Global in Oruro, Bolivia for preparation, and ALS Global in Lima, Peru for geochemical analysis. ALS Global is an ISO 17025 accredited laboratory independent from New Pacific. All samples are first analyzed by a multi-element ICP package (ALS code ME-MS41) with ore grade specified limits for silver, lead, and zinc, further analyzed using ALS code OG46. Further silver samples over specified limits are analyzed by gravimetric analysis (ALS code of GRA21). Gold is assayed first by ICP and then by fire assay with AAS finish (ALS code of Au-AA25). Certified reference materials, various types of blank samples and duplicate samples are inserted into normal drill core sample sequences prior to delivery to the laboratory for preparation and analysis. The overall ratio of quality control samples in sample sequences is around twenty percent.
The scientific and technical information contained in this news release has been reviewed and approved by Alex Zhang, P. Geo., Vice President of Exploration, who is a Qualified Person for the purposes of National Instrument 43-101 — Standards of Disclosure for Mineral Projects ("NI 43-101"). The Qualified Person has verified the information disclosed herein using standard verification processes, including the sampling, preparation, security and analytical procedures underlying such information, and is not aware of any significant risks and uncertainties or any limitations on the verification process that could be expected to affect the reliability or confidence in the information discussed herein.
New Pacific is a Canadian exploration and development company with precious metal projects in Bolivia. The Company's flagship Project, the Silver Sand Silver Project, has released its inaugural preliminary economic assessment (the "PEA") results in January 2023. The PEA study shows a post-tax NPV (5% discount) of US$726 million with an IRR of 39%, underpinned by a total silver production of 171 million ounces over 14 years of mine life. At the recently discovered Carangas Silver-Gold Project, a resource drilling program of more than 50,000 meters was completed in 2022. The third project, the Silverstrike Silver-Gold Project, had a 6,000 metre discovery drill program in June 2022.
For further information, please contact:
Andrew Williams, President
New Pacific Metals Corp.
Phone: (604) 633-1368 Ext. 236
U.S. & Canada toll-free: 1-877-631-0593
E-mail: invest@newpacificmetals.com
For additional information and to receive company news by e-mail, please register using New Pacific's website at www.newpacificmetals.com.
The PEA study results of Silver Sand Project are preliminary in nature and are intended to provide an initial assessment of the project's economic potential and development options. The PEA mine schedule and economic assessment includes numerous assumptions and is based on both Indicated and Inferred mineral resources. Inferred resources are considered too speculative geologically to have the economic considerations applied to them that would enable them to be categorized as mineral reserves, and there is no certainty that the project economic assessments described herein will be achieved or that the PEA results will be realized. The estimate of mineral resources may be materially affected by geology, environmental, permitting, legal, title, socio-political, marketing or other relevant issues. Mineral Resources are not Mineral Reserves and do not have demonstrated economic viability. Additional exploration will be required to potentially upgrade the classification of the Inferred Mineral Resources to be considered in future advanced studies. AMC Mining Consultants (Canada) Ltd. (mineral resource, mining, infrastructure and financial analysis) was contracted to conduct the PEA in cooperation with Halyard Inc. (metallurgy and processing), and NewFields Canada Mining & Environment ULC (tailings, water and waste management). The Qualified Persons for the PEA are Mr. Wayne Rogers P.Eng and Mr. Mo Molavi P.Eng both Principal Mining Engineers with AMC Mining Consultants (Canada) Ltd, Mr. Andy Holloway P.Eng, Process Director with Halyard Inc., and Mr. Leon Botham P.Eng., Principal Engineer with NewFields Canada Mining & Environment ULC. This is in addition to Ms. Dinara Nussipakynova, P.Geo., Principal Geologist with AMC Consultants (Canada) Ltd. who estimated the Mineral Resources. All QPs have reviewed the technical content of the January 9, 2023, news release for the Silver Sand deposit and have approved its dissemination. The Silver Sand PEA is based on the updated Mineral Resource Estimate which was reported on November 28, 2022. The effective date of the 2022 Mineral Resource Estimate for Silver Sand is 31 October 2022. The cut-off applied for reporting the pit-constrained Mineral Resources is 30 g/t silver. Assumptions made to derive a cut-off grade included mining costs, processing costs and recoveries and were obtained from comparable industry situations. The model is depleted for historical mining activities. Mineral Resources are constrained by optimized pit shells at a silver price of US$22.50 per ounce, silver metallurgical recovery of 91%, silver payability of 99%, open pit mining cost of US$2.6/t, processing cost of US$16/t, G&A cost of US$2/t, and slope angle of 44-47 degrees. Key assumptions used for pit optimization for the PEA mining pit include silver price of US$22.50 per ounce, silver metallurgical recovery of 91%, silver payability of 99%, open pit mining cost of US$2.6/t, incremental mining cost of US$0.04/t (per 10 m bench), processing cost of US$16/t, tailing storage facility operating cost of US$0.7/t, G&A cost of US$2/t, royalty of 6.00%, mining recovery of 92%, dilution of 8%, and cut-off grade of 30 g/t silver.
Certain of the statements and information in this news release constitute "forward-looking statements" within the meaning of the United States Private Securities Litigation Reform Act of 1995 and "forward-looking information" within the meaning of applicable Canadian provincial securities laws. Any statements or information that express or involve discussions with respect to predictions, expectations, beliefs, plans, projections, objectives, assumptions, or future events or performance (often, but not always, using words or phrases such as "expects", "is expected", "anticipates", "believes", "plans", "projects", "estimates", "assumes", "intends", "strategies", "targets", "goals", "forecasts", "objectives", "budgets", "schedules", "potential" or variations thereof or stating that certain actions, events or results "may", "could", "would", "might" or "will" be taken, occur or be achieved, or the negative of any of these terms and similar expressions) are not statements of historical fact and may be forward-looking statements or information. Such statements include, but are not limited to: statements regarding anticipated exploration, drilling, development, construction, and other activities or achievements of the Company; timing of receipt of permits and regulatory approvals; and estimates of the Company's revenues and capital expenditures; and other future plans, objectives or expectations of the Company.
Forward-looking statements or information are subject to a variety of known and unknown risks, uncertainties and other factors that could cause actual events or results to differ from those reflected in the forward-looking statements or information, including, without limitation, risks relating to: global economic and social impact of COVID-19; fluctuating equity prices, bond prices, commodity prices; calculation of resources, reserves and mineralization, general economic conditions, foreign exchange risks, interest rate risk, foreign investment risk; loss of key personnel; conflicts of interest; dependence on management, uncertainties relating to the availability and costs of financing needed in the future, environmental risks, operations and political conditions, the regulatory environment in Bolivia and Canada; risks associated with community relations and corporate social responsibility, and other factors described under the heading "Risk Factors" in the Company's Annual Information Form for the year ended June 30, 2022 and its other public filings.
This list is not exhaustive of the factors that may affect any of the Company's forward-looking statements or information.
The forward-looking statements are necessarily based on a number of estimates, assumptions, beliefs, expectations and opinions of management as of the date of this news release that, while considered reasonable by management, are inherently subject to significant business, economic and competitive uncertainties and contingencies. These estimates, assumptions, beliefs, expectations and options include, but are not limited to, those related to the Company's ability to carry on current and future operations, including: the duration and effects of COVID-19 on our operations and workforce; development and exploration activities; the timing, extent, duration and economic viability of such operations; the accuracy and reliability of estimates, projections, forecasts, studies and assessments; the Company's ability to meet or achieve estimates, projections and forecasts; the stabilization of the political climate in Bolivia; the Company's ability to obtain and maintain social license at its mineral properties; the availability and cost of inputs; the price and market for outputs; foreign exchange rates; taxation levels; the timely receipt of necessary approvals or permits, including the ratification and approval of the Mining Production Contract with COMIBOL by the Plurinational Legislative Assembly of Bolivia; the ability of the Company's Bolivian partner to convert the exploration licenses at the Carangas Project to AMC; the ability to meet current and future obligations; the ability to obtain timely financing on reasonable terms when required; the current and future social, economic and political conditions; and other assumptions and factors generally associated with the mining industry.
Although the forward-looking statements contained in this news release are based upon what management believes are reasonable assumptions, there can be no assurance that actual results will be consistent with these forward-looking statements. All forward-looking statements in this news release are qualified by these cautionary statements. Accordingly, readers should not place undue reliance on such statements. Other than specifically required by applicable laws, the Company is under no obligation and expressly disclaims any such obligation to update or alter the forward-looking statements whether as a result of new information, future events or otherwise except as may be required by law. These forward-looking statements are made as of the date of this news release.
This news release has been prepared in accordance with the requirements of the securities laws in effect in Canada which differ from the requirements of United States securities laws. The technical and scientific information contained herein has been prepared in accordance with NI 43-101, which differs from the standards adopted by the U.S. Securities and Exchange Commission (the "SEC"). Accordingly, the technical and scientific information contained herein, including any estimates of mineral reserves and mineral resources, may not be comparable to similar information disclosed by U.S. companies subject to the disclosure requirements of the SEC.
Additional information relating to the Company, including the Company's Annual Information Form, can be obtained under the Company's profile on SEDAR at www.sedar.com, on EDGAR at www.sec.gov, and on the Company's website at www.newpacificmetals.com.
View original content to download multimedia:https://www.prnewswire.com/news-releases/new-pacific-intersects-524-metres-grading-1-24-grams-per-tonne-gold-at-the-carangas-project-bolivia-301751690.html
SOURCE New Pacific Metals Corp.
Uncategorized
February Employment Situation
By Paul Gomme and Peter Rupert The establishment data from the BLS showed a 275,000 increase in payroll employment for February, outpacing the 230,000…
Share this:


By Paul Gomme and Peter Rupert
The establishment data from the BLS showed a 275,000 increase in payroll employment for February, outpacing the 230,000 average over the previous 12 months. The payroll data for January and December were revised down by a total of 167,000. The private sector added 223,000 new jobs, the largest gain since May of last year.

Temporary help services employment continues a steep decline after a sharp post-pandemic rise.


Average hours of work increased from 34.2 to 34.3. The increase, along with the 223,000 private employment increase led to a hefty increase in total hours of 5.6% at an annualized rate, also the largest increase since May of last year.

The establishment report, once again, beat “expectations;” the WSJ survey of economists was 198,000. Other than the downward revisions, mentioned above, another bit of negative news was a smallish increase in wage growth, from $34.52 to $34.57.

The household survey shows that the labor force increased 150,000, a drop in employment of 184,000 and an increase in the number of unemployed persons of 334,000. The labor force participation rate held steady at 62.5, the employment to population ratio decreased from 60.2 to 60.1 and the unemployment rate increased from 3.66 to 3.86. Remember that the unemployment rate is the number of unemployed relative to the labor force (the number employed plus the number unemployed). Consequently, the unemployment rate can go up if the number of unemployed rises holding fixed the labor force, or if the labor force shrinks holding the number unemployed unchanged. An increase in the unemployment rate is not necessarily a bad thing: it may reflect a strong labor market drawing “marginally attached” individuals from outside the labor force. Indeed, there was a 96,000 decline in those workers.


Earlier in the week, the BLS announced JOLTS (Job Openings and Labor Turnover Survey) data for January. There isn’t much to report here as the job openings changed little at 8.9 million, the number of hires and total separations were little changed at 5.7 million and 5.3 million, respectively.

As has been the case for the last couple of years, the number of job openings remains higher than the number of unemployed persons.

Also earlier in the week the BLS announced that productivity increased 3.2% in the 4th quarter with output rising 3.5% and hours of work rising 0.3%.

The bottom line is that the labor market continues its surprisingly (to some) strong performance, once again proving stronger than many had expected. This strength makes it difficult to justify any interest rate cuts soon, particularly given the recent inflation spike.
unemployment pandemic unemploymentUncategorized
Mortgage rates fall as labor market normalizes
Jobless claims show an expanding economy. We will only be in a recession once jobless claims exceed 323,000 on a four-week moving average.
Share this:


Everyone was waiting to see if this week’s jobs report would send mortgage rates higher, which is what happened last month. Instead, the 10-year yield had a muted response after the headline number beat estimates, but we have negative job revisions from previous months. The Federal Reserve’s fear of wage growth spiraling out of control hasn’t materialized for over two years now and the unemployment rate ticked up to 3.9%. For now, we can say the labor market isn’t tight anymore, but it’s also not breaking.
The key labor data line in this expansion is the weekly jobless claims report. Jobless claims show an expanding economy that has not lost jobs yet. We will only be in a recession once jobless claims exceed 323,000 on a four-week moving average.
From the Fed: In the week ended March 2, initial claims for unemployment insurance benefits were flat, at 217,000. The four-week moving average declined slightly by 750, to 212,250
Below is an explanation of how we got here with the labor market, which all started during COVID-19.
1. I wrote the COVID-19 recovery model on April 7, 2020, and retired it on Dec. 9, 2020. By that time, the upfront recovery phase was done, and I needed to model out when we would get the jobs lost back.
2. Early in the labor market recovery, when we saw weaker job reports, I doubled and tripled down on my assertion that job openings would get to 10 million in this recovery. Job openings rose as high as to 12 million and are currently over 9 million. Even with the massive miss on a job report in May 2021, I didn’t waver.
Currently, the jobs openings, quit percentage and hires data are below pre-COVID-19 levels, which means the labor market isn’t as tight as it once was, and this is why the employment cost index has been slowing data to move along the quits percentage.

3. I wrote that we should get back all the jobs lost to COVID-19 by September of 2022. At the time this would be a speedy labor market recovery, and it happened on schedule, too
Total employment data
4. This is the key one for right now: If COVID-19 hadn’t happened, we would have between 157 million and 159 million jobs today, which would have been in line with the job growth rate in February 2020. Today, we are at 157,808,000. This is important because job growth should be cooling down now. We are more in line with where the labor market should be when averaging 140K-165K monthly. So for now, the fact that we aren’t trending between 140K-165K means we still have a bit more recovery kick left before we get down to those levels.

From BLS: Total nonfarm payroll employment rose by 275,000 in February, and the unemployment rate increased to 3.9 percent, the U.S. Bureau of Labor Statistics reported today. Job gains occurred in health care, in government, in food services and drinking places, in social assistance, and in transportation and warehousing.
Here are the jobs that were created and lost in the previous month:

In this jobs report, the unemployment rate for education levels looks like this:
- Less than a high school diploma: 6.1%
- High school graduate and no college: 4.2%
- Some college or associate degree: 3.1%
- Bachelor’s degree or higher: 2.2%

Today’s report has continued the trend of the labor data beating my expectations, only because I am looking for the jobs data to slow down to a level of 140K-165K, which hasn’t happened yet. I wouldn’t categorize the labor market as being tight anymore because of the quits ratio and the hires data in the job openings report. This also shows itself in the employment cost index as well. These are key data lines for the Fed and the reason we are going to see three rate cuts this year.
recession unemployment covid-19 fed federal reserve mortgage rates recession recovery unemploymentUncategorized
Inside The Most Ridiculous Jobs Report In History: Record 1.2 Million Immigrant Jobs Added In One Month
Inside The Most Ridiculous Jobs Report In History: Record 1.2 Million Immigrant Jobs Added In One Month
Last month we though that the January…
Share this:


Last month we though that the January jobs report was the "most ridiculous in recent history" but, boy, were we wrong because this morning the Biden department of goalseeked propaganda (aka BLS) published the February jobs report, and holy crap was that something else. Even Goebbels would blush.
What happened? Let's take a closer look.
On the surface, it was (almost) another blockbuster jobs report, certainly one which nobody expected, or rather just one bank out of 76 expected. Starting at the top, the BLS reported that in February the US unexpectedly added 275K jobs, with just one research analyst (from Dai-Ichi Research) expecting a higher number.
Some context: after last month's record 4-sigma beat, today's print was "only" 3 sigma higher than estimates. Needless to say, two multiple sigma beats in a row used to only happen in the USSR... and now in the US, apparently.

Before we go any further, a quick note on what last month we said was "the most ridiculous jobs report in recent history": it appears the BLS read our comments and decided to stop beclowing itself. It did that by slashing last month's ridiculous print by over a third, and revising what was originally reported as a massive 353K beat to just 229K, a 124K revision, which was the biggest one-month negative revision in two years!

Of course, that does not mean that this month's jobs print won't be revised lower: it will be, and not just that month but every other month until the November election because that's the only tool left in the Biden admin's box: pretend the economic and jobs are strong, then revise them sharply lower the next month, something we pointed out first last summer and which has not failed to disappoint once.
In the past month the Biden department of goalseeking stuff higher before revising it lower, has revised the following data sharply lower:
— zerohedge (@zerohedge) August 30, 2023
- Jobs
- JOLTS
- New Home sales
- Housing Starts and Permits
- Industrial Production
- PCE and core PCE
To be fair, not every aspect of the jobs report was stellar (after all, the BLS had to give it some vague credibility). Take the unemployment rate, after flatlining between 3.4% and 3.8% for two years - and thus denying expectations from Sahm's Rule that a recession may have already started - in February the unemployment rate unexpectedly jumped to 3.9%, the highest since February 2022 (with Black unemployment spiking by 0.3% to 5.6%, an indicator which the Biden admin will quickly slam as widespread economic racism or something).

And then there were average hourly earnings, which after surging 0.6% MoM in January (since revised to 0.5%) and spooking markets that wage growth is so hot, the Fed will have no choice but to delay cuts, in February the number tumbled to just 0.1%, the lowest in two years...

... for one simple reason: last month's average wage surge had nothing to do with actual wages, and everything to do with the BLS estimate of hours worked (which is the denominator in the average wage calculation) which last month tumbled to just 34.1 (we were led to believe) the lowest since the covid pandemic...

... but has since been revised higher while the February print rose even more, to 34.3, hence why the latest average wage data was once again a product not of wages going up, but of how long Americans worked in any weekly period, in this case higher from 34.1 to 34.3, an increase which has a major impact on the average calculation.

While the above data points were examples of some latent weakness in the latest report, perhaps meant to give it a sheen of veracity, it was everything else in the report that was a problem starting with the BLS's latest choice of seasonal adjustments (after last month's wholesale revision), which have gone from merely laughable to full clownshow, as the following comparison between the monthly change in BLS and ADP payrolls shows. The trend is clear: the Biden admin numbers are now clearly rising even as the impartial ADP (which directly logs employment numbers at the company level and is far more accurate), shows an accelerating slowdown.

But it's more than just the Biden admin hanging its "success" on seasonal adjustments: when one digs deeper inside the jobs report, all sorts of ugly things emerge... such as the growing unprecedented divergence between the Establishment (payrolls) survey and much more accurate Household (actual employment) survey. To wit, while in January the BLS claims 275K payrolls were added, the Household survey found that the number of actually employed workers dropped for the third straight month (and 4 in the past 5), this time by 184K (from 161.152K to 160.968K).

This means that while the Payrolls series hits new all time highs every month since December 2020 (when according to the BLS the US had its last month of payrolls losses), the level of Employment has not budged in the past year. Worse, as shown in the chart below, such a gaping divergence has opened between the two series in the past 4 years, that the number of Employed workers would need to soar by 9 million (!) to catch up to what Payrolls claims is the employment situation.

There's more: shifting from a quantitative to a qualitative assessment, reveals just how ugly the composition of "new jobs" has been. Consider this: the BLS reports that in February 2024, the US had 132.9 million full-time jobs and 27.9 million part-time jobs. Well, that's great... until you look back one year and find that in February 2023 the US had 133.2 million full-time jobs, or more than it does one year later! And yes, all the job growth since then has been in part-time jobs, which have increased by 921K since February 2023 (from 27.020 million to 27.941 million).

Here is a summary of the labor composition in the past year: all the new jobs have been part-time jobs!

But wait there's even more, because now that the primary season is over and we enter the heart of election season and political talking points will be thrown around left and right, especially in the context of the immigration crisis created intentionally by the Biden administration which is hoping to import millions of new Democratic voters (maybe the US can hold the presidential election in Honduras or Guatemala, after all it is their citizens that will be illegally casting the key votes in November), what we find is that in February, the number of native-born workers tumbled again, sliding by a massive 560K to just 129.807 million. Add to this the December data, and we get a near-record 2.4 million plunge in native-born workers in just the past 3 months (only the covid crash was worse)!

The offset? A record 1.2 million foreign-born (read immigrants, both legal and illegal but mostly illegal) workers added in February!

Said otherwise, not only has all job creation in the past 6 years has been exclusively for foreign-born workers...

... but there has been zero job-creation for native born workers since June 2018!

This is a huge issue - especially at a time of an illegal alien flood at the southwest border...

... and is about to become a huge political scandal, because once the inevitable recession finally hits, there will be millions of furious unemployed Americans demanding a more accurate explanation for what happened - i.e., the illegal immigration floodgates that were opened by the Biden admin.
Which is also why Biden's handlers will do everything in their power to insure there is no official recession before November... and why after the election is over, all economic hell will finally break loose. Until then, however, expect the jobs numbers to get even more ridiculous.


)
+Display+Clear+Zoning+of+Mineralization)
-

 Uncategorized2 weeks ago
All Of The Elements Are In Place For An Economic Crisis Of Staggering Proportions
-

 Uncategorized1 month ago
Cathie Wood sells a major tech stock (again)
-

 Uncategorized3 weeks ago
California Counties Could Be Forced To Pay $300 Million To Cover COVID-Era Program
-

 Uncategorized2 weeks ago
Apparel Retailer Express Moving Toward Bankruptcy
-

 Uncategorized3 weeks ago
Industrial Production Decreased 0.1% in January
-

 International3 days ago
Walmart launches clever answer to Target’s new membership program
-

 International3 days ago
EyePoint poaches medical chief from Apellis; Sandoz CFO, longtime BioNTech exec to retire
-

 Uncategorized3 weeks ago
RFK Jr: The Wuhan Cover-Up & The Rise Of The Biowarfare-Industrial Complex