Uncategorized
MSP Recovery (NASDAQ: LIFW) in the Spotlight: Legal Battles, Luxe Living, and Stock Surge
MSP Recovery (NASDAQ: LIFW) has been on quite the rollercoaster ride, defying gravity with over 400% gain since September 14th, 2023 with over 240% of…
Share this:

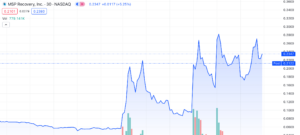
MSP Recovery (NASDAQ: LIFW) has been on quite the rollercoaster ride, defying gravity with over 400% gain since September 14th, 2023 with over 240% of that gain happening this week alone. However, the exact reasons behind this meteoric rise remain elusive. Typically, when a company drops major news, you’d expect an instant stock reaction. But in this case, the last significant update from the company was about a week ago, and it’s questionable whether that news was much on the positive side, yet the stock is still zooming upwards.
Background:
Let’s delve into the nitty-gritty of what MSP Recovery, more prominently known as LifeWallet, is all about. Imagine them as the healthcare financial detectives, diligently sifting through the complexities of medical billing and reimbursements. They specialize in recovering money owed to healthcare providers. If an insurance company owes a hospital for a patient’s treatment, these folks ensure that the hospital gets the rightful compensation. But their innovation doesn’t stop there.
Enter “LifeWallet,” their brainchild—a powerful tool designed to revolutionize healthcare transactions. Picture it as a savvy assistant for healthcare professionals, standing by their side in the hustle and bustle of medical care. LifeWallet’s magic lies in its ability to decipher the complexities of healthcare billing and insurance. It guides doctors and hospitals, helping them navigate the tangled web of who should foot the bill, especially in post-accident treatments. It’s a digital ally ensuring fair compensation and smooth financial transactions in the intricate healthcare landscape.
Subscribe to Microcapdaily.com Right Now by entering your Email in the box below.
Subscribe to Our 100% Free Penny Stock Newsletter. We Have Something Big Coming!
MSP is making waves in the healthcare domain with this innovative approach, leveraging data analytics to streamline processes and champion fair compensation for healthcare providers. Much like a rollercoaster ride, their journey promises excitement, surprises, and an undeniable thrill in the world of healthcare finances.
Legal Battles and CEO Extravagnce:
Step back and look at their stock chart—MSP has taken a major hit in value this year, and it’s not without reason. Surprisingly, digging into the company’s operations revealed some unpleasant surprises we hadn’t anticipated. It’s been a rough ride for them.
The company was just recently involved in a class action law suit led by recognized leader in shareholder rights litigation, Robbins LLP. The case revolved around MSP not providing essential information to investors transparently.
There were a number of claims mentioned, here’s a quick list.
- MSP didn’t reveal there was an ongoing investigation by the SEC and federal prosecutors.
- They gave out financial information to investors that was significantly wrong and deceptive.
- When admitting they needed to fix their financial results, they didn’t reveal the full extent of the issues.
- MSP couldn’t financially handle the claims they were assigned to manage by a major health and engaged in deceitful actions with said provider
- The Registration Statement had lots of wrong or misleading statements and was poorly prepared.
- Their Proxy also had false or misleading statements.
It all started on July 31, 2023, where The Miami Herald unveiled significant revelations. Stating the CEO John H. Ruiz has been living quite the lifestyle buying several waterfront mansions in Miami, even an entire Boeing passenger jet.
It’s not surprising the Ruiz’s lifestyle was so extravagant considering LifeWallet was once valued at more than $32 billion, but as you can see the company is now worth a small fraction of that. That said, Ruiz’s expensive lifestyle would be tough to continue.
Then again, on August 1, 2023, the Company made disclosures to the SEC (Form 8-K), confirming The Miami Herald’s findings. The stock took another substantial hit, dropping over 12%. Adding to the unfolding drama. After that, a substantial $67 million lawsuit was filed against the Company on the same day, resulting in an 18% plummet in the stock price.
The narrative continues on! On August 17, 2023, MSP acknowledged a notification letter from Nasdaq’s Listing Qualifications Department. They confirmed the Company’s non-compliance with Nasdaq’s Rule 5250(c)(1) due to a delayed Form 10-Q filing for the period ending June 30, 2023. This revelation caused a 19% stock price drop over two days.
With that said, we’ll bet you’re seriously wondering how could this company could possibly see recovery (pun intended) after all these allegations were laid out.
What happened:
Surprisingly enough, it seems Robbins LLP just recently lost the case against MSP and there was an announcement made on September 13th, 2023 about it. All those allegations have vanished into thin air. It’s baffling how a company with so many strikes against it can seemingly wrap things up so quickly. The whole situation leaves us questioning what’s really going on.
Since the announcement the other week, the company’s valuation has skyrocketed, at some points even peaking at an increase of over 400%. Naturally with that kind of trading action, it’s no surprise day traders are getting in on the action. MSP is trending all over Twitter amongst notable users like @timothysykes, @stockplaymaker1, and @AngryRed316 talking about it.
At this point, it looks like investors are basing their trades more on chart patterns and less on the company’s solid financial footing. MSP didn’t deliver great news in its latest earnings report, showing quite a large net loss of over $400 million. It’s quite likely the allegations had a role to play in this financial blow. The real question is if MSP can get its act together, start making real profits, and avoid a chapter 11. Either way, we’ll continue to follow along to see how things pan out!
We will update you on LIFW when more details emerge, subscribe to Microcapdaily to follow along!
Subscribe to Our 100% Free Penny Stock Newsletter. We Have Something Big Coming!
Disclosure: We have not been compensated for this article/video. MicroCap Daily is not an investment advisor; this article/video does not provide investment advice. Always do your research, make your own investment decisions, or consult with your nearest financial advisor. This article/video is not a solicitation or recommendation to buy, sell, or hold securities. This article/video is our opinion, is meant for informational and educational purposes only, and does not provide investment advice. Past performance is not indicative of future performance.
Picture geralt by from Pixabay.com
The post MSP Recovery (NASDAQ: LIFW) in the Spotlight: Legal Battles, Luxe Living, and Stock Surge first appeared on Micro Cap Daily.
The post MSP Recovery (NASDAQ: LIFW) in the Spotlight: Legal Battles, Luxe Living, and Stock Surge appeared first on Micro Cap Daily.
nasdaq treatment recoveryUncategorized
Homes listed for sale in early June sell for $7,700 more
New Zillow research suggests the spring home shopping season may see a second wave this summer if mortgage rates fall
The post Homes listed for sale in…
Share this:


- A Zillow analysis of 2023 home sales finds homes listed in the first two weeks of June sold for 2.3% more.
- The best time to list a home for sale is a month later than it was in 2019, likely driven by mortgage rates.
- The best time to list can be as early as the second half of February in San Francisco, and as late as the first half of July in New York and Philadelphia.
Spring home sellers looking to maximize their sale price may want to wait it out and list their home for sale in the first half of June. A new Zillow® analysis of 2023 sales found that homes listed in the first two weeks of June sold for 2.3% more, a $7,700 boost on a typical U.S. home.
The best time to list consistently had been early May in the years leading up to the pandemic. The shift to June suggests mortgage rates are strongly influencing demand on top of the usual seasonality that brings buyers to the market in the spring. This home-shopping season is poised to follow a similar pattern as that in 2023, with the potential for a second wave if the Federal Reserve lowers interest rates midyear or later.
The 2.3% sale price premium registered last June followed the first spring in more than 15 years with mortgage rates over 6% on a 30-year fixed-rate loan. The high rates put home buyers on the back foot, and as rates continued upward through May, they were still reassessing and less likely to bid boldly. In June, however, rates pulled back a little from 6.79% to 6.67%, which likely presented an opportunity for determined buyers heading into summer. More buyers understood their market position and could afford to transact, boosting competition and sale prices.
The old logic was that sellers could earn a premium by listing in late spring, when search activity hit its peak. Now, with persistently low inventory, mortgage rate fluctuations make their own seasonality. First-time home buyers who are on the edge of qualifying for a home loan may dip in and out of the market, depending on what’s happening with rates. It is almost certain the Federal Reserve will push back any interest-rate cuts to mid-2024 at the earliest. If mortgage rates follow, that could bring another surge of buyers later this year.
Mortgage rates have been impacting affordability and sale prices since they began rising rapidly two years ago. In 2022, sellers nationwide saw the highest sale premium when they listed their home in late March, right before rates barreled past 5% and continued climbing.
Zillow’s research finds the best time to list can vary widely by metropolitan area. In 2023, it was as early as the second half of February in San Francisco, and as late as the first half of July in New York. Thirty of the top 35 largest metro areas saw for-sale listings command the highest sale prices between May and early July last year.
Zillow also found a wide range in the sale price premiums associated with homes listed during those peak periods. At the hottest time of the year in San Jose, homes sold for 5.5% more, a $88,000 boost on a typical home. Meanwhile, homes in San Antonio sold for 1.9% more during that same time period.
| Metropolitan Area | Best Time to List | Price Premium | Dollar Boost |
| United States | First half of June | 2.3% | $7,700 |
| New York, NY | First half of July | 2.4% | $15,500 |
| Los Angeles, CA | First half of May | 4.1% | $39,300 |
| Chicago, IL | First half of June | 2.8% | $8,800 |
| Dallas, TX | First half of June | 2.5% | $9,200 |
| Houston, TX | Second half of April | 2.0% | $6,200 |
| Washington, DC | Second half of June | 2.2% | $12,700 |
| Philadelphia, PA | First half of July | 2.4% | $8,200 |
| Miami, FL | First half of June | 2.3% | $12,900 |
| Atlanta, GA | Second half of June | 2.3% | $8,700 |
| Boston, MA | Second half of May | 3.5% | $23,600 |
| Phoenix, AZ | First half of June | 3.2% | $14,700 |
| San Francisco, CA | Second half of February | 4.2% | $50,300 |
| Riverside, CA | First half of May | 2.7% | $15,600 |
| Detroit, MI | First half of July | 3.3% | $7,900 |
| Seattle, WA | First half of June | 4.3% | $31,500 |
| Minneapolis, MN | Second half of May | 3.7% | $13,400 |
| San Diego, CA | Second half of April | 3.1% | $29,600 |
| Tampa, FL | Second half of June | 2.1% | $8,000 |
| Denver, CO | Second half of May | 2.9% | $16,900 |
| Baltimore, MD | First half of July | 2.2% | $8,200 |
| St. Louis, MO | First half of June | 2.9% | $7,000 |
| Orlando, FL | First half of June | 2.2% | $8,700 |
| Charlotte, NC | Second half of May | 3.0% | $11,000 |
| San Antonio, TX | First half of June | 1.9% | $5,400 |
| Portland, OR | Second half of April | 2.6% | $14,300 |
| Sacramento, CA | First half of June | 3.2% | $17,900 |
| Pittsburgh, PA | Second half of June | 2.3% | $4,700 |
| Cincinnati, OH | Second half of April | 2.7% | $7,500 |
| Austin, TX | Second half of May | 2.8% | $12,600 |
| Las Vegas, NV | First half of June | 3.4% | $14,600 |
| Kansas City, MO | Second half of May | 2.5% | $7,300 |
| Columbus, OH | Second half of June | 3.3% | $10,400 |
| Indianapolis, IN | First half of July | 3.0% | $8,100 |
| Cleveland, OH | First half of July | 3.4% | $7,400 |
| San Jose, CA | First half of June | 5.5% | $88,400 |
The post Homes listed for sale in early June sell for $7,700 more appeared first on Zillow Research.
federal reserve pandemic home sales mortgage rates interest ratesUncategorized
February Employment Situation
By Paul Gomme and Peter Rupert The establishment data from the BLS showed a 275,000 increase in payroll employment for February, outpacing the 230,000…
Share this:


By Paul Gomme and Peter Rupert
The establishment data from the BLS showed a 275,000 increase in payroll employment for February, outpacing the 230,000 average over the previous 12 months. The payroll data for January and December were revised down by a total of 167,000. The private sector added 223,000 new jobs, the largest gain since May of last year.

Temporary help services employment continues a steep decline after a sharp post-pandemic rise.


Average hours of work increased from 34.2 to 34.3. The increase, along with the 223,000 private employment increase led to a hefty increase in total hours of 5.6% at an annualized rate, also the largest increase since May of last year.

The establishment report, once again, beat “expectations;” the WSJ survey of economists was 198,000. Other than the downward revisions, mentioned above, another bit of negative news was a smallish increase in wage growth, from $34.52 to $34.57.

The household survey shows that the labor force increased 150,000, a drop in employment of 184,000 and an increase in the number of unemployed persons of 334,000. The labor force participation rate held steady at 62.5, the employment to population ratio decreased from 60.2 to 60.1 and the unemployment rate increased from 3.66 to 3.86. Remember that the unemployment rate is the number of unemployed relative to the labor force (the number employed plus the number unemployed). Consequently, the unemployment rate can go up if the number of unemployed rises holding fixed the labor force, or if the labor force shrinks holding the number unemployed unchanged. An increase in the unemployment rate is not necessarily a bad thing: it may reflect a strong labor market drawing “marginally attached” individuals from outside the labor force. Indeed, there was a 96,000 decline in those workers.


Earlier in the week, the BLS announced JOLTS (Job Openings and Labor Turnover Survey) data for January. There isn’t much to report here as the job openings changed little at 8.9 million, the number of hires and total separations were little changed at 5.7 million and 5.3 million, respectively.

As has been the case for the last couple of years, the number of job openings remains higher than the number of unemployed persons.

Also earlier in the week the BLS announced that productivity increased 3.2% in the 4th quarter with output rising 3.5% and hours of work rising 0.3%.

The bottom line is that the labor market continues its surprisingly (to some) strong performance, once again proving stronger than many had expected. This strength makes it difficult to justify any interest rate cuts soon, particularly given the recent inflation spike.
unemployment pandemic unemploymentUncategorized
Mortgage rates fall as labor market normalizes
Jobless claims show an expanding economy. We will only be in a recession once jobless claims exceed 323,000 on a four-week moving average.
Share this:


Everyone was waiting to see if this week’s jobs report would send mortgage rates higher, which is what happened last month. Instead, the 10-year yield had a muted response after the headline number beat estimates, but we have negative job revisions from previous months. The Federal Reserve’s fear of wage growth spiraling out of control hasn’t materialized for over two years now and the unemployment rate ticked up to 3.9%. For now, we can say the labor market isn’t tight anymore, but it’s also not breaking.
The key labor data line in this expansion is the weekly jobless claims report. Jobless claims show an expanding economy that has not lost jobs yet. We will only be in a recession once jobless claims exceed 323,000 on a four-week moving average.
From the Fed: In the week ended March 2, initial claims for unemployment insurance benefits were flat, at 217,000. The four-week moving average declined slightly by 750, to 212,250
Below is an explanation of how we got here with the labor market, which all started during COVID-19.
1. I wrote the COVID-19 recovery model on April 7, 2020, and retired it on Dec. 9, 2020. By that time, the upfront recovery phase was done, and I needed to model out when we would get the jobs lost back.
2. Early in the labor market recovery, when we saw weaker job reports, I doubled and tripled down on my assertion that job openings would get to 10 million in this recovery. Job openings rose as high as to 12 million and are currently over 9 million. Even with the massive miss on a job report in May 2021, I didn’t waver.
Currently, the jobs openings, quit percentage and hires data are below pre-COVID-19 levels, which means the labor market isn’t as tight as it once was, and this is why the employment cost index has been slowing data to move along the quits percentage.

3. I wrote that we should get back all the jobs lost to COVID-19 by September of 2022. At the time this would be a speedy labor market recovery, and it happened on schedule, too
Total employment data
4. This is the key one for right now: If COVID-19 hadn’t happened, we would have between 157 million and 159 million jobs today, which would have been in line with the job growth rate in February 2020. Today, we are at 157,808,000. This is important because job growth should be cooling down now. We are more in line with where the labor market should be when averaging 140K-165K monthly. So for now, the fact that we aren’t trending between 140K-165K means we still have a bit more recovery kick left before we get down to those levels.

From BLS: Total nonfarm payroll employment rose by 275,000 in February, and the unemployment rate increased to 3.9 percent, the U.S. Bureau of Labor Statistics reported today. Job gains occurred in health care, in government, in food services and drinking places, in social assistance, and in transportation and warehousing.
Here are the jobs that were created and lost in the previous month:

In this jobs report, the unemployment rate for education levels looks like this:
- Less than a high school diploma: 6.1%
- High school graduate and no college: 4.2%
- Some college or associate degree: 3.1%
- Bachelor’s degree or higher: 2.2%

Today’s report has continued the trend of the labor data beating my expectations, only because I am looking for the jobs data to slow down to a level of 140K-165K, which hasn’t happened yet. I wouldn’t categorize the labor market as being tight anymore because of the quits ratio and the hires data in the job openings report. This also shows itself in the employment cost index as well. These are key data lines for the Fed and the reason we are going to see three rate cuts this year.
recession unemployment covid-19 fed federal reserve mortgage rates recession recovery unemployment


-

 Uncategorized3 weeks ago
All Of The Elements Are In Place For An Economic Crisis Of Staggering Proportions
-

 Uncategorized1 month ago
Cathie Wood sells a major tech stock (again)
-

 Uncategorized3 weeks ago
California Counties Could Be Forced To Pay $300 Million To Cover COVID-Era Program
-

 Uncategorized2 weeks ago
Apparel Retailer Express Moving Toward Bankruptcy
-

 Uncategorized4 weeks ago
Industrial Production Decreased 0.1% in January
-

 International3 days ago
Walmart launches clever answer to Target’s new membership program
-

 International3 days ago
EyePoint poaches medical chief from Apellis; Sandoz CFO, longtime BioNTech exec to retire
-

 Uncategorized3 weeks ago
RFK Jr: The Wuhan Cover-Up & The Rise Of The Biowarfare-Industrial Complex