Monetary Policy Is Pushing Americans, Kicking And Screaming, Up The Risk Curve
Monetary Policy Is Pushing Americans, Kicking And Screaming, Up The Risk Curve
Authored by Peter Earle via The American Institute for Economic Research,
The last few weeks in financial markets, particularly in equities, have been some for…
Share this:


Authored by Peter Earle via The American Institute for Economic Research,
The last few weeks in financial markets, particularly in equities, have been some for the books. The colossal short squeeze in GameStop (GME) followed by headhunting for shorts in a handful of other stucks was soon upstaged by a coordinated price surge of the crypto-comedic cryptocurrency Dogecoin. Its market price was pumped up from $0.007 per coin to over $.08 per coin, a surge of roughly 820% and a brief valuation of over $6 billion, although it has since fallen to between two and four cents per coin. Attention was then turned toward the pseudo-cryptocurrency Ripple (XRP), which rose from under $0.30 to $0.75 per token before sliding back down to $0.43.
While there has been an attempt to seize the narrative of exactly what is happening, prevalent explanations don’t tell the full story. A simple stock market transaction was blown up into a metaphor for class warfare (and, predictably, calls for “reform”), with grandiose allusions to small-time plungers “turning the tables” on “the big boys.” And then - of course - politicians leapt into the fray, staking out positions along the borders of their ideological frontiers.
Yet there is a far more important aspect of the meandering stock campaigns last week - which, with the failed r/wallstreetbets attempt to squeeze the silver ETF SLV, seems to be continuing - than roving packs of short interest hunters.
What has fostered the growth of groups like r/wallstreetbets who’ve built a community––indeed, a prideful ethos––around taking outsized risks?

GME as Symptom
First: the risks on both sides of the GME trade were abhorrent.
On the short side, one should consider that because GameStop had traded at an average price of between $10 and $11 per share for over two years, the maximum potential gain was slightly less than that: $9 to $10 per share. And the sizing of a short position is usually assessed to a large extent upon the average daily trading volume of the stock being shorted, such that if a squeeze should begin there is a rough estimate of how difficult it will be to exit the position. With an average daily trading volume (again, over the last two years) of between four and seven million shares per day in Gamestop, one could imagine a short position of one, two, or three million shares (although other factors come into play) at most. Yet the size of the overall short position in the stock was estimated at over 60M shares: not only nearly ten times the high end of the average daily trading volume in GameStock, but thirty percent higher than the actual public float (available shares of stock).
That, to put it mildly, was a fuse just waiting to be lit.
And on the long side, retail online brokerage firms, including Robinhood, generally require $2,000 to open a margin account. Before opening the account, the suitability of the account owner must be assessed (owing to regulatory KYC, or Know Your Customer, rules). The brokerage firm is thus charged with ascertaining that active trading is appropriate for the account. This is a critical consideration in the GameStop affair for two reasons. First, despite arduous efforts to paint the long-short battle as one of David versus Goliath (respectively), the brokerage account customers had to assert, and were assessed, as having some modicum of sophistication before their accounts were open and funded.
And second, the conspiracy theories holding that Robinhood restricted trading in GameStop and other stocks, and in some cases liquidated long positions to protect its (purportedly) fellow Wall Streeters on the short side strongly indicates a deep ignorance about trading on margin and what is, quite flatly, the boilerplate standard in brokerage account paperwork.
In summation, on one side, a handful of hedge funds took massive short positions with less than $10 of upside in a thinly-traded stock which, if the trade went against them, would take many days and hundreds of dollars of upside to get out of. And on the other side, retail online brokerage customers plunging from situation to situation looking to generate short-term profit opportunities by driving up illiquid or overlooked issues: in margin accounts, with between little and no understanding either of the risks they faced. Or, worse yet, of the actions that brokerage firms, clearing firms, or intermarket dealers can take to mitigate their own risk.
Both groups – the hedge funders and the small-time hobbyists are, of course, well within their rights to explore profit opportunities with constraints (for the short-selling hedge fund, parameters set by its operating agreement, investors, and backers; for the retail online traders, the risk parameters set by the brokerage and its execution partners). And this goes beyond GME, AMC, Dogecoin, SLV, and other recent campaigns.
Risk tolerance over time
In fact, risk tolerances are up across the board. There are anecdotes, of course, but the evidence is clear in trends of some of the most historically risky markets. The stock market, once a fairly mid-range option for risk and return, has gone from a complement to a substitute for the role that bank accounts or Treasury bonds once filled.
Historically, a number of investments have resided at the riskier end of the asset spectrum, and in recent years have been growing in ownership and popularity. Without touching on options and futures (which are not really “investments”), and other, more exotic financial products (such as DPPs), they include the following.
Microcap stocks
Investors have clearly become more interested in the riskiest segment of the equities markets. A look at the Russell Microcap Index shows this. In the roughly five years between 1 January 2015 and the market crash on 16 March 2020, the total return on two major microcap stock indices (OTCQB and Russell Microcap Index) versus the S&P 500, Dow Jones Industrial Average, and Nasdaq Composite were as follows; note the comparative total returns and annual equivalent rates:
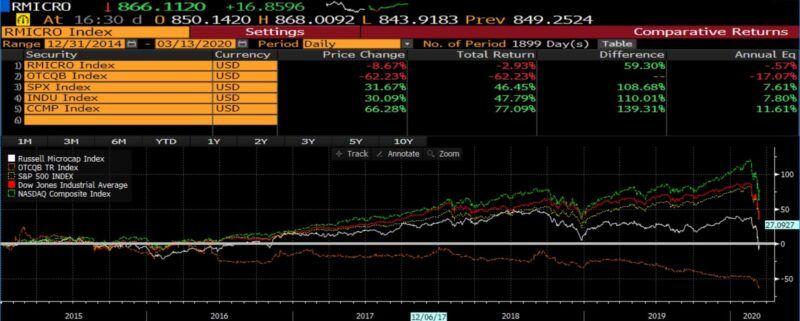
(Source: Bloomberg Finance, LP)
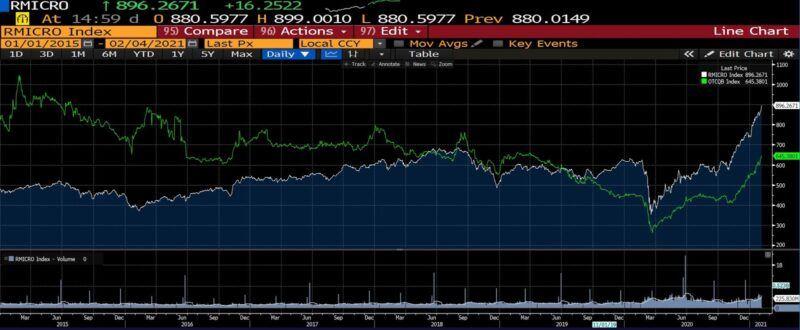
And yet, since the March 2020 crash, comparative returns have shifted markedly; again note the change in total returns and annual equivalent rates:

(Source: Bloomberg Finance, LP)
In the five years wherein the Fed began to slowly raise rate targets, large cap stocks did fairly well while microcaps largely fell. And since the Fed tanked rates back down in the early portion of the pandemic, the smallest and most speculative segment of equities has returned double what large, established publicly-traded companies have.
(Source: Bloomberg Finance, LP)
As shown: in the wake of the tremendously expansionary turn in monetary policy in March 2020, microcap stocks rocketed upward in price.
Leveraged, inverse, and thematic ETFs
The number of ETFs (exchange-traded funds) has grown from less than 400 in 2006 to just under 7,000 at present. Many are illiquid and only suitable for long-term investment. The increasing risk appetite among investors and traders has been met by the addition of several particularly risky types of ETFs: leveraged (which offer a multiple of returns over a set time period by employing derivatives), inverse (which return the opposite of what a given sector or market does), and thematic (where the assets in the fund are tied to a particular investment idea or trend). Thematic ETFs, despite receiving one of every three dollars directed into U.S. equity ETFs in January 2021, have actually lost as much as 5% per year for the past two decades on a risk-adjusted basis. Nevertheless, they now account for $142 billion in assets. A large amount of the inflow of assets of late has been into funds focusing on environmental, social, and corporate governance investments (ESG).
IPOs and the SPAC craze
Many financial analysts have likened the recent spike in initial public offerings (IPOs) to the 1999 boom which, then as now, points directly at investors’ desire to capture new issues with the largest short-term growth potential. A handful of companies which have gone public in the conventional way––via syndication and underwriting departments at investment banks––have seen initial price surges bringing to mind the loftiest heights of the dot-com era. On the first day of trading, for example, Airbnb jumped 112% above its offering price, DoorDash 86% (despite some analyst disparagement), and Pop Mart International 79%.
A look at the Renaissance IPO index starting in 2010 highlights the speculative fervor, particularly since the March 2020 stock market crash and the series of Fed liquidity infusions:
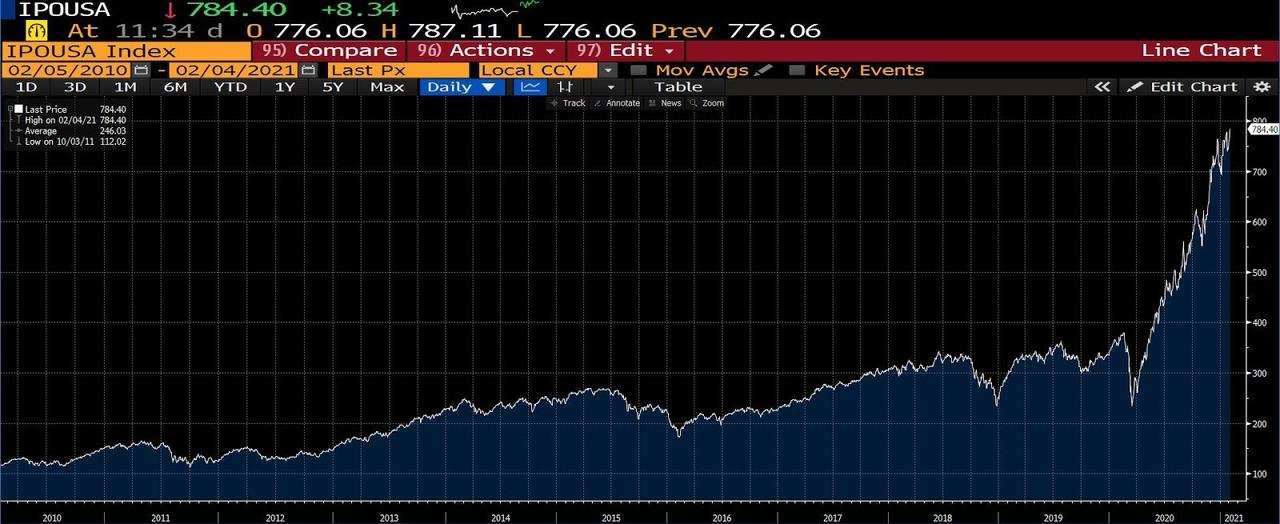
(Source: Bloomberg Finance, LP)
The number of IPOs in 2020––over 400, compared to 195 in 2019, 214 in 2018, and 176 in 2017––exhibits a two-way causality with risk appetites. As markets rise, buoyed by asset price inflation and investors jumping atop the bandwagon, companies undertake IPOs to catch the gains associated with higher valuations. And as companies undertake IPOs, investors seek them out for their appreciation potential. But setting aside that the immediate post-issuance price jumps are a clear indication of investor hunger for the outsized returns that new issues often bring, they’re also a tremendous misfire for the stock-issuing company. The price exploding upward on the day of the IPO suggests a profound underpricing of the issue, leaving many millions of dollars “on the table.”
Related to this is the Special Purpose Acquisition Company (SPAC) craze. Once an obscure method of financing firms, there has been an explosion of SPAC offerings. In 2019, SPACs raised roughly $19 billion. They raised over $76 billion in 2020, and over $15 billion in the first few weeks of 2021.
Although there are solid reasons as to why a firm might eschew the standard IPO process (working through an investment bank) or why investors might finance a firm directly, SPACs fundamentally represent a new degree of risk seeking. They are essentially “blank check” companies, shells into which both retail and institutional investors can participate in transactions which replicate the functions of private equity. Some, to be sure, are managed by financial institutions and involve professional business managers. But the meteoric rise in SPAC popularity is reminiscent of the “blind pools”––investments where managers are given extraordinary discretion––of other hyper-speculative eras. In any event, that uptick represents money thrown into financial markets in search of an idea.
No doubt many firms will have successful SPAC lives, characterized by commercial innovation and, over time, enriched investors. Others will assuredly fail. A look at the IPOX SPAC Index shows an ebullient trend indeed…but was established in August 2020, only six months ago.
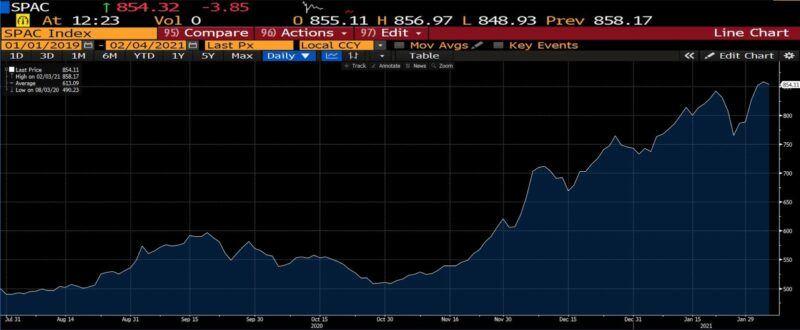
(Source: Bloomberg Finance, LP)
None of this rapidly burgeoning craving for risk would surprise the Federal Open Market Committee. One year ago, with the rate target at 1.50% to 1.75%, CNBC reported that in the minutes of their December 11th 2020 meeting,
[a] few participants raised the concern that keeping interest rates low over a long period might encourage excessive risk-taking, which could exacerbate imbalances in the financial sector…[and that low rates] could make the next recession more severe than [it might] otherwise [be.]
Nevertheless, only four of the 17 voting members indicated support for a rate hike during 2020. As we now know, rates would be back in ZIRP territory within three months, and the brief attempt to restore historical normalcy in rates, the assessment of risk and return, and innumerable other financial considerations were knocked back to the proverbial square one:

(Source: Bloomberg Finance, LP)
The breakneck pace of return-chasing is even less surprising in light of recent trends of what were, for decades, traditional avenues for risk-averse savers and investors. Virtually all of the historically-reliable investment options have experienced collapsing returns amid sequential bouts of monetary easing programs, forcing investors into inevitably riskier financial vehicles. A few, with a look at their recent performance, follow.
Certificates of Deposit
A certificate of deposit (CD) is a traditional bank or credit union offering which is essentially a defined lump-sum deposit. If left untouched for a discrete period of time, it pays a premium over the savings and checking account rate of interest. Of course, actions of the Federal Reserve (and specifically the decisions of the Federal Open Market Committee) bear directly upon the financial products and terms offered by financial institutions. Below is the trend in six-month CD yields since 1990.

(Source: Bloomberg Finance, LP)
10-year U.S. Treasury bonds
For most of the 20th century, U.S. Treasury bonds were the standard––indeed, the default used in financial models––of risk-free instruments. Liquid and with guaranteed principal and interest, laddered (meaning structured across maturities and payment dates) U.S. government obligations were a standard portfolio for reliable income and moderate return with low volatility. But campaign after campaign of dovish monetary policy initiatives have pushed Treasury yields down to once-inconceivable lows. Here is the 30-year trend in 10-year Treasury yields.
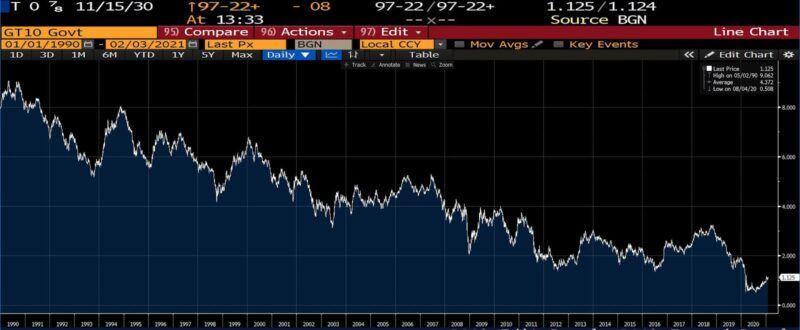
(Source: Bloomberg Finance, LP)
Traditionally the 10-year Treasury yield has been higher than the S&P 500 dividend yield. Note, in the bottom section of the graph, the long periods of red (periods of time where the 10-year Treasury paid higher interest than the dividend yield on the S&P 500 index) with very short periods of green where the S&P 500 dividend yield briefly rose above the 10-year Treasury yield (for example, during financial crises, such as in 2008, or periods of changing policy). It happened very infrequently, and rarely by an appreciable amount (1.00% or less).
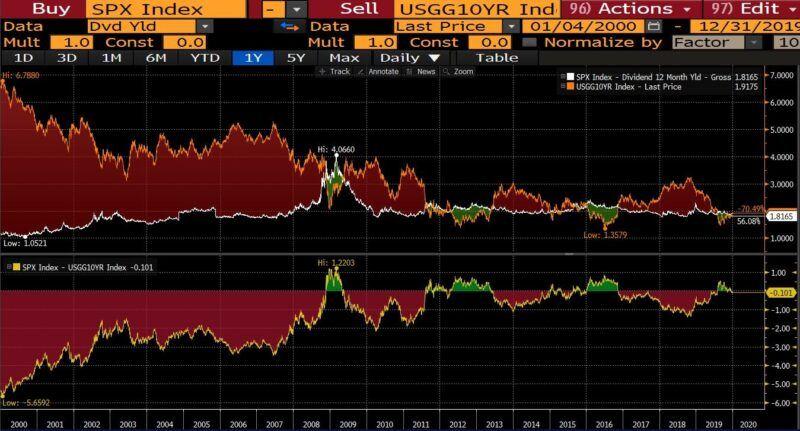
(Source: Bloomberg Finance, LP)
Yet since March 2020, the spread has flipped to historically anomalous levels (all “green,” indicating the S&P 500 dividend yield was vastly higher than the 10-year Treasury yield):
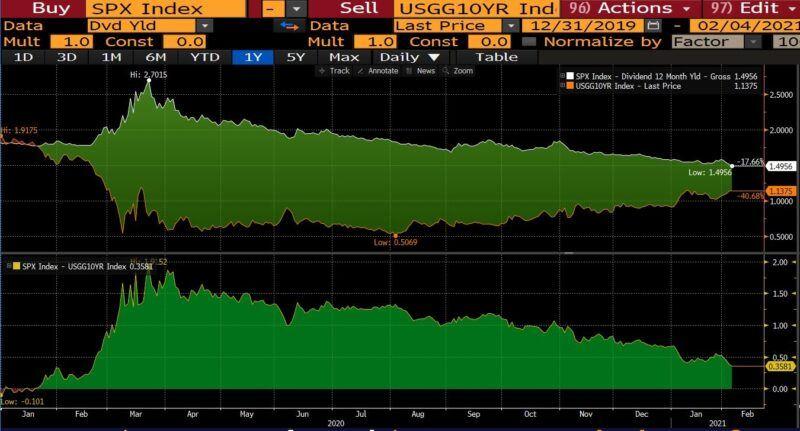
(Source: Bloomberg Finance, LP)
The very idea that in July 2020 the dividend yield on a total stock market index fund (roughly 1.80%) was nearly three times the yield on a 10-year US Treasury note (then 0.66%) and almost half of one percent higher than a 30-year U.S. Treasury bond (then 1.40%) shows, clearly, the effect of the tidal wave of the easiest money in history. It also, looking at the progression of both of the spread charts, starkly displays how investors who could once transition from higher-risk investments (stocks) into principal-protected, income-oriented lower risk investments (government bonds) now face a dire financial choice: assume more risk, or persist amid lower, arguably negligible, inflation-consumed returns.
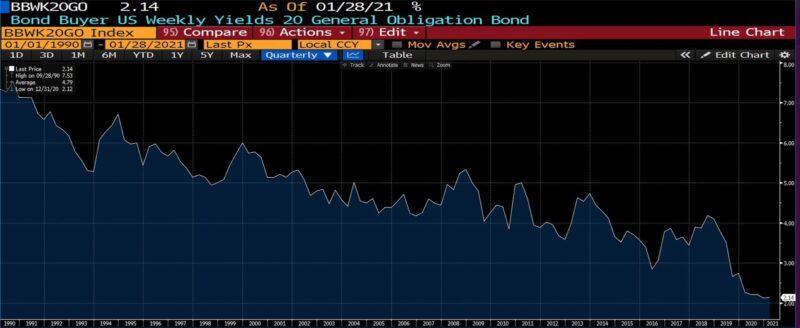
Municipal bonds
Highly-rated municipal bonds were long favored by investors owing to their yields (they often pay several hundred basis points or more above U.S. Treasuries of comparable maturity) and their exemption from certain taxes. But they, too, have seen their yields collapse over the last few decades. Here is the Bond Buyer 20-Bond General Obligation index since 1990; it tracks the weekly average yields of municipal obligations with 2-year maturities having S&P ratings of AA and above.
These are some of the safest of the munis, and like the other typical safe havens for risk-averse investors, the frequent undertaking of expansionary monetary policy has pushed yields on these bonds toward zero.
(Source: Bloomberg Finance, LP)
Conclusion
The recent drama financial markets have seen, whether it concerns GameStop, Dogecoin, or another object of the r/wallstreetbets community’s affection, turned heads and raised eyebrows. A narrative quickly emerged, one in which the goliaths of Wall Street were toppled by the scrappy Main Street retail traders and their small-but-determined financial slingshots. Though romantic, these last few weeks are in reality far more indicative of Americans’ ballooning tolerance for financial risk. Faced with the possibility of significant returns––perhaps of too-good-to-be-true proportions––both short sellers and short interest hunters surrendered their inhibitions and took questionable gambles.
And though this situation is simpler than the grandiose Main Street vs. Wall Street framing, it is simultaneously more complex than the notion that amateur traders were simply looking to make a quick and easy buck––or that a handful of hedge funds took a tremendously risky bet ensconced only in hubris. What is regularly dismissed as greed may be more appropriately framed as desperation, in many cases. Where investing in the stock market was once a companion to engaging with less-risky bank accounts or Treasury bonds, today’s investors have by necessity become more willing to play their hand in more precarious quarters. Risk appetites broadly have been driven up artificially. The r/wallstreetbets chaos is far from an anomaly in terms of current investment preferences––it’s a symptom.
The Federal Reserve has done more in the past 25 years than its founding legislators and early governors surely ever conceived it would. With that in mind, one wonders what the end game is, especially in light of two facts.
-
First, that the inclination of monetary authorities the world over is toward lower and lower thresholds for intervention.
-
And second, that fiscal and monetary policies have a way of suddenly finding limits when the tax-paying everyman is on the receiving end.
If there is a component of the growing disposition for risk inspired by the idea that the Fed will swoop in to save retail investors from failed ETFs, collapsed SPAC prices, a wave of microcap stock delistings, or any other consequence of their understandable but reluctant march up the risk curve, it is ill-advised. Any lasting solution is far more likely to come from markets themselves.
International
There will soon be one million seats on this popular Amtrak route
“More people are taking the train than ever before,” says Amtrak’s Executive Vice President.
Share this:


While the size of the United States makes it hard for it to compete with the inter-city train access available in places like Japan and many European countries, Amtrak trains are a very popular transportation option in certain pockets of the country — so much so that the country’s national railway company is expanding its Northeast Corridor by more than one million seats.
Related: This is what it's like to take a 19-hour train from New York to Chicago
Running from Boston all the way south to Washington, D.C., the route is one of the most popular as it passes through the most densely populated part of the country and serves as a commuter train for those who need to go between East Coast cities such as New York and Philadelphia for business.
Veronika Bondarenko
Amtrak launches new routes, promises travelers ‘additional travel options’
Earlier this month, Amtrak announced that it was adding four additional Northeastern routes to its schedule — two more routes between New York’s Penn Station and Union Station in Washington, D.C. on the weekend, a new early-morning weekday route between New York and Philadelphia’s William H. Gray III 30th Street Station and a weekend route between Philadelphia and Boston’s South Station.
More Travel:
- A new travel term is taking over the internet (and reaching airlines and hotels)
- The 10 best airline stocks to buy now
- Airlines see a new kind of traveler at the front of the plane
According to Amtrak, these additions will increase Northeast Corridor’s service by 20% on the weekdays and 10% on the weekends for a total of one million additional seats when counted by how many will ride the corridor over the year.
“More people are taking the train than ever before and we’re proud to offer our customers additional travel options when they ride with us on the Northeast Regional,” Amtrak Executive Vice President and Chief Commercial Officer Eliot Hamlisch said in a statement on the new routes. “The Northeast Regional gets you where you want to go comfortably, conveniently and sustainably as you breeze past traffic on I-95 for a more enjoyable travel experience.”
Here are some of the other Amtrak changes you can expect to see
Amtrak also said that, in the 2023 financial year, the Northeast Corridor had nearly 9.2 million riders — 8% more than it had pre-pandemic and a 29% increase from 2022. The higher demand, particularly during both off-peak hours and the time when many business travelers use to get to work, is pushing Amtrak to invest into this corridor in particular.
To reach more customers, Amtrak has also made several changes to both its routes and pricing system. In the fall of 2023, it introduced a type of new “Night Owl Fare” — if traveling during very late or very early hours, one can go between cities like New York and Philadelphia or Philadelphia and Washington. D.C. for $5 to $15.
As travel on the same routes during peak hours can reach as much as $300, this was a deliberate move to reach those who have the flexibility of time and might have otherwise preferred more affordable methods of transportation such as the bus. After seeing strong uptake, Amtrak added this type of fare to more Boston routes.
The largest distances, such as the ones between Boston and New York or New York and Washington, are available at the lowest rate for $20.
stocks pandemic japan europeanInternational
The next pandemic? It’s already here for Earth’s wildlife
Bird flu is decimating species already threatened by climate change and habitat loss.
Share this:


I am a conservation biologist who studies emerging infectious diseases. When people ask me what I think the next pandemic will be I often say that we are in the midst of one – it’s just afflicting a great many species more than ours.
I am referring to the highly pathogenic strain of avian influenza H5N1 (HPAI H5N1), otherwise known as bird flu, which has killed millions of birds and unknown numbers of mammals, particularly during the past three years.
This is the strain that emerged in domestic geese in China in 1997 and quickly jumped to humans in south-east Asia with a mortality rate of around 40-50%. My research group encountered the virus when it killed a mammal, an endangered Owston’s palm civet, in a captive breeding programme in Cuc Phuong National Park Vietnam in 2005.
How these animals caught bird flu was never confirmed. Their diet is mainly earthworms, so they had not been infected by eating diseased poultry like many captive tigers in the region.
This discovery prompted us to collate all confirmed reports of fatal infection with bird flu to assess just how broad a threat to wildlife this virus might pose.
This is how a newly discovered virus in Chinese poultry came to threaten so much of the world’s biodiversity.
The first signs
Until December 2005, most confirmed infections had been found in a few zoos and rescue centres in Thailand and Cambodia. Our analysis in 2006 showed that nearly half (48%) of all the different groups of birds (known to taxonomists as “orders”) contained a species in which a fatal infection of bird flu had been reported. These 13 orders comprised 84% of all bird species.
We reasoned 20 years ago that the strains of H5N1 circulating were probably highly pathogenic to all bird orders. We also showed that the list of confirmed infected species included those that were globally threatened and that important habitats, such as Vietnam’s Mekong delta, lay close to reported poultry outbreaks.
Mammals known to be susceptible to bird flu during the early 2000s included primates, rodents, pigs and rabbits. Large carnivores such as Bengal tigers and clouded leopards were reported to have been killed, as well as domestic cats.
Our 2006 paper showed the ease with which this virus crossed species barriers and suggested it might one day produce a pandemic-scale threat to global biodiversity.
Unfortunately, our warnings were correct.
A roving sickness
Two decades on, bird flu is killing species from the high Arctic to mainland Antarctica.
In the past couple of years, bird flu has spread rapidly across Europe and infiltrated North and South America, killing millions of poultry and a variety of bird and mammal species. A recent paper found that 26 countries have reported at least 48 mammal species that have died from the virus since 2020, when the latest increase in reported infections started.
Not even the ocean is safe. Since 2020, 13 species of aquatic mammal have succumbed, including American sea lions, porpoises and dolphins, often dying in their thousands in South America. A wide range of scavenging and predatory mammals that live on land are now also confirmed to be susceptible, including mountain lions, lynx, brown, black and polar bears.
The UK alone has lost over 75% of its great skuas and seen a 25% decline in northern gannets. Recent declines in sandwich terns (35%) and common terns (42%) were also largely driven by the virus.
Scientists haven’t managed to completely sequence the virus in all affected species. Research and continuous surveillance could tell us how adaptable it ultimately becomes, and whether it can jump to even more species. We know it can already infect humans – one or more genetic mutations may make it more infectious.
At the crossroads
Between January 1 2003 and December 21 2023, 882 cases of human infection with the H5N1 virus were reported from 23 countries, of which 461 (52%) were fatal.
Of these fatal cases, more than half were in Vietnam, China, Cambodia and Laos. Poultry-to-human infections were first recorded in Cambodia in December 2003. Intermittent cases were reported until 2014, followed by a gap until 2023, yielding 41 deaths from 64 cases. The subtype of H5N1 virus responsible has been detected in poultry in Cambodia since 2014. In the early 2000s, the H5N1 virus circulating had a high human mortality rate, so it is worrying that we are now starting to see people dying after contact with poultry again.
It’s not just H5 subtypes of bird flu that concern humans. The H10N1 virus was originally isolated from wild birds in South Korea, but has also been reported in samples from China and Mongolia.
Recent research found that these particular virus subtypes may be able to jump to humans after they were found to be pathogenic in laboratory mice and ferrets. The first person who was confirmed to be infected with H10N5 died in China on January 27 2024, but this patient was also suffering from seasonal flu (H3N2). They had been exposed to live poultry which also tested positive for H10N5.
Species already threatened with extinction are among those which have died due to bird flu in the past three years. The first deaths from the virus in mainland Antarctica have just been confirmed in skuas, highlighting a looming threat to penguin colonies whose eggs and chicks skuas prey on. Humboldt penguins have already been killed by the virus in Chile.

How can we stem this tsunami of H5N1 and other avian influenzas? Completely overhaul poultry production on a global scale. Make farms self-sufficient in rearing eggs and chicks instead of exporting them internationally. The trend towards megafarms containing over a million birds must be stopped in its tracks.
To prevent the worst outcomes for this virus, we must revisit its primary source: the incubator of intensive poultry farms.
Diana Bell does not work for, consult, own shares in or receive funding from any company or organisation that would benefit from this article, and has disclosed no relevant affiliations beyond their academic appointment.
genetic pandemic mortality spread deaths south korea south america europe uk chinaUncategorized
NY Fed Finds Medium, Long-Term Inflation Expectations Jump Amid Surge In Stock Market Optimism
NY Fed Finds Medium, Long-Term Inflation Expectations Jump Amid Surge In Stock Market Optimism
One month after the inflation outlook tracked…
Share this:


One month after the inflation outlook tracked by the NY Fed Consumer Survey extended their late 2023 slide, with 3Y inflation expectations in January sliding to a record low 2.4% (from 2.6% in December), even as 1 and 5Y inflation forecasts remained flat, moments ago the NY Fed reported that in February there was a sharp rebound in longer-term inflation expectations, rising to 2.7% from 2.4% at the three-year ahead horizon, and jumping to 2.9% from 2.5% at the five-year ahead horizon, while the 1Y inflation outlook was flat for the 3rd month in a row, stuck at 3.0%.
The increases in both the three-year ahead and five-year ahead measures were most pronounced for respondents with at most high school degrees (in other words, the "really smart folks" are expecting deflation soon). The survey’s measure of disagreement across respondents (the difference between the 75th and 25th percentile of inflation expectations) decreased at all horizons, while the median inflation uncertainty—or the uncertainty expressed regarding future inflation outcomes—declined at the one- and three-year ahead horizons and remained unchanged at the five-year ahead horizon.
Going down the survey, we find that the median year-ahead expected price changes increased by 0.1 percentage point to 4.3% for gas; decreased by 1.8 percentage points to 6.8% for the cost of medical care (its lowest reading since September 2020); decreased by 0.1 percentage point to 5.8% for the cost of a college education; and surprisingly decreased by 0.3 percentage point for rent to 6.1% (its lowest reading since December 2020), and remained flat for food at 4.9%.

We find the rent expectations surprising because it is happening just asking rents are rising across the country.

At the same time as consumers erroneously saw sharply lower rents, median home price growth expectations remained unchanged for the fifth consecutive month at 3.0%.
Turning to the labor market, the survey found that the average perceived likelihood of voluntary and involuntary job separations increased, while the perceived likelihood of finding a job (in the event of a job loss) declined. "The mean probability of leaving one’s job voluntarily in the next 12 months also increased, by 1.8 percentage points to 19.5%."

Mean unemployment expectations - or the mean probability that the U.S. unemployment rate will be higher one year from now - decreased by 1.1 percentage points to 36.1%, the lowest reading since February 2022. Additionally, the median one-year-ahead expected earnings growth was unchanged at 2.8%, remaining slightly below its 12-month trailing average of 2.9%.
Turning to household finance, we find the following:
- The median expected growth in household income remained unchanged at 3.1%. The series has been moving within a narrow range of 2.9% to 3.3% since January 2023, and remains above the February 2020 pre-pandemic level of 2.7%.
- Median household spending growth expectations increased by 0.2 percentage point to 5.2%. The increase was driven by respondents with a high school degree or less.
- Median year-ahead expected growth in government debt increased to 9.3% from 8.9%.
- The mean perceived probability that the average interest rate on saving accounts will be higher in 12 months increased by 0.6 percentage point to 26.1%, remaining below its 12-month trailing average of 30%.
- Perceptions about households’ current financial situations deteriorated somewhat with fewer respondents reporting being better off than a year ago. Year-ahead expectations also deteriorated marginally with a smaller share of respondents expecting to be better off and a slightly larger share of respondents expecting to be worse off a year from now.
- The mean perceived probability that U.S. stock prices will be higher 12 months from now increased by 1.4 percentage point to 38.9%.
- At the same time, perceptions and expectations about credit access turned less optimistic: "Perceptions of credit access compared to a year ago deteriorated with a larger share of respondents reporting tighter conditions and a smaller share reporting looser conditions compared to a year ago."

Also, a smaller percentage of consumers, 11.45% vs 12.14% in prior month, expect to not be able to make minimum debt payment over the next three months

Last, and perhaps most humorous, is the now traditional cognitive dissonance one observes with these polls, because at a time when long-term inflation expectations jumped, which clearly suggests that financial conditions will need to be tightened, the number of respondents expecting higher stock prices one year from today jumped to the highest since November 2021... which incidentally is just when the market topped out during the last cycle before suffering a painful bear market.


Veterans Affairs Kept COVID-19 Vaccine Mandate In Place Without Evidence


The Coming Of The Police State In America


‘I couldn’t stand the pain’: the Turkish holiday resort that’s become an emergency dental centre for Britons who can’t get treated at home


Beloved mall retailer files Chapter 7 bankruptcy, will liquidate


Is the National Guard a solution to school violence?


Rand Paul Teases Senate GOP Leader Run – Musk Says “I Would Support”


The next pandemic? It’s already here for Earth’s wildlife


Vaccine-skeptical mothers say bad health care experiences made them distrust the medical system


Are Voters Recoiling Against Disorder?


The Great Replacement Loophole: Illegal Immigrants Score 5-Year Work Benefit While “Waiting” For Deporation, Asylum
-

 Uncategorized3 weeks ago
All Of The Elements Are In Place For An Economic Crisis Of Staggering Proportions
-

 Uncategorized1 month ago
Cathie Wood sells a major tech stock (again)
-

 Uncategorized3 weeks ago
California Counties Could Be Forced To Pay $300 Million To Cover COVID-Era Program
-

 Uncategorized2 weeks ago
Apparel Retailer Express Moving Toward Bankruptcy
-

 Uncategorized4 weeks ago
Industrial Production Decreased 0.1% in January
-

 International3 days ago
EyePoint poaches medical chief from Apellis; Sandoz CFO, longtime BioNTech exec to retire
-

 International3 days ago
Walmart launches clever answer to Target’s new membership program
-

 Uncategorized3 weeks ago
RFK Jr: The Wuhan Cover-Up & The Rise Of The Biowarfare-Industrial Complex