Minus 43.8% To S&P 500 Fair Value
On My Radar: Minus 43.8% Correction To Fair Value by Stephen Blumenthal “Rule #3: There are no new eras – excesses are never permanent.” – Bob Farrell, Former Chief Stock Market Analyst and Sr. Investment Advisor, Merrill Lynch – Bob Farrell’s…
Share this:


On My Radar: Minus 43.8% Correction To Fair Value by Stephen Blumenthal
“Rule #3: There are no new eras – excesses are never permanent.” – Bob Farrell, Former Chief Stock Market Analyst and Sr. Investment Advisor, Merrill Lynch – Bob Farrell’s 10 Rules for Investing
Get The Full Ray Dalio Series in PDF
Get the entire 10-part series on Ray Dalio in PDF. Save it to your desktop, read it on your tablet, or email to your colleagues

Q3 2020 hedge fund letters, conferences and more
Today, I share my favorite stock market valuation chart with you. It bluntly suggests that a 43.8% correction is required to get us back to what is considered “fair value.” Will it happen? Don’t know.
A 26.3% correction gets us back to what is considered “overvalued.” The S&P 500 Index was at 3,621.63 on November 30, 2020. Minus 26.3% puts the market at 2,669.14. Consider that a higher probability. A shock that would send the Fed to the rescue.
What is clear is that we sit at one of the most overvalued levels in history. I find valuation data useful in terms of asset allocation (targets for opportunity) and by process, I like to review various valuation metrics each month. Before we take a look at what they’re telling us, recall that debt is a drag on growth and thus a drag on future earnings. “There are no new eras.” I wrote last week about William White (check it out here). Bill was the chief economist at the Bank for International Settlements. Think of the BIS as the central banks’ central banker. “The elephant in the room is debt,” he said. Bill sees four possible scenarios:
- Households, corporations, and governments try to save more to repay their debt. But we know that this gets you into the Keynesian Paradox of Thrift, where the economy collapses. This way leads to disaster.
- You can try to grow your way out of a debt overhang through stronger real economic growth. But we know that a debt overhang impedes real economic growth. Of course, we should try to increase potential growth through structural reforms, but this is unlikely to be the silver bullet that saves us.
- This leaves the two remaining ways: Higher nominal growth – i.e., higher inflation – or
- Get rid of the bad debt by restructuring and writing it off.
Bill advises a combination of three and four, adding, “Approach the problem, try to identify the bad debts, and restructure them in as orderly a fashion that you can.”
On the surface, that “restructure” and “orderly” sound easy to do. But restructuring the mortgage debt mess in 2009 was not so orderly. We now call it “The Great Financial Crisis.” Expect the same sort of impact to hit the corporations who have binged on debt and the investors who own that debt. “Excesses are never permanent.”
You’re not going to be happy if your bond fund drops 40%—an all-too-real risk.
Creditable academic research suggests debt affects growth when it crosses 90% debt-to-GDP. Note the right-hand column in the following chart and factor the information into your deflationary calculator. This is the elephant in the room! (Data through June 30, 2020.):

Source: Ned Davis Research
Getting rid of the bad debt by restructuring and writing it off means that in our immediate future, deflation persists. Excess global production capacity and aging demographics also mean deflationary pressures persist. But do keep one eye on future policy response. If we get what I think is coming, in the U.S. and globally, inflation will become front-page news. That will create an entirely different investment regime. My best guess is that it will happen two years from now.
November was an exceptionally great month for U.S. equities. The year was not looking so good. According to data from Morningstar, going into November, the Invesco S&P 500 equal-weight ETF (ticker symbol “RSP”) was down 3.58% for the year. On November 30th, the year-to-date gain was 10.17%. Tack on another 2.56% in December and all is well with just a few weeks to go before we put 2020 behind us. I believe the equal-weight index is a good proxy for most large-cap equity funds, “the market” as they say.
I hope you will indulge me for a brief, exciting commercial message. My first book, On My Radar: Navigating Stock Market Cycles, is now available for Kindle on Amazon. The hardcover is also available for pre-order (and price guarantee) and will be released in January. The book is about investment process and how to navigate the massive debt restructuring we face ahead of us. I share a road map of sorts, important charts, and how to think about when to play defense and when to seize on the opportunities that will present. The book concludes with a discussion about how wealthy investors think about defending their CORE wealth and how carefully selected, asymmetric return opportunities, which I call “EXPLORE type investment opportunities,” may accelerate wealth. Ultimately, I hope you gain some beneficial insights into how to put in place an investment game plan that is best for you and your family.
Grab that coffee and find your favorite chair. This week I share with you my favorite valuation chart, which helps me set some opportunity targets. We’ll look at the latest market valuation data including Warren Buffett’s reported favorite valuation indicator. I hope you find the information helpful. You’ll also see that the weight-of-trend evidence continues to lean bullish (see this week’s Trade Signals below). Be ever mindful that the whispers of 1999 are growing louder.
If a friend forwarded this email to you and you’d like to be on the weekly list, you can sign up to receive my free On My Radar letter here.
Follow me on Twitter @SBlumenthalCMG
Included in this week’s On My Radar:
- Median P/E – Minus 43.8% to Fair Value
- Trade Signals – Markets Await Additional COVID-19 Stimulus, Vaccine Deployment
- Personal Note – 60 and Sunny
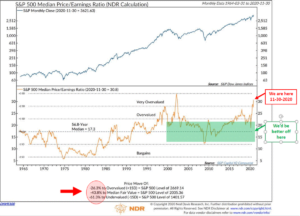
Median P/E - Minus 43.8% to Fair Value
As we look at median price-to-earnings ratios, remember Bob Farrell’s investment rule #3: There are no new eras - excesses are never permanent.
Here is how to read the following chart:
- Note the red “we are here” arrow. We sit in the “very overvalued” zone.
- Note the green highlighted area and the “we’d be better off here” arrow.
- The dotted line shows the 56.8-year median P/E = 17.3. The latest reading is 30.8. That’s higher than the secular bull market peaks in 2000 and 1966.
- Lastly, take a look at the red circle toward the lower left. I think this is a pretty good way to set some targets as to where you may want to get more aggressive with your equity exposure. Target one: 2,669.14 (though still overvalued, that is likely where the Fed steps back in should the market correct that much. Likely sooner in my view but just a guess). Target two: fair value at 2,035.36.

Source: Ned Davis Research
Stock Market Capitalization as a Percent of Gross Domestic Income
I like this next chart, as I feel it is informative in terms of coming returns.
Here’s how to read the chart:
- I’ve noted the prior secular bull market peaks: 1929, 1966, 2000, 2008, and 2020.
- 2020’s jury remains out as the market is currently at an all-time high.
- Note the red “we are here” arrow. This shows the value of the stock market as a percent of GDI. The lower section plots the amount over and under the blue dotted long-term trendline that appears in the middle section of the chart.
- The data box is in the upper left. It shows the 1, 3, 5, 7, 9, and 11-year subsequent returns achieved when the market was in the top quintile—overvalued zone (red highlight in the data box) and when the market was in the bottom quintile—undervalued zone (green highlight in the data box).
We sit in the red zone. Expect negative annualized returns over the coming 11 years.

Source: Ned Davis Research
Stock Market Capitalization-to-GDP - The Buffett Indicator
From Advisor Perspectives: “Market Cap to GDP is a long-term valuation indicator that has become popular in recent years, thanks to Warren Buffett. Back in 2001, he remarked in a Fortune Magazine interview that ‘it is probably the best single measure of where valuations stand at any given moment.’”
Compared to the previous two secular bull market peaks and all of the data from 1950 to present, stock market cap (the total value of the U.S. stock market) to GDP (gross domestic product—what we collectively produce as a country) has never been higher.

Source: Advisor Perspectives
Keep one last great Bob Farrell rule in mind — Rule #4: Exponential rapidly rising or falling markets usually go further than you think, but they do not correct by going sideways.
My two cents: Don’t expect sideways… there has rarely been a better time to hedge.
One last thought: There are opportunities in disruptive technologies, such as biotech, etc. There is so much to be optimistic about. It’s just not in cap-weighted passive index funds or low yielding bonds.
Trade Signals - Markets Await Additional COVID-19 Stimulus, Vaccine Deployment
December 9, 2020
S&P 500 Index — 3,705 (open)
Notable this week:
This week, there are a couple changes to the trade signals we monitor. The Don’t Fight the Tape or the Fed indicator moved to a “0” reading, improving from a “-1” reading. This updated reading is a bullish signal for equities. The investor sentiment indicators, calculated by Ned Davis Research (NDR), continue to rise, demonstrating excessive optimism, which is short-term bearish for equities. No changes to the fixed income indicators this week.
For your reading pleasure, Deloitte published its quarterly CFO Signals™ this morning. According to Deloitte’s survey of Fortune 500 executives, 80% of CFOs say equities are overvalued, but nearly 60% expect the S&P 500 to be higher at the end of 2021. In short, CFOs are concerned about economic growth prospects for the first half of 2021 and are optimistic for prospects in the second half.

Source: Deloitte CFO Signals: Q4 2020
Not a recommendation for you to buy or sell any security. For information purposes only. Please talk with your advisor about needs, goals, time horizon and risk tolerances.
Click here for this week’s Trade Signals.
Personal Note - 60 and Sunny
"True hopefulness and optimism is what leads one to dare. It is also what lifts one back up to dare again after a failed attempt." - Brian May, Musician
COVID-19 is raging, and states are shutting things down. A very dear friend and his wife just closed their yoga business. It was doing very well… until. There are thousands of stories like theirs. Indeed, this is a very hard time. With love, I told my friend, “Get back up and dare.”
I imagine you are hearing more and more stories about friends who have or recently have had COVID. One of the girls on the soccer team that my wife, Susan, coaches recently recovered from COVID, but lost her grandfather to the disease. Another lost a father and grandfather.
Last night, Susan got a text from the mother of yet another player—both have the virus. The season is on hold. Much of the country is on hold. Many argue it’s no worse than the flu. I see stats that it’s 3x worse but that is not comforting if it’s a loved one. This is all too real and very close to home. Unfortunately, our legislators appear to be on hold as well. Support for many businesses and families is needed. I’m not sure $900 billion is enough. More on that in another post.
The good news is that vaccines are arriving in the near future. Stay strong! Stay well! Ever forward…
The weekend weather is looking promising… 60 and sunny. Golf is planned.
I hope you have something fun planned as well. And if you need to bonding time with the ones you love most, check out The Queen’s Gambit and Schitt’s Creek (it’s a happy pill) on Netflix.
Optimistic and happy! Wishing you a wonderful week!
Warm regards,
Stephen B. Blumenthal
Executive Chairman & CIO
CMG Capital Management Group, Inc.
The post Minus 43.8% To S&P 500 Fair Value appeared first on ValueWalk.
business fair value stock market correction stock market valuation stimulus economic growth bonds sp 500 equities fed etf vaccine gdpUncategorized
Profits over patients: For-profit nursing home chains are draining resources from care while shifting huge sums to owners’ pockets
Owners of midsize nursing home chains harm the elderly and drain huge sums of money from facilities using opaque accounting practices while government…
Share this:


The care at Landmark of Louisville Rehabilitation and Nursing was abysmal when state inspectors filed their survey report of the Kentucky facility on July 3, 2021.
Residents wandered the halls in a facility that can house up to 250 people, yelling at each other and stealing blankets. One resident beat a roommate with a stick, causing bruising and skin tears. Another was found in bed with a broken finger and a bloody forehead gash. That person was allowed to roam and enter the beds of other residents. In another case, there was sexual touching in the dayroom between residents, according to the report.
Meals were served from filthy meal carts on plastic foam trays, and residents struggled to cut their food with dull plastic cutlery. Broken tiles lined showers, and a mysterious black gunk marred the floors. The director of housekeeping reported that the dining room was unsanitary. Overall, there was a critical lack of training, staff and supervision.
The inspectors tagged Landmark as deficient in 29 areas, including six that put residents in immediate jeopardy of serious harm and three where actual harm was found. The issues were so severe that the government slapped Landmark with a fine of over US$319,000 − more than 29 times the average for a nursing home in 2021 − and suspended payments to the home from federal Medicaid and Medicare funds.
But problems persisted. Five months later, inspectors levied six additional deficiencies of immediate jeopardy − the highest level.
Landmark is just one of the 58 facilities run by parent company Infinity Healthcare Management across five states. The government issued penalties to the company almost 4½ times the national average, according to bimonthly data that the Centers for Medicare & Medicaid Services first started to make available in late 2022. All told, Infinity paid nearly $10 million in fines since 2021, the highest among nursing home chains with fewer than 100 facilities.
Infinity Healthcare Management and its executives did not respond to multiple requests for comment.
Race to the bottom
Such sanctions are nothing new for Infinity or other for-profit nursing home chains that have dominated an industry long known for cutting corners in pursuit of profits for private owners. But this race to the bottom to extract profits is accelerating, despite demands by government officials, health care experts and advocacy groups to protect the nation’s most vulnerable citizens.
To uncover the reasons why, The Conversation delved into the nursing home industry, where for-profit facilities make up more than 72% of the nation’s nearly 14,900 facilities. The probe, which paired an academic expert with an investigative reporter, used the most recent government data on ownership, facility information and penalties, combined with CMS data on affiliated entities for nursing homes.
The investigation revealed an industry that places a premium on cost cutting and big profits, with low staffing and poor quality, often to the detriment of patient well-being. Operating under weak and poorly enforced regulations with financially insignificant penalties, the for-profit sector fosters an environment where corners are frequently cut, compromising the quality of care and endangering patient health.
Meanwhile, owners make the facilities look less profitable by siphoning money from the homes through byzantine networks of interconnected corporations. Federal regulators have neglected the problem as each year likely billions of dollars are funneled out of nursing homes through related parties and into owners’ pockets.
More trouble at midsize
Analyzing newly released government data, our investigation found that these problems are most pronounced in nursing homes like Infinity − midsize chains that operate between 11 and 100 facilities. This subsection of the industry has higher average fines per home, lower overall quality ratings, and are more likely to be tagged with resident abuse compared with both the larger and smaller networks. Indeed, while such chains account for about 39% of all facilities, they operate 11 of the 15 most-fined facilities.
With few impediments, private investors who own the midsize chains have swooped in to purchase underperforming homes, expanding their holdings even as larger chains divest and close facilities.
“They are really bad, but the names − we don’t know these names,” said Toby Edelman, senior policy attorney with the Center for Medicare Advocacy, a nonprofit law organization.
In response to The Conversation’s findings on nursing homes and request for an interview, a CMS spokesperson emailed a statement that said the CMS is “unwavering in its commitment to improve safety and quality of care for the more than 1.2 million residents receiving care in Medicare- and Medicaid-certified nursing homes.”
“We support transparency and accountability,” the American Health Care Association/National Center for Assisted Living, a trade organization representing the nursing home industry, wrote in response to The Conversation‘s request for comment. “But neither ownership nor line items on a budget sheet prove whether a nursing home is committed to its residents.”
Ripe for abuse
It often takes years to improve a poor nursing home − or run one into the ground. The analysis of midsize chains shows that most owners have been associated with their current facilities for less than eight years, making it difficult to separate operators who have taken long-term investments in resident care from those who are looking to quickly extract money and resources before closing them down or moving on. These chains control roughly 41% of nursing home beds in the U.S., according to CMS’s provider data, making the lack of transparency especially ripe for abuse.
A churn of nursing home purchases even during the pandemic shows that investors view the sector as highly profitable, especially when staffing costs are kept low and fines for poor care can easily be covered by the money extracted from residents, their families and taxpayers.
A March 2024 study from Lehigh University and the University of California, Los Angeles also shows that costs were inflated when nursing home owners switched to contractors they controlled directly or indirectly. Overall, spending on real estate increased 20.4% and spending on management increased 24.6% when the businesses were affiliated, the research showed.
“This is the model of their care: They come in, they understaff and they make their money,” said Sam Brooks, director of public policy at the Consumer Voice, a national resident advocacy organization. “Then they multiply it over a series of different facilities.”
This is a condensed version of an article from The Conversation’s investigative unit. To find out more about the rise of for-profit nursing homes, financial trickery and what could make the nation’s most vulnerable citizens safer, read the complete version.
Campbell is an adjunct assistant professor at Columbia University and a contributing writer at the Garrison Project, an independent news organization that focuses on mass incarceration and criminal justice.
Harrington is an advisory board member of the nonprofit Veteran's Health Policy Institute and a board member of the nonprofit Center for Health Information and Policy. Harrington served as an expert witness on nursing home litigation cases by residents against facilities owned or operated by Brius and Shlomo Rechnitz in the past and in 2022. She also served as an expert witness in a case against The Citadel Salisbury in North Carolina in 2021.
real estate pandemicInternational
Key Events This Week: Central Banks Galore Including A Historic Rate Hike By The BOJ
Key Events This Week: Central Banks Galore Including A Historic Rate Hike By The BOJ
According to DB’s Jim Reid, "this could be a landmark…
Share this:

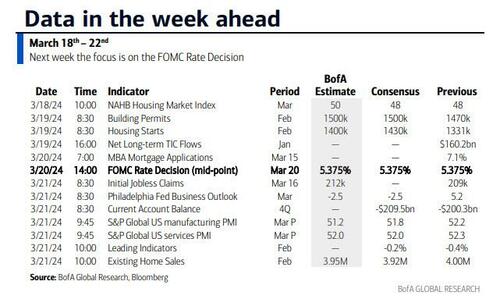
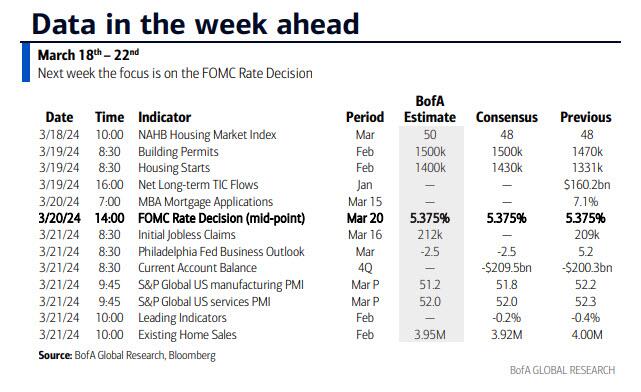
According to DB's Jim Reid, "this could be a landmark week in markets as the last global holdout on negative rates looks set to be removed as the BoJ likely hikes rates from -0.1% tomorrow." That will likely overshadow the FOMC that concludes on Wednesday that will have its own signalling intrigue given recent strong inflation. We also have the RBA meeting tomorrow and the SNB and BoE meetings on Thursday to close out a big week for global central bankers with many EM countries also deciding on policy. We’ll preview the main meetings in more depth below but outside of this we have the global flash PMIs on Thursday as well as inflation reports in Japan (Thursday) and the UK (Wednesday). US housing data also permeates through the week as you'll see in the full global day-by-day week ahead at the end as usual.
Let’s go into detail now, starting with the BoJ tomorrow. We’ve had negative base rates now for 8 years which if is the longest run ever seen for any country in the history of mankind. In fact it is doubtful that pre-historic man was as generous as to charge negative interest rates on lending money prior to this! It also might be one of the longest global runs without any interest rate hikes given the 17 year run that could end tomorrow. So, as Reid puts it, a landmark event.
DB's Chief Japan economist expects the central bank to revise its policy and abandon both NIRP and the multi-tiered current account structure and set rates on all excess reserves at 0.1%. He also sees both the yield curve control (YCC) and the inflation-overshooting commitment ending, replaced by a benchmark for the pace of the bank’s JGB purchasing activity. The house view forecast of 50bps of hikes through 2025 is more hawkish than the market but risks are still tilted to the upside. On Friday, the Japan Trade Union Confederation (Rengo) announced the first tally of the results of this year's shunto spring wage negotiation. The wage increase rate, including the seniority-based wage hike, is 5.28%, which was significantly higher than expected. This year will probably see the highest wage settlements since 1991 which given Japan’s recent history is an incredible turnaround. This wage data news has firmed up expectations for tomorrow.
With regards to the FOMC which concludes on Wednesday, DB economists expect only minor revisions to the meeting statement that saw an overhaul last meeting. With regards to the SEP, the growth and unemployment forecasts are unlikely to change but the 2024 inflation forecasts potentially could; elsewhere, expect the Fed to revise up their 2024 core PCE inflation forecast by a tenth to 2.5%, although they see meaningful risks that it gets revised up even higher to 2.6%. In our economists' view, a 2.5% core PCE reading would allow just enough wiggle room to keep the 2024 fed funds rate at 4.6% (75bps of cuts). However, if core PCE inflation were revised up to 2.6%, it would likely entail the Fed moving their base case back to 50bps of cuts, as this would essentially reflect the same forecasts as the September 2023 SEP.
Beyond 2024, DB expect officials to build in less policy easing due to a higher r-star. If two of the eight officials currently at 2.5% move up by 25bps, then the long-run median forecast would edge up to 2.6%. This could be justified by a one-tenth upgrade to the long-run growth forecast. After all this information is released the presser from Powell will of course be heavily scrutinised, especially on how Powell sees recent inflation data. Powell should also provide an update on discussions around QT but it is unlikely they are ready yet to release updated guidance.
One additional global highlight this week might be a big fall in UK inflation on Wednesday, suggesting that headline CPI will slow to 3.4% (vs 4% in January) and core to 4.5% (5.1%). Elsewhere there is plenty of ECB speaker appearances including President Lagarde on Wednesday. They are all highlighted in the day-by-day guide at the end.
Courtesy of DB, here is a day-by-day calendar of events
Monday March 18
- Data: US March New York Fed services business activity, NAHB housing market index, China February retail sales, industrial production, property investment, Eurozone January trade balance, Canada February raw materials, industrial product price index, existing home sales
Tuesday March 19
- Data: US January total net TIC flows, February housing starts, building permits, Japan January capacity utilization, Germany and Eurozone March Zew survey, Eurozone Q4 labour costs, Canada February CPI
- Central banks: BoJ decision, ECB's Guindos speaks, RBA decision
- Auctions: US 20-yr Bond ($13bn, reopening)
Wednesday March 20
- Data: UK February CPI, PPI, RPI, January house price index, China 1-yr and 5-yr loan prime rates, Japan February trade balance, Italy January industrial production, Germany February PPI, Eurozone March consumer confidence, January construction output
- Central banks: Fed's decision, ECB's Lagarde, Lane, De Cos, Schnabel, Nagel and Holzmann speak, BoC summary of deliberations
- Earnings: Tencent, Micron
Thursday March 21
- Data: US, UK, Japan, Germany, France and Eurozone March PMIs, US March Philadelphia Fed business outlook, February leading index, existing home sales, Q4 current account balance, initial jobless claims, UK February public finances, Japan February national CPI, Italy January current account balance, France March manufacturing confidence, February retail sales, ECB January current account, EU27 February new car registrations
- Central banks: BoE decision, SNB decision
- Earnings: Nike, FedEx, Lululemon, BMW, Enel
- Auctions: US 10-yr TIPS ($16bn, reopening)
- Other: European Union summit, through March 22
Friday March 22
- Data: UK March GfK consumer confidence, February retail sales, Germany March Ifo survey, January import price index, Canada January retail sales
* * *
Finally, looking at just the US, Goldman notes that the key economic data releases this week are the Philadelphia Fed manufacturing index and existing home sales reports on Thursday. The March FOMC meeting is on Wednesday. The post-meeting statement will be released at 2:00 PM ET, followed by Chair Powell’s press conference at 2:30 PM. There are several speaking engagements from Fed officials this week, including Chair Powell, Vice Chair for Supervision Barr, and President Bostic.
Monday, March 18
- There are no major economic data releases scheduled.
Tuesday, March 19
- 08:30 AM Housing starts, February (GS +9.4%, consensus +7.4%, last -14.8%); Building permits, February (consensus +2.0%, last -0.3%)
Wednesday, March 20
- 02:00 PM FOMC statement, March 19 – March 20 meeting: As discussed in our FOMC preview, we continue to expect the committee to target a first cut in June, but we now expect 3 cuts in 2024 in June, September, and December (vs. 4 previously) given the slightly higher inflation path. We continue to expect 4 cuts in 2025 and now expect 1 final cut in 2026 to an unchanged terminal rate forecast of 3.25-3.5%. The main risk to our expectation is that FOMC participants might be more concerned about the recent inflation data and less convinced that inflation will resume its earlier soft trend. In that case, they might bump up their 2024 core PCE inflation forecast to 2.5% and show a 2-cut median.
Thursday, March 21
- 08:30 AM Current account balance, Q4 (consensus -$209.5bn, last -$200.3bn)
- 08:30 AM Philadelphia Fed manufacturing index, March (GS 3.2, consensus -1.3, last 5.2): We estimate that the Philadelphia Fed manufacturing index fell 2pt to 3.2 in March. While the measure is elevated relative to other surveys, we expect a boost from the rebound in foreign manufacturing activity and the pickup in US production and freight activity.
- 08:30 AM Initial jobless claims, week ended March 16 (GS 210k, consensus 215k, last 209k): Continuing jobless claims, week ended March 9 (consensus 1,815k, last 1,811k)
- 09:45 AM S&P Global US manufacturing PMI, March preliminary (consensus 51.8, last 52.2): S&P Global US services PMI, March preliminary (consensus 52.0, last 52.3)
- 10:00 AM Existing home sales, February (GS +1.2%, consensus -1.6%, last +3.1%)
- 02:00 PM Federal Reserve Vice Chair for Supervision Barr speaks: Federal Reserve Vice Chair Michael for Supervision Barr will participate in a fireside chat in Ann Arbor, MI with students and faculty. A moderated Q&A is expected. On February 14, Barr said the Fed is “confident we are on a path to 2% inflation,” but the recent report showing prices rose faster than anticipated in January “is a reminder that the path back to 2% inflation may be a bumpy one.” Barr also noted that “we need to see continued good data before we can begin the process of reducing the federal funds rate.”
Friday, March 22
- 09:00 AM Fed Reserve Chair Powell speaks: The Federal Reserve Board will host a Fed Listens event in Washington D.C. on “Transitioning to the Post-Pandemic Economy.” Chair Powell will deliver opening remarks. Vice Chair Phillip Jefferson and Fed Governor Michelle Bowman will moderate conversations with leaders from various organizations. On March 6, Chair Powell noted in his congressional testimony that if the economy evolves broadly as expected, it will likely be appropriate to begin dialing back policy restraint at some point this year.
- 12:00 PM Federal Reserve Vice Chair for Supervision Barr speaks: Federal Reserve Vice Chair for Supervision Michael Barr will participate in a virtual event on “International Economic and Monetary Design.” A moderated Q&A is expected.
- 04:00 PM Atlanta Fed President Bostic (FOMC voter) speaks: Atlanta Fed President Raphael Bostic will participate in a moderated conversation at the 2024 Household Finance Conference in Atlanta. On March 4, Bostic said, “I need to see more progress to feel fully confident that inflation is on a sure path to averaging 2% over time.” Bostic also noted, “I expect the first interest rate cut, which I have penciled in for the third quarter, will be followed by a pause in the following meeting.”
Source: DB, Goldman, BofA
International
Key Events This Week: Central Banks Galore Including A Historic Rate Hike By The BOJ
Key Events This Week: Central Banks Galore Including A Historic Rate Hike By The BOJ
According to DB’s Jim Reid, "this could be a landmark…
Share this:

According to DB's Jim Reid, "this could be a landmark week in markets as the last global holdout on negative rates looks set to be removed as the BoJ likely hikes rates from -0.1% tomorrow." That will likely overshadow the FOMC that concludes on Wednesday that will have its own signalling intrigue given recent strong inflation. We also have the RBA meeting tomorrow and the SNB and BoE meetings on Thursday to close out a big week for global central bankers with many EM countries also deciding on policy. We’ll preview the main meetings in more depth below but outside of this we have the global flash PMIs on Thursday as well as inflation reports in Japan (Thursday) and the UK (Wednesday). US housing data also permeates through the week as you'll see in the full global day-by-day week ahead at the end as usual.
Let’s go into detail now, starting with the BoJ tomorrow. We’ve had negative base rates now for 8 years which if is the longest run ever seen for any country in the history of mankind. In fact it is doubtful that pre-historic man was as generous as to charge negative interest rates on lending money prior to this! It also might be one of the longest global runs without any interest rate hikes given the 17 year run that could end tomorrow. So, as Reid puts it, a landmark event.
DB's Chief Japan economist expects the central bank to revise its policy and abandon both NIRP and the multi-tiered current account structure and set rates on all excess reserves at 0.1%. He also sees both the yield curve control (YCC) and the inflation-overshooting commitment ending, replaced by a benchmark for the pace of the bank’s JGB purchasing activity. The house view forecast of 50bps of hikes through 2025 is more hawkish than the market but risks are still tilted to the upside. On Friday, the Japan Trade Union Confederation (Rengo) announced the first tally of the results of this year's shunto spring wage negotiation. The wage increase rate, including the seniority-based wage hike, is 5.28%, which was significantly higher than expected. This year will probably see the highest wage settlements since 1991 which given Japan’s recent history is an incredible turnaround. This wage data news has firmed up expectations for tomorrow.
With regards to the FOMC which concludes on Wednesday, DB economists expect only minor revisions to the meeting statement that saw an overhaul last meeting. With regards to the SEP, the growth and unemployment forecasts are unlikely to change but the 2024 inflation forecasts potentially could; elsewhere, expect the Fed to revise up their 2024 core PCE inflation forecast by a tenth to 2.5%, although they see meaningful risks that it gets revised up even higher to 2.6%. In our economists' view, a 2.5% core PCE reading would allow just enough wiggle room to keep the 2024 fed funds rate at 4.6% (75bps of cuts). However, if core PCE inflation were revised up to 2.6%, it would likely entail the Fed moving their base case back to 50bps of cuts, as this would essentially reflect the same forecasts as the September 2023 SEP.
Beyond 2024, DB expect officials to build in less policy easing due to a higher r-star. If two of the eight officials currently at 2.5% move up by 25bps, then the long-run median forecast would edge up to 2.6%. This could be justified by a one-tenth upgrade to the long-run growth forecast. After all this information is released the presser from Powell will of course be heavily scrutinised, especially on how Powell sees recent inflation data. Powell should also provide an update on discussions around QT but it is unlikely they are ready yet to release updated guidance.
One additional global highlight this week might be a big fall in UK inflation on Wednesday, suggesting that headline CPI will slow to 3.4% (vs 4% in January) and core to 4.5% (5.1%). Elsewhere there is plenty of ECB speaker appearances including President Lagarde on Wednesday. They are all highlighted in the day-by-day guide at the end.
Courtesy of DB, here is a day-by-day calendar of events
Monday March 18
- Data: US March New York Fed services business activity, NAHB housing market index, China February retail sales, industrial production, property investment, Eurozone January trade balance, Canada February raw materials, industrial product price index, existing home sales
Tuesday March 19
- Data: US January total net TIC flows, February housing starts, building permits, Japan January capacity utilization, Germany and Eurozone March Zew survey, Eurozone Q4 labour costs, Canada February CPI
- Central banks: BoJ decision, ECB's Guindos speaks, RBA decision
- Auctions: US 20-yr Bond ($13bn, reopening)
Wednesday March 20
- Data: UK February CPI, PPI, RPI, January house price index, China 1-yr and 5-yr loan prime rates, Japan February trade balance, Italy January industrial production, Germany February PPI, Eurozone March consumer confidence, January construction output
- Central banks: Fed's decision, ECB's Lagarde, Lane, De Cos, Schnabel, Nagel and Holzmann speak, BoC summary of deliberations
- Earnings: Tencent, Micron
Thursday March 21
- Data: US, UK, Japan, Germany, France and Eurozone March PMIs, US March Philadelphia Fed business outlook, February leading index, existing home sales, Q4 current account balance, initial jobless claims, UK February public finances, Japan February national CPI, Italy January current account balance, France March manufacturing confidence, February retail sales, ECB January current account, EU27 February new car registrations
- Central banks: BoE decision, SNB decision
- Earnings: Nike, FedEx, Lululemon, BMW, Enel
- Auctions: US 10-yr TIPS ($16bn, reopening)
- Other: European Union summit, through March 22
Friday March 22
- Data: UK March GfK consumer confidence, February retail sales, Germany March Ifo survey, January import price index, Canada January retail sales
* * *
Finally, looking at just the US, Goldman notes that the key economic data releases this week are the Philadelphia Fed manufacturing index and existing home sales reports on Thursday. The March FOMC meeting is on Wednesday. The post-meeting statement will be released at 2:00 PM ET, followed by Chair Powell’s press conference at 2:30 PM. There are several speaking engagements from Fed officials this week, including Chair Powell, Vice Chair for Supervision Barr, and President Bostic.
Monday, March 18
- There are no major economic data releases scheduled.
Tuesday, March 19
- 08:30 AM Housing starts, February (GS +9.4%, consensus +7.4%, last -14.8%); Building permits, February (consensus +2.0%, last -0.3%)
Wednesday, March 20
- 02:00 PM FOMC statement, March 19 – March 20 meeting: As discussed in our FOMC preview, we continue to expect the committee to target a first cut in June, but we now expect 3 cuts in 2024 in June, September, and December (vs. 4 previously) given the slightly higher inflation path. We continue to expect 4 cuts in 2025 and now expect 1 final cut in 2026 to an unchanged terminal rate forecast of 3.25-3.5%. The main risk to our expectation is that FOMC participants might be more concerned about the recent inflation data and less convinced that inflation will resume its earlier soft trend. In that case, they might bump up their 2024 core PCE inflation forecast to 2.5% and show a 2-cut median.
Thursday, March 21
- 08:30 AM Current account balance, Q4 (consensus -$209.5bn, last -$200.3bn)
- 08:30 AM Philadelphia Fed manufacturing index, March (GS 3.2, consensus -1.3, last 5.2): We estimate that the Philadelphia Fed manufacturing index fell 2pt to 3.2 in March. While the measure is elevated relative to other surveys, we expect a boost from the rebound in foreign manufacturing activity and the pickup in US production and freight activity.
- 08:30 AM Initial jobless claims, week ended March 16 (GS 210k, consensus 215k, last 209k): Continuing jobless claims, week ended March 9 (consensus 1,815k, last 1,811k)
- 09:45 AM S&P Global US manufacturing PMI, March preliminary (consensus 51.8, last 52.2): S&P Global US services PMI, March preliminary (consensus 52.0, last 52.3)
- 10:00 AM Existing home sales, February (GS +1.2%, consensus -1.6%, last +3.1%)
- 02:00 PM Federal Reserve Vice Chair for Supervision Barr speaks: Federal Reserve Vice Chair Michael for Supervision Barr will participate in a fireside chat in Ann Arbor, MI with students and faculty. A moderated Q&A is expected. On February 14, Barr said the Fed is “confident we are on a path to 2% inflation,” but the recent report showing prices rose faster than anticipated in January “is a reminder that the path back to 2% inflation may be a bumpy one.” Barr also noted that “we need to see continued good data before we can begin the process of reducing the federal funds rate.”
Friday, March 22
- 09:00 AM Fed Reserve Chair Powell speaks: The Federal Reserve Board will host a Fed Listens event in Washington D.C. on “Transitioning to the Post-Pandemic Economy.” Chair Powell will deliver opening remarks. Vice Chair Phillip Jefferson and Fed Governor Michelle Bowman will moderate conversations with leaders from various organizations. On March 6, Chair Powell noted in his congressional testimony that if the economy evolves broadly as expected, it will likely be appropriate to begin dialing back policy restraint at some point this year.
- 12:00 PM Federal Reserve Vice Chair for Supervision Barr speaks: Federal Reserve Vice Chair for Supervision Michael Barr will participate in a virtual event on “International Economic and Monetary Design.” A moderated Q&A is expected.
- 04:00 PM Atlanta Fed President Bostic (FOMC voter) speaks: Atlanta Fed President Raphael Bostic will participate in a moderated conversation at the 2024 Household Finance Conference in Atlanta. On March 4, Bostic said, “I need to see more progress to feel fully confident that inflation is on a sure path to averaging 2% over time.” Bostic also noted, “I expect the first interest rate cut, which I have penciled in for the third quarter, will be followed by a pause in the following meeting.”
Source: DB, Goldman, BofA


Mistakes Were Made


Home buyers must now navigate higher mortgage rates and prices


Supreme Court Rules Public Officials May Block Their Constituents On Social Media


Gen Z, The Most Pessimistic Generation In History, May Decide The Election


“Extreme Events”: US Cancer Deaths Spiked In 2021 And 2022 In “Large Excess Over Trend”


Harvard Medical School Professor Was Fired Over Not Getting COVID Vaccine


Germany Is Running Out Of Money And Debt Levels Are Exploding, Finance Minister Warns


TikTok Ban Obscures Chinese Stock Gold Rush


Default: San Francisco Four Seasons Hotel Investors $3 Million Late On Loan As Foreclosure Looms


You can strike gold and silver investment opportunities at Costco
-

 Uncategorized4 weeks ago
All Of The Elements Are In Place For An Economic Crisis Of Staggering Proportions
-

 Spread & Containment5 days ago
IFM’s Hat Trick and Reflections On Option-To-Buy M&A
-

 International1 week ago
EyePoint poaches medical chief from Apellis; Sandoz CFO, longtime BioNTech exec to retire
-

 Uncategorized1 month ago
California Counties Could Be Forced To Pay $300 Million To Cover COVID-Era Program
-

 Uncategorized3 weeks ago
Apparel Retailer Express Moving Toward Bankruptcy
-

 Uncategorized1 month ago
Industrial Production Decreased 0.1% in January
-

 International1 week ago
Walmart launches clever answer to Target’s new membership program
-

 Uncategorized1 month ago
RFK Jr: The Wuhan Cover-Up & The Rise Of The Biowarfare-Industrial Complex