Uncategorized
Mega-Jolt: The Costs & Logistics Of Plugging In EVs Are About To Become Supercharged
Mega-Jolt: The Costs & Logistics Of Plugging In EVs Are About To Become Supercharged
Authored by John Murkowski via RealClear Wire,
U.S….
Share this:

Authored by John Murkowski via RealClear Wire,
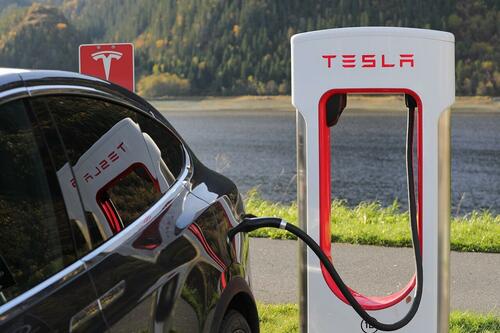
U.S. Energy Secretary Jennifer Granholm gave Americans an unintended glimpse of the future during her road trip this summer touting the wonders of electric vehicles. Far from spotlighting the promise of EVs, her public relations misadventure in Georgia involved one of her staff in a gasoline-powered vehicle blocking off a coveted charger in advance of her arrival, leading to frayed tempers and a local EV owner calling the cops. It was an illustration of the challenges drivers could face as governments push the public to embrace plug-in vehicles.
Hyped as technological marvels, EVs are boobytrapped with a host of inconveniences and tradeoffs. By now many people have heard about range anxiety, exploding lithium-ion batteries, and the environmental destruction caused by global mining for battery minerals.
But another wave of challenges is in the offing as the federal government and state officials pump in billions of dollars to build out a massive national infrastructure of charging stations to power the EVs.
The sheer scale of a charging infrastructure means recruiting retailers and businesses to install and maintain chargers that are expected to lose money in the near future, with some likely to be written off as economic losses.
In California, which is slated to ban sales of new gasoline-powered cars in just 12 years, government estimates indicate the state may need to install at least 20 electric chargers for every gas pump now in service to create a reliable, seamless network.
Massive public subsidies will be a crucial part of this effort because private industry is not willing to take the financial risks of betting on an uncertain future. Government subsidies mean complying with recordkeeping and reporting mandates and making sure chargers are online 97% of the time, while bearing the financial risk of vandalism, mechanical malfunctions, daily fluctuations in electricity pricing, and cashflow unpredictability.
A “net zero” society inherently favors the haves over the have-nots. Renters and low-income families aren’t as likely to own private chargers, and electricity purchased from public chargers can cost five to 10 times as much as charging privately in a garage at home. To avoid penalizing the little guy, federal EV mandates require that 40% of benefits pay for public chargers in disadvantaged areas, while California requires that at least half go to such “equity” communities, where relatively few people currently drive EVs.
The rapid transition from a reliable legacy energy infrastructure that’s more than a century old to emerging technologies in just a few decades will require the buy-in of virtually every American, including relearning driving habits and adopting charging patterns that right now constitute the leisurely prerogative of early adopters and trend-setters.
“We need to make sure the infrastructure is overbuilt, oversupplied and over-capacity so that nobody as a driver gets stranded,” said John Eichberger, executive director of the Transportation Energy Institute, a nonprofit research organization. “When you point out the challenges to a believer or a staunch advocate, well now you’re just being negative, you’re just trying to impede progress.”
The energy secretary’s imbroglio this summer encapsulates the logistical, financial and social challenges that get glossed over in a bid to win public support for creating a carbon-neutral society that could not happen without massive government underwriting. It’s a familiar pattern of selling complicated policies as simple fixes, where the cultural gatekeepers misrepresent EVs as a “net zero” technology, lowball the total land area needed to build out solar and wind farms, and make it difficult if not impossible for critics to question the apocalyptic assumptions and dystopian predictions of climate action advocates.
To curb greenhouse gas emissions, California, New Jersey, New York, Massachusetts, Maryland, and other states have outlawed the sale of new gasoline cars starting in 2035, and similar EV mandates have been adopted by nearly 60 countries. The Biden administration is spending $7.5 billion on 500,000 EV charging ports as part of the 2021 Infrastructure Investment and Jobs Act to boost EV sales targets to 50% of all new vehicle purchases by 2030.
EV sales are creeping up, but nowhere near the ambitious targets set by the policy experts, accounting for under 8% of new car sales in the third quarter, and rising to nearly 10% in September. California is at the vanguard of the nation’s EV transition, with more than 1 million electric vehicles among the state’s 31-million-plus registered vehicles, and EVs accounting for about 25% of new car sales in the second quarter.
California’s forecasts, investments, and challenges show the EV transition in a fuller light. To date, the state has committed at least $14 billion for EV infrastructure development and clean transportation, the money coming mostly from taxpayers. Other contributors include that state’s electric utilities, the National Electric Vehicle Infrastructure program, as well as the state’s share of the $14.7 billion settlement with Volkswagen over the Dieselgate emissions cheating scandal.
“With so much money swishing around, especially government subsidy monies, why would anyone really want to sit back and say, ‘hold on a minute’?” said Robert Charette, President of the ITABHI Corporation, a management consulting firm based in Spotsylvania, Va., who writes about EV charging challenges. “The EV transition party is just starting, and no one wants the punchbowl to be taken away anytime soon.”
At some point, EV experts promise, the kinks will get worked out, and EVs will become as convenient as smartphones. But at the present, the EV industry has a classic chicken-and-egg problem on its hands. The current demand for EV charging does not economically justify rapidly expanding the nation’s charging infrastructure, but without an expanded charging infrastructure in place, most people won’t buy EVs for fear of being stranded.
Despite California’s massive infrastructure investment, now totaling nearly 94,000 public chargers, the state has fallen behind its goal of 250,000 public chargers by 2025 – and potentially 10 times that number by 2035, when the ban on new gasoline-powered cars takes effect.
Transition on a Massive Scale
The sweeping societal transition decreed by government fiat puts the onus on government officials to finance the buildout of a charging infrastructure as reliable as a utility service.
“Rarely has a government, at least the U.S. government, banned specific products or behaviors that are so widely used or undertaken,” the conservative Manhattan Institute said in a recent EV report. The report points out that EVs are unlike other emerging technologies that people buy willingly: More than a century ago, “to encourage adoption of the newly invented gasoline-powered cars, governments didn’t have to ban horses.”
The scale of the transition is so immense and involves such uncharted waters that there’s no consensus on the amount of public chargers that will be needed.
According to a California Energy Commission assessment, California will need more than 2.4 million public chargers to accommodate about 15.5 million electric cars, trucks, and buses by 2035. That breaks down to 2.11 million chargers (including 83,000 fast chargers) to support 15.2 million electric cars, as well as 256,000 depot chargers and 8,500 public chargers for 377,000 trucks and buses.
The 2.4 million chargers would serve only half the registered vehicles in the state. Many more will be necessary to complete the second half of the transition, from 15.5 million EVs to more than 31 million EVs by mid-century.
Those chargers will have to be installed at curbsides, parking lots, parking decks, grocery stores, restaurants, convenience stores, big box stores, office buildings, strip malls, shopping centers, movie theaters, and a host of other locations so that drivers always have ready access to plug-in.
By comparison, California now has about 11,000 gas stations, convenience stores, and other businesses that sell gasoline, which roughly converts to about 110,000 individual gas nozzles, according to an estimate by Jeff Lenard, vice president of Strategic Industry Initiatives at the National Association of Convenience Stores. That means the transition from fossil fuels to electrons will require California to install at least 20 EV charging ports for every gas nozzle by 2035.
Not all chargers are equal, so the new EV infrastructure will require significant changes in driving habits. While so-called fast chargers can bring a battery to 80% of capacity in under an hour, most of the new public chargers will be cheaper, Level 2 technology, which provides between 5 miles and 60 miles of range for each hour of charging, and isn’t practical for charging up quickly on a road trip.
What’s more, some of these Level 2 chargers will be “shared private” chargers, meaning that they are available at workplaces and housing complexes, and limited to employees, tenants, and visitors. Today, for example, more than half of California’s 94,000 chargers are “shared private.” As a result, many Americans will likely have to coordinate other activities with publicly charging their plug-in cars, such as shopping or eating out, which becomes more involved than a quick stop at the pump to fill it up.
(The state doesn’t keep track of the estimated hundreds of thousands of private chargers that are typically housed in someone’s garage and operate at 120 volts to provide between 3 miles and 5 miles of range for every hour of overnight charging.)
A High-Risk, Low-Margin Business
For the foreseeable future, chargers are expected to lose money until there are enough EVs on the road to justify the investment.
The cost of building a fast-charging station with four or more charging ports can range from several hundred thousand dollars to more than $1 million, depending on the cost of labor, trenching, and power grid upgrades.
Unlike gas prices, which are relatively stable, electricity prices vary during the day, so that fast chargers are subject to complicated peak demand price fluctuations and unpredictable monthly “demand charges” for the highest level of electricity needed from the local power company. Charging companies, utility regulators, and power companies around the country are trying out various solutions to help charging companies predict their costs in advance, such as variable pricing for customers, so they can manage their risk and set prices accordingly. Future strategies could include on-site battery backup and storage, combined with solar power generation, to shift load and even out demand during the day.
Electric utilities and charging companies are not always allied. Private charging companies sometimes refuse to compete directly against regulated utilities that have guaranteed profit. Last year, in a move to encourage charging companies to invest in the state, the California Public Utilities Commission barred the state’s utilities from participating a statewide five-year, $1 billion EV charging rebate program.
Wyoming officials commissioned consultants to assess the financial viability of chargers in their state, and the consultants said that seven remote sites would be used so infrequently they would lose from $285,000 to $372,000 per site over five years. EV industry analyst Loren McDonald, who is CEO of the consulting firm EVAdoption, wrote an analysis concluding that remote highway sites in states such as Wyoming, North Dakota, South Dakota, Montana, Idaho, and others are not likely to break even for at least five years and possibly 10 years, even with 80% of the costs covered by federal subsidies.
McDonald and Charette both said this calculus is not limited to sparsely populated states, but also applies to “charging deserts” in larger states with large urban areas.
“I think it isn’t just an isolated issue but a larger national problem that is not being fully acknowledged,” Charette said. “Once outside the major travel corridors and urban/suburban areas, independent EV charging stations are not going to be economically viable for quite some time.”
California officials say that chargers operating at convenience stores and other retailers will have to depend on selling other amenities to make money, basically operating as loss-leaders. A 2022 report from the California Energy Commission notes: “Revenue from electricity sales alone is often not enough today for chargers to be profitable, especially for stations with lower utilization.”
The California Energy Commission describes other potential risks, such as state-subsidized, money-losing chargers being decommissioned.
“It is also a risk that chargers are not operated beyond the required term of the agreement if utilization is not high enough,” the report advises. “These risks are higher in areas with lower population density and travel demand.”
In response to questions from RealClearInvestigations, the California Energy Commission said by email that not every charger has to be profitable in order to have a profitable network.
“In addition, profitability of charging in and of itself may not be the primary goal of an installation,” the agency said. “For example, charging installed at a workplace, retail establishment, or apartment or condo building may be part of an attractive package of benefits and to drive customers to shopping centers and restaurants or local residents to parks.”
Among the major charging companies, Electrify America does not publicly report its finances, but EVgo and ChargePoint have consistently reported operating losses and negative cashflows since their founding in 2010 and 2007, respectively, according to financial disclosures filed with the Securities and Exchange Commission.
“This partly fuels my hunch on why station operators have historically been slow to repair non-working stations,” blogged Chris Kaiser, who leads the EV charging practice for Sona Energy Solutions, a consulting and contracting firm. “If they don't make money on station operations they are better off having a broke station!”
Undependable, Unavailable
Reliability remains a persistent problem, one that will shadow the industry as chargers are built out in remote areas, low-income areas, and other out-of-the-way places.
Tesla’s proprietary charging network, which has operated as a walled garden for Tesla owners, is the notable exception, consistently yielding high satisfaction scores. Tesla’s proprietary super chargers, which number 21,789 ports at 1,968 locations nationwide, are being opened up to non-Tesla owners around the country as the charger industry inches toward standardization. Currently different cars use different apps and networks, creating a replay of the VHS/BetaMax problem.
The federal National Electric Vehicle Infrastructure program, approved as part of the Infrastructure Investment and Jobs Act, requires federally funded chargers to operate at a 97% reliability standard for at least five years. And California’s state-funded chargers would have to operate at the same standard for six years.
As a stand-alone number, 97% sounds near-perfect, until one reads the small print. Downtime doesn’t count if the malfunction is caused by vandalism, natural disasters, power outages, scheduled maintenance or limited hours of operation. Downtime begins when a driver or someone else reports the nonoperational status, not when the charger breaks down. And it’s not clear what the consequence would be for failing to meet the standard, as there is no penalty, likely because imposing additional costs would only increase risks and deter private investment.
Reviewing the public documents on EV chargers evokes memories of neglected and abused public payphones that stood exposed to harsh weather conditions and didn’t produce a dial tone. According to a California Energy Commission report issued in September: “EV charging stations are typically uncovered and unprotected from the elements. Connectors can be bent or run over by vehicles. Cables can be cut as acts of vandalism or stolen for copper. EV charging stations frequently incorporate screens that are necessary for operation, but screens can fade in sunlight, break, or be smashed.”
There’s a huge perception gap on this issue. When EV service providers were surveyed about reliability, they said their equipment works 95%-98% of the time. “The data from the two surveys suggest there may be a disconnect between what drivers are experiencing and what the EVSPs are reporting,” the CARB report drolly stated.
What drivers are experiencing has been abundantly documented. The analytics firm J.D. Power said this year that 20% of all EV drivers reported visiting a charger that did not or could not charge because it wasn’t working or there were long lines. The dissatisfaction rates ranged from 12% in the Cleveland-Akron-Canton area to 35% in South Florida. The firm said the trend is moving in the wrong direction: As more people buy EVs, “overall satisfaction continues to decline.”
A University of California, Berkeley, study last year found similar results: only 72.5% of chargers in the Bay Area were functional. A newspaper columnist in California described the charging experience as miserable. “The misery was meted out in several ways,” he documented. “Charging stations were hard to find. Maps that locate stations were not reliable. Paying for a charge with a credit card often proved troublesome, sometimes impossible. Worst of all, way too many chargers were broken or otherwise out of order.”
He warned of a public backlash against the state’s mandate banning the sale of non-electric cars in 2035 if the situation doesn’t improve.
This year, an exasperated Los Angeles Times columnist declared she’s ready to trade in her EV because charging is such a hassle. She wrote that chargers are sometimes blocked by cars that aren’t charging, exposed to blistering sunlight, charging at lower levels than advertised, or “it may shut off mid-charge with no warning or reason.”
The frustration seems to have no expiration date. As Jonathan Levy, EVgo chief commercial officer, told the New York Times last year: “Where there’s a screen, there’s a baseball bat.”
jmurawski@realclearinvestigations.com
Twitter: @johnmurawski
Uncategorized
February Employment Situation
By Paul Gomme and Peter Rupert The establishment data from the BLS showed a 275,000 increase in payroll employment for February, outpacing the 230,000…
Share this:


By Paul Gomme and Peter Rupert
The establishment data from the BLS showed a 275,000 increase in payroll employment for February, outpacing the 230,000 average over the previous 12 months. The payroll data for January and December were revised down by a total of 167,000. The private sector added 223,000 new jobs, the largest gain since May of last year.

Temporary help services employment continues a steep decline after a sharp post-pandemic rise.


Average hours of work increased from 34.2 to 34.3. The increase, along with the 223,000 private employment increase led to a hefty increase in total hours of 5.6% at an annualized rate, also the largest increase since May of last year.

The establishment report, once again, beat “expectations;” the WSJ survey of economists was 198,000. Other than the downward revisions, mentioned above, another bit of negative news was a smallish increase in wage growth, from $34.52 to $34.57.

The household survey shows that the labor force increased 150,000, a drop in employment of 184,000 and an increase in the number of unemployed persons of 334,000. The labor force participation rate held steady at 62.5, the employment to population ratio decreased from 60.2 to 60.1 and the unemployment rate increased from 3.66 to 3.86. Remember that the unemployment rate is the number of unemployed relative to the labor force (the number employed plus the number unemployed). Consequently, the unemployment rate can go up if the number of unemployed rises holding fixed the labor force, or if the labor force shrinks holding the number unemployed unchanged. An increase in the unemployment rate is not necessarily a bad thing: it may reflect a strong labor market drawing “marginally attached” individuals from outside the labor force. Indeed, there was a 96,000 decline in those workers.


Earlier in the week, the BLS announced JOLTS (Job Openings and Labor Turnover Survey) data for January. There isn’t much to report here as the job openings changed little at 8.9 million, the number of hires and total separations were little changed at 5.7 million and 5.3 million, respectively.

As has been the case for the last couple of years, the number of job openings remains higher than the number of unemployed persons.

Also earlier in the week the BLS announced that productivity increased 3.2% in the 4th quarter with output rising 3.5% and hours of work rising 0.3%.

The bottom line is that the labor market continues its surprisingly (to some) strong performance, once again proving stronger than many had expected. This strength makes it difficult to justify any interest rate cuts soon, particularly given the recent inflation spike.
unemployment pandemic unemploymentUncategorized
Mortgage rates fall as labor market normalizes
Jobless claims show an expanding economy. We will only be in a recession once jobless claims exceed 323,000 on a four-week moving average.
Share this:


Everyone was waiting to see if this week’s jobs report would send mortgage rates higher, which is what happened last month. Instead, the 10-year yield had a muted response after the headline number beat estimates, but we have negative job revisions from previous months. The Federal Reserve’s fear of wage growth spiraling out of control hasn’t materialized for over two years now and the unemployment rate ticked up to 3.9%. For now, we can say the labor market isn’t tight anymore, but it’s also not breaking.
The key labor data line in this expansion is the weekly jobless claims report. Jobless claims show an expanding economy that has not lost jobs yet. We will only be in a recession once jobless claims exceed 323,000 on a four-week moving average.
From the Fed: In the week ended March 2, initial claims for unemployment insurance benefits were flat, at 217,000. The four-week moving average declined slightly by 750, to 212,250
Below is an explanation of how we got here with the labor market, which all started during COVID-19.
1. I wrote the COVID-19 recovery model on April 7, 2020, and retired it on Dec. 9, 2020. By that time, the upfront recovery phase was done, and I needed to model out when we would get the jobs lost back.
2. Early in the labor market recovery, when we saw weaker job reports, I doubled and tripled down on my assertion that job openings would get to 10 million in this recovery. Job openings rose as high as to 12 million and are currently over 9 million. Even with the massive miss on a job report in May 2021, I didn’t waver.
Currently, the jobs openings, quit percentage and hires data are below pre-COVID-19 levels, which means the labor market isn’t as tight as it once was, and this is why the employment cost index has been slowing data to move along the quits percentage.

3. I wrote that we should get back all the jobs lost to COVID-19 by September of 2022. At the time this would be a speedy labor market recovery, and it happened on schedule, too
Total employment data
4. This is the key one for right now: If COVID-19 hadn’t happened, we would have between 157 million and 159 million jobs today, which would have been in line with the job growth rate in February 2020. Today, we are at 157,808,000. This is important because job growth should be cooling down now. We are more in line with where the labor market should be when averaging 140K-165K monthly. So for now, the fact that we aren’t trending between 140K-165K means we still have a bit more recovery kick left before we get down to those levels.

From BLS: Total nonfarm payroll employment rose by 275,000 in February, and the unemployment rate increased to 3.9 percent, the U.S. Bureau of Labor Statistics reported today. Job gains occurred in health care, in government, in food services and drinking places, in social assistance, and in transportation and warehousing.
Here are the jobs that were created and lost in the previous month:

In this jobs report, the unemployment rate for education levels looks like this:
- Less than a high school diploma: 6.1%
- High school graduate and no college: 4.2%
- Some college or associate degree: 3.1%
- Bachelor’s degree or higher: 2.2%

Today’s report has continued the trend of the labor data beating my expectations, only because I am looking for the jobs data to slow down to a level of 140K-165K, which hasn’t happened yet. I wouldn’t categorize the labor market as being tight anymore because of the quits ratio and the hires data in the job openings report. This also shows itself in the employment cost index as well. These are key data lines for the Fed and the reason we are going to see three rate cuts this year.
recession unemployment covid-19 fed federal reserve mortgage rates recession recovery unemploymentUncategorized
Inside The Most Ridiculous Jobs Report In History: Record 1.2 Million Immigrant Jobs Added In One Month
Inside The Most Ridiculous Jobs Report In History: Record 1.2 Million Immigrant Jobs Added In One Month
Last month we though that the January…
Share this:


Last month we though that the January jobs report was the "most ridiculous in recent history" but, boy, were we wrong because this morning the Biden department of goalseeked propaganda (aka BLS) published the February jobs report, and holy crap was that something else. Even Goebbels would blush.
What happened? Let's take a closer look.
On the surface, it was (almost) another blockbuster jobs report, certainly one which nobody expected, or rather just one bank out of 76 expected. Starting at the top, the BLS reported that in February the US unexpectedly added 275K jobs, with just one research analyst (from Dai-Ichi Research) expecting a higher number.
Some context: after last month's record 4-sigma beat, today's print was "only" 3 sigma higher than estimates. Needless to say, two multiple sigma beats in a row used to only happen in the USSR... and now in the US, apparently.

Before we go any further, a quick note on what last month we said was "the most ridiculous jobs report in recent history": it appears the BLS read our comments and decided to stop beclowing itself. It did that by slashing last month's ridiculous print by over a third, and revising what was originally reported as a massive 353K beat to just 229K, a 124K revision, which was the biggest one-month negative revision in two years!

Of course, that does not mean that this month's jobs print won't be revised lower: it will be, and not just that month but every other month until the November election because that's the only tool left in the Biden admin's box: pretend the economic and jobs are strong, then revise them sharply lower the next month, something we pointed out first last summer and which has not failed to disappoint once.
In the past month the Biden department of goalseeking stuff higher before revising it lower, has revised the following data sharply lower:
— zerohedge (@zerohedge) August 30, 2023
- Jobs
- JOLTS
- New Home sales
- Housing Starts and Permits
- Industrial Production
- PCE and core PCE
To be fair, not every aspect of the jobs report was stellar (after all, the BLS had to give it some vague credibility). Take the unemployment rate, after flatlining between 3.4% and 3.8% for two years - and thus denying expectations from Sahm's Rule that a recession may have already started - in February the unemployment rate unexpectedly jumped to 3.9%, the highest since February 2022 (with Black unemployment spiking by 0.3% to 5.6%, an indicator which the Biden admin will quickly slam as widespread economic racism or something).

And then there were average hourly earnings, which after surging 0.6% MoM in January (since revised to 0.5%) and spooking markets that wage growth is so hot, the Fed will have no choice but to delay cuts, in February the number tumbled to just 0.1%, the lowest in two years...

... for one simple reason: last month's average wage surge had nothing to do with actual wages, and everything to do with the BLS estimate of hours worked (which is the denominator in the average wage calculation) which last month tumbled to just 34.1 (we were led to believe) the lowest since the covid pandemic...

... but has since been revised higher while the February print rose even more, to 34.3, hence why the latest average wage data was once again a product not of wages going up, but of how long Americans worked in any weekly period, in this case higher from 34.1 to 34.3, an increase which has a major impact on the average calculation.

While the above data points were examples of some latent weakness in the latest report, perhaps meant to give it a sheen of veracity, it was everything else in the report that was a problem starting with the BLS's latest choice of seasonal adjustments (after last month's wholesale revision), which have gone from merely laughable to full clownshow, as the following comparison between the monthly change in BLS and ADP payrolls shows. The trend is clear: the Biden admin numbers are now clearly rising even as the impartial ADP (which directly logs employment numbers at the company level and is far more accurate), shows an accelerating slowdown.

But it's more than just the Biden admin hanging its "success" on seasonal adjustments: when one digs deeper inside the jobs report, all sorts of ugly things emerge... such as the growing unprecedented divergence between the Establishment (payrolls) survey and much more accurate Household (actual employment) survey. To wit, while in January the BLS claims 275K payrolls were added, the Household survey found that the number of actually employed workers dropped for the third straight month (and 4 in the past 5), this time by 184K (from 161.152K to 160.968K).

This means that while the Payrolls series hits new all time highs every month since December 2020 (when according to the BLS the US had its last month of payrolls losses), the level of Employment has not budged in the past year. Worse, as shown in the chart below, such a gaping divergence has opened between the two series in the past 4 years, that the number of Employed workers would need to soar by 9 million (!) to catch up to what Payrolls claims is the employment situation.

There's more: shifting from a quantitative to a qualitative assessment, reveals just how ugly the composition of "new jobs" has been. Consider this: the BLS reports that in February 2024, the US had 132.9 million full-time jobs and 27.9 million part-time jobs. Well, that's great... until you look back one year and find that in February 2023 the US had 133.2 million full-time jobs, or more than it does one year later! And yes, all the job growth since then has been in part-time jobs, which have increased by 921K since February 2023 (from 27.020 million to 27.941 million).

Here is a summary of the labor composition in the past year: all the new jobs have been part-time jobs!

But wait there's even more, because now that the primary season is over and we enter the heart of election season and political talking points will be thrown around left and right, especially in the context of the immigration crisis created intentionally by the Biden administration which is hoping to import millions of new Democratic voters (maybe the US can hold the presidential election in Honduras or Guatemala, after all it is their citizens that will be illegally casting the key votes in November), what we find is that in February, the number of native-born workers tumbled again, sliding by a massive 560K to just 129.807 million. Add to this the December data, and we get a near-record 2.4 million plunge in native-born workers in just the past 3 months (only the covid crash was worse)!

The offset? A record 1.2 million foreign-born (read immigrants, both legal and illegal but mostly illegal) workers added in February!

Said otherwise, not only has all job creation in the past 6 years has been exclusively for foreign-born workers...

... but there has been zero job-creation for native born workers since June 2018!

This is a huge issue - especially at a time of an illegal alien flood at the southwest border...

... and is about to become a huge political scandal, because once the inevitable recession finally hits, there will be millions of furious unemployed Americans demanding a more accurate explanation for what happened - i.e., the illegal immigration floodgates that were opened by the Biden admin.
Which is also why Biden's handlers will do everything in their power to insure there is no official recession before November... and why after the election is over, all economic hell will finally break loose. Until then, however, expect the jobs numbers to get even more ridiculous.


Wendy’s has a new deal for daylight savings time haters


Mortgage rates fall as labor market normalizes


Racial and Ethnic Wealth Inequality in the Post‑Pandemic Era


Wealth Inequality by Age in the Post‑Pandemic Era


People Who Received Ivermectin Were Better Off, Study Finds


Shipping company files surprise Chapter 7 bankruptcy, liquidation


Interest rates, the best it gets. It’s time to deploy cash


Is the biotech market rally real? Data suggest comeback in private, public markets


February Employment Situation
Wendy’s teases new $3 offer for upcoming holiday
-

 Uncategorized2 weeks ago
All Of The Elements Are In Place For An Economic Crisis Of Staggering Proportions
-

 Uncategorized1 month ago
Cathie Wood sells a major tech stock (again)
-

 Uncategorized3 weeks ago
California Counties Could Be Forced To Pay $300 Million To Cover COVID-Era Program
-

 Uncategorized2 weeks ago
Apparel Retailer Express Moving Toward Bankruptcy
-

 Uncategorized3 weeks ago
Industrial Production Decreased 0.1% in January
-

 International2 days ago
Walmart launches clever answer to Target’s new membership program
-

 International2 days ago
EyePoint poaches medical chief from Apellis; Sandoz CFO, longtime BioNTech exec to retire
-

 Uncategorized3 weeks ago
RFK Jr: The Wuhan Cover-Up & The Rise Of The Biowarfare-Industrial Complex