International
Logica Capital November 2020 Commentary: Get Shorty
Logica Capital commentary for the month ended November 2020, discussing inflation breakevens. Q3 2020 hedge fund letters, conferences and more Logica Absolute Return – Up/Down Convexity – No Correlation Logica Tail Risk – Max Downside Convexity…
Share this:


Logica Capital commentary for the month ended November 2020, discussing inflation breakevens.

Q3 2020 hedge fund letters, conferences and more
Logica Absolute Return - Up/Down Convexity - No Correlation
Logica Tail Risk - Max Downside Convexity - Negative Correlation
November 2020 Performance*
Logica Absolute Return -2.1%
Logica Tail Risk -3.1%
S&P 500 +10.9%
VIX -17.45 pts
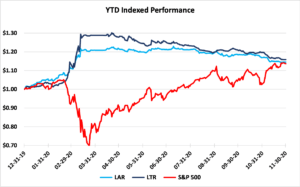
Year To Date Performance*
Logica Absolute Return +14.5%
Logica Tail Risk +15.8%
S&P 500 +13.7%
*Returns are Gross of fees to illustrate strategy performance.
Logica Absolute Return Fund, LP returned -2.17% (net) for November 2020
Summary: Equity markets entered November with high volatility priced for the US elections. As fears of a disorderly election retreated, a repeat of the 2016 post-election rally emerged. This was turbocharged by an unprecedented momentum reversal tied to the announcement of Covid-19 vaccines on November 9th. The combination of a sharp decline in volatility and poor results for the momentum factor resulted in unfavorable outcomes for Logica’s strategies.

“I hope you guys checked this place out good, cos I'm goin' in alone, and I don't want no f’n' surprises.”
“Oh, yeah. I checked everything, Momo.”
Get Shorty, 1995
One of the benefits in struggling to write the October letter is that we were able to offer a teaser of the difficult environment for long volatility in November. Unlike last month, the relationship between volatility (VIX) change and price change for the S&P 500 was perfectly normal, and as you’d expect in a month where the VIX fell by a near record amount (eclipsed only by April 2020) . Unfortunately, the character of that return was anything but normal.
We prepared for the election. Given the wide uncertainty of the outcome, we constrained our delta bias to a more S&P neutral exposure. In recognizing our limited ability to “call the election”, exchanging gamma scalping edge for a simple straddle was the safest bet. Having seen the dynamics of the 2016 election, and recognizing that markets were pricing in significant risk off with a VIX entering the month at 38, it made perfect sense to prepare for a reversal similar to 2016. This neutral position, alongside our momentum exposure on the long side, allowed us to offset the volatility crush from 38 to 25 that occurred from October until November 6th. On November 6th, with the election safely in the rear-view mirror and only the most intransigent convinced of an election reversal, we felt happy to be out of the woods.
Nicky: How’s Momo these days anyway?
Chili: Dead.
Who Killed Momo?
On Monday, November 9th, Pfizer announced the results of its Covid-19 vaccine trials and a light at the end of the long pandemic tunnel appeared. Markets reversed sharply, with underperformers rocketing higher and leaders over the shelter-in-place period collapsing. Our long positions in single stock call options on momentum-biased names were hammered while our puts on the S&P were concurrently hit as the S&P shot upwards. The momentum factor experienced the single largest one-day reversal in its history.
Given Logica’s momentum-focused long positions, it should be no surprise that this day was quite painful, accounting for nearly all of the losses for the month of November. For the remainder of the month, we struggled with the volatility crush that has bedeviled our approach throughout the summer, but the violence of this outlier momentum reversal requires examination. The narrative has been fairly straightforward: “The vaccines are around the corner and life will go back to normal. Better than normal, because the Biden administration is likely to push through sizeable stimulus and unlike the monetary stimulus of prior Obama & Trump administrations, this stimulus will be fiscal and therefore inflationary. Inflation is bad for growth and good for value, therefore value stocks will outperform from here.”
“You're trying to tell me you f’d up without sounding stupid.
That's hard to do.”
Having written a three-part series on the systematic value factor and explaining why we expected the momentum factor to persist, there would appear to be some egg on our faces.
“I wish he really was dead. He's a son of a bitch.”
Here’s the fascinating, but unsurprising, thing: the narrative is wrong. Both in its mechanical description of what occurred on November 9th and in the description of what occurred through the remainder of the month.
If we breakdown the performance of individual stocks by their factor rankings, we can analyze the contribution of each factor to the total return. For the election impact, we can look at returns from Nov 2nd to Nov 4th. For the vaccine, we can look at returns on Nov 9th. For the month of November, we can look at returns from October 30th to November 30th. When we do this, we discover that “value” has not been a positive contributor to return. What we saw in November was not a “value” rally – it was small stocks and “anti-momentum” (momentum shorts). Unfortunately, both factors that Logica emphasizes (size and momentum long) were negative contributions for the month.
If we focus exclusively on November 9th, there was positive contribution from the Value factor as well. But that contribution continued to be far less than size (bigger stocks did worse) and anti-momentum.
And finally, if we look at November ex-Nov 9th (returns for all of November ex-Nov 9th), we discover that momentum is not dead at all. But boy, was he a son of a b*tch in November.
“Look at me, Ray.”
“Did you just say look at you?”
“Look at me, Ray.”
“I'll tell you what, Harry. Why don't you take a f’n look at this?”
It is always dangerous to say, “It’s different this time”; and the natural conclusion after a decade of momentum and size outperformance is that “it’s time” for value to reassert itself. The world has a history of disappointing those whose rationale is “it’s time” (just ask Bob Dole, John McCain, Jeb Bush or Hilary Clinton). What we saw in November 2020 is functionally identical to the behavior in November 2016, but with the vaccine as the catalyst rather than the election.
In 2016, the Size, Growth & Value factors reversed soon after the lows in February 2016 with high beta cyclicals and commodities powering upwards on a reflationary theme. The election of Donald Trump added fuel to the fire (even though initially projected to lead to a market crash) and stocks, especially smaller and more cyclical names, rocketed higher. The dollar initially plummeted, and gold rose 27% from its lows. Sound familiar? And then the reflation trade as expressed in equities stopped roughly a month after the election while crude oil and copper prices rose through early 2018. With the Federal Reserve hiking and shrinking the balance sheet (remember the “like watching paint dry”?), 10-year interest rates pushed higher until Q4 2019.
But core CPI effectively peaked in the aftermath of the election at 2.2% and vacillated between 1.7 and 2.4% until March 2020 when it crashed to 1.2%. It has since recovered… and now turned lower again. Inflation breakevens have recovered to almost exactly their level from Dec 2016.
Statistically, we cannot distinguish between the 2016 and 2020 recoveries except for the US dollar (primarily against the Euro) and the S&P500 (higher) and Fed Balance Sheet (much higher). Will these drive the inflation narrative going forward? Can fiscal stimulus drive inflation higher and power the (still missing) value factor?
We cannot know the answer to these questions, but it is important to distinguish between the excitement of inflation breakevens rising and an expectation that higher inflation is imminent. It is equally important to distinguish between inflation as a driver of fundamentals and inflation as a driver of market performance.
Why are inflation breakevens rising? Because this “market derived” measure of inflation requires position financing. Inflation breakevens are created by the relationship between nominal and inflation-protected bonds (TIPS) of equivalent maturity. The “arbitrage” between the two is payment of a CPI-linked principal; financing this arbitrage requires going long TIPS and short the nominal while hedging out the more volatile components of CPI (largely energy). As a result, when financing or hedging costs rise (e.g., credit spreads widen or crude oil implied volatility rises), the spread between TIPS and nominals widens (ie breakevens collapse signaling “deflation”). When these costs retreat (as they have from March lows), breakevens rise. There is nothing in the market pricing that reflects an expectation that inflation will accelerate from here. In fact, the far more stable 5y5y (5y inflation breakevens, 5 years in the future) remains unexcitingly below 2%, suggesting skepticism that the Fed/Biden administration will be able to generate accelerating inflation.
This relationship also explains the perception that “Value” is positively associated with inflation. If we compare inflation breakevens to the Small Value/Large Growth ratio, there appears to be a robust relationship. However, this relationship is completely explained by spikes in volatility and the rising interest rates that accompany recoveries. When we control for interest rates and VIX spikes, there is no explanatory power for inflation breakevens and the Value/Growth relationship.
Inflation? Less Likely Than Is Believed and Unlikely to Change Market Drivers
It is worth briefly discussing the economic fundamentals of inflation. Inflation, a rise in the general price level, can have two sources – demand driven inflation and supply shortage inflation. Demand driven inflation is created when incremental demand emerges, and inelastic supply is incapable of meeting this demand on a short-term basis. In response, prices must rise to allocate the scarce quantity to those who most demand it. This was the driver of the 2002-2012 rise in commodity prices which rose to reflect demand from China and the emergence of institutional investor demand following the publication of Professor Gary Gorton’s “Facts and Fantasies About Commodity Futures”1. The inflation that appears to be developing today is supply driven as production disruptions associated with worker illness, shortages of critical supplies and labor actions have interrupted the flow of materials.
The difference in these two drivers matters for corporate profitability. A simple supply/demand illustration highlights the impact. A demand driven price increase results in a large increase in revenue as inelastic supply is forced to meet an outward shift in demand. In addition, the outward shift in aggregate demand for the end product (e.g., copper2) often creates additional demand for new production facilities. And the creation of these new production facilities (mines) in turn creates additional demand for labor and raw materials.
In contrast, a temporary inward shift in the supply curve results in only a modest increase in aggregate revenues and if there is a reasonable expectation of eventual return of the production facilities, there is very limited demand for new production facilities.
With supply almost always less elastic than demand, the shortages of product ripple through a general supply chain creating short-term disruptions that result in less fulfilled aggregate demand and lower aggregate corporate profits. This is not the outcome that might drive a sustainable commodity cycle or increase in inflation.
The second argument for inflation is that direct fiscal transfers to either households (in the form of transfer payments like Universal Basic Income) or the corporate sector via an infrastructure spending plan (Green New Deal, etc) will result in an outward shift in the demand curve. While this is certainly possible, it seems reasonable to hold our excitement. The recent stimulus has certainly created some forms of demand (e.g., recreational durable goods) to expand, this appears to have largely been a function of (1) services consumption substitution, (2) undeclared increases in household debt via unpaid rent and mortgages and (3) good old-fashioned errors in reporting. This last point is critical. We have data collection systems in the developed world that are not designed to handle the types of disruptions that occurred in 2020. One simple example is the misreporting of average hourly wages. When compared to the ECI indices which adjust for composition (remember those exciting debates from the jobless recovery days of 2012?), a very different picture emerges for 2020:
Finally, it is worth sharing one more chart. One of the biggest challenges in making forecasts for “stagflation” is a general misunderstanding of the stagflation from the 1960s and 1970s. It was not a negative real interest rate story. It was an outward shift in aggregate demand driven by extraordinary labor force growth tied to the Baby Boomers, women and minorities entering the labor force. This was exacerbated by the actions of the Fed which misinterpreted the rising prices as indicative of froth rather than a need for capital deepening and production increases. Raising interest rates did nothing to address the unique supply shocks that emerged for oil (which prior to 1974 accounted for roughly 1/3rd of US factory power supply) and food (as climate cooled and crop shortages emerged worldwide). What those interest rate hikes did do was dissuade factory owners from investing in additional supply. As a result, demand was serviced from outside the United States (think Hondas and Toyotas) and the US dollar fell against our trading partners. So far in the pandemic, this part of the story has certainly played out with US demand being met by Chinese supply (and of course the dollar has fallen against countries with which we have a trade deficit). While this will almost certainly lead to price increases, it is unlikely they will be sustained. To quote Alan Blinder’s under-cited analysis from 1982:
The dramatic acceleration of inflation between 1972 and 1974 can be traced mainly to three "shocks": rising food prices, rising energy prices, and the end of the Nixon wage-price controls program. Each of these can be conceptualized as requiring rapid adjustments of some relative prices. The equally dramatic deceleration of inflation between 1974 and 1976 can be traced to the simple fact that the three factors just named were not repeated. In other words, double-digit inflation went away "by itself." Blinder 19823
What is unlikely to repeat are the errors of Volcker hiking interest rates to a level that crushed domestic economic activity and, more importantly, the stunning growth in labor force that provided the base for the increase in aggregate demand.
Again, Blinder:
“The initial impetus for accelerating inflation in 1978 came mainly from the food sector, with some help from mortgage interest rates. The further acceleration into the double-digit range in 1979 mainly reflected soaring energy prices and, once again, rising mortgage rates. Finally, mortgage interest carried the ball almost by itself in early 1980.”
So while we may get supply chain disruption induced price increases, the most reasonable interpretation is that this will not be a sustained inflationary pressure. Prices of some goods will rise on a relative basis, but the aggregate demand picture does not remotely resemble the 1970s. More importantly, as the end of year shutdowns accelerate under mounting pressure from a combination of renewed Cov-19 outbreaks and seasonal illness patterns, it is difficult to expect the aggregate demand picture to remain supportive barring another round of aggressive stimulus.
Considering the above evidence, the key concern for market participants must be, “How does a short-term increase in prices due to supply disruptions meaningfully change the underlying dynamic of momentum-biased passive investing?” In Logica’s view, it does not.
End of Year Thanks
2020 has been a momentous year for Logica and we wanted to take a moment to say, “Thank you” to all our new investors and friends. We would never have guessed that the year would have contained as many “learning opportunities” as it has provided, and we are excited to put our additional insights to work in 2021. We could not do it without your support, and we cannot express enough our appreciation for the trust you place in us. Thank you.
Business Update - Logica Absolute Return Offhsore Fund
As previously discussed, Logica has launched the offshore version of the Logica Absolute Return Fund. We are thrilled to announce our first institutional relationships underpinning this launch and look forward to an increasingly favorable environment.
Notes:
- Gorton & Rouwenhorst, “Facts and Fantasies About Commodity Futures”, Jun 2004 https://papers.ssrn.com/sol3/papers.cfm?abstract_id=560042
- Copper supply disruptions https://www.bloomberg.com/news/articles/2020-07-09/peru-s-mining-ramp-up-taking-longer-than-expected-minister-says
- Blinder, “The Anatomy of Double-Digit Inflation in the 1970s”, 1982, https://www.nber.org/system/files/chapters/c11462/c11462.pdf
Logica Strategy Details
Note: We have comprehensive statistics and metrics available for our strategies, but only include a select few to highlight what we believe is our most valuable contribution to any larger portfolio.
- If you would like to learn more about our strategies, please reach out to Steven Greenblatt.
- If you would like to speak with Wayne or Mike on their views on Hedge Funds/Investing/Trading and trends they see shaping the industry, please contact Steven Greenblatt at greenblatt@logicafunds.com or 424-652-9520.
Follow Wayne on Twitter @WayneHimelsein
Follow Michael on Twitter @ProfPlum99
Logica Absolute Return
2015-2019 stats & grid, reconstitution of live sub-strategies
2005 to present growth of $1000 chart, simulation
Jan 2020 live with partner capital
Logica Tail Risk
2015-2019 stats & grid, reconstitution of live sub-strategies
2005 to present growth of $1000 chart, simulation
Jan 2020 live with partner capital
The post Logica Capital November 2020 Commentary: Get Shorty appeared first on ValueWalk.
International
Copper Soars, Iron Ore Tumbles As Goldman Says “Copper’s Time Is Now”
Copper Soars, Iron Ore Tumbles As Goldman Says "Copper’s Time Is Now"
After languishing for the past two years in a tight range despite recurring…
Share this:

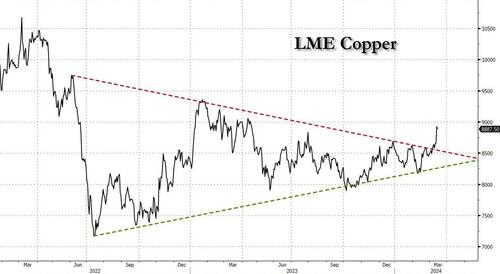
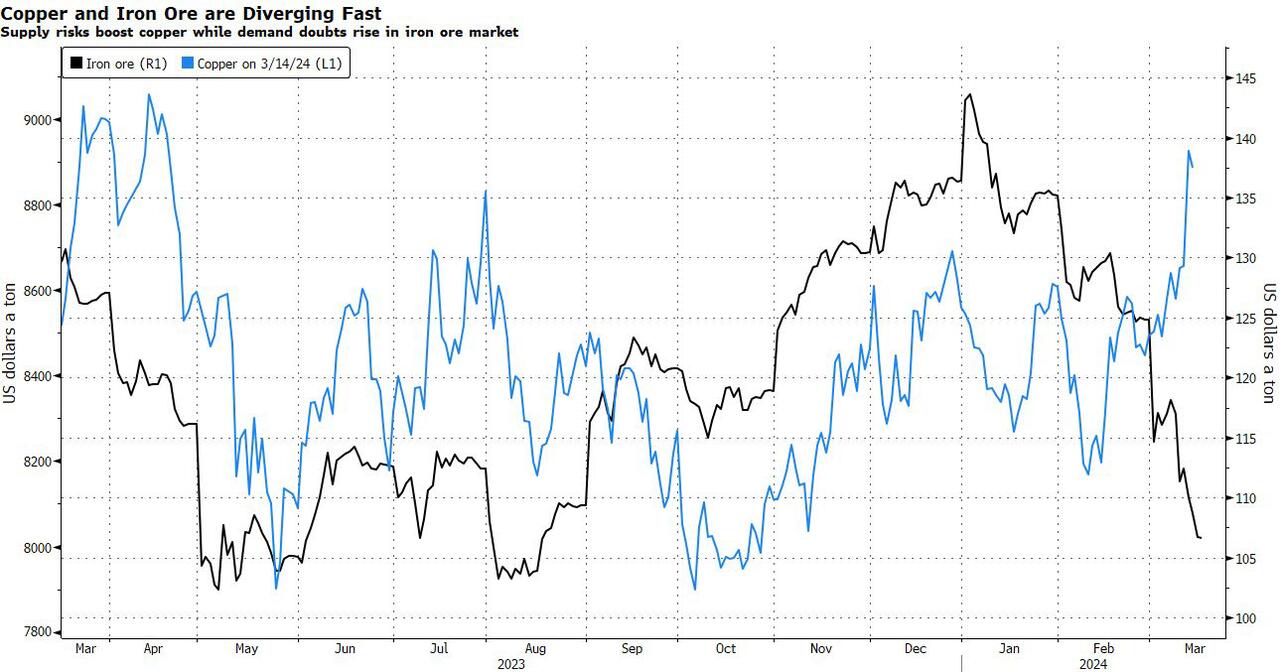
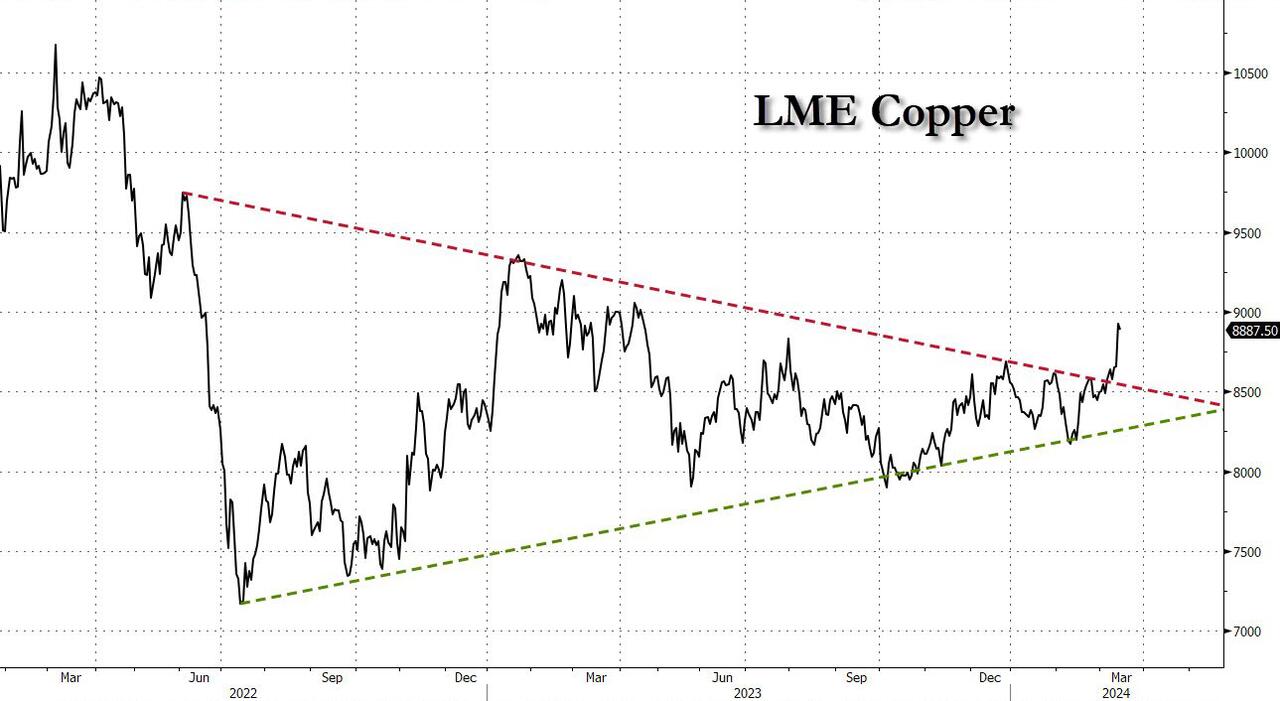
After languishing for the past two years in a tight range despite recurring speculation about declining global supply, copper has finally broken out, surging to the highest price in the past year, just shy of $9,000 a ton as supply cuts hit the market; At the same time the price of the world's "other" most important mined commodity has diverged, as iron ore has tumbled amid growing demand headwinds out of China's comatose housing sector where not even ghost cities are being built any more.
Copper surged almost 5% this week, ending a months-long spell of inertia, as investors focused on risks to supply at various global mines and smelters. As Bloomberg adds, traders also warmed to the idea that the worst of a global downturn is in the past, particularly for metals like copper that are increasingly used in electric vehicles and renewables.
Yet the commodity crash of recent years is hardly over, as signs of the headwinds in traditional industrial sectors are still all too obvious in the iron ore market, where futures fell below $100 a ton for the first time in seven months on Friday as investors bet that China’s years-long property crisis will run through 2024, keeping a lid on demand.
Indeed, while the mood surrounding copper has turned almost euphoric, sentiment on iron ore has soured since the conclusion of the latest National People’s Congress in Beijing, where the CCP set a 5% goal for economic growth, but offered few new measures that would boost infrastructure or other construction-intensive sectors.
As a result, the main steelmaking ingredient has shed more than 30% since early January as hopes of a meaningful revival in construction activity faded. Loss-making steel mills are buying less ore, and stockpiles are piling up at Chinese ports. The latest drop will embolden those who believe that the effects of President Xi Jinping’s property crackdown still have significant room to run, and that last year’s rally in iron ore may have been a false dawn.
Meanwhile, as Bloomberg notes, on Friday there were fresh signs that weakness in China’s industrial economy is hitting the copper market too, with stockpiles tracked by the Shanghai Futures Exchange surging to the highest level since the early days of the pandemic. The hope is that headwinds in traditional industrial areas will be offset by an ongoing surge in usage in electric vehicles and renewables.
And while industrial conditions in Europe and the US also look soft, there’s growing optimism about copper usage in India, where rising investment has helped fuel blowout growth rates of more than 8% — making it the fastest-growing major economy.
In any case, with the demand side of the equation still questionable, the main catalyst behind copper’s powerful rally is an unexpected tightening in global mine supplies, driven mainly by last year’s closure of a giant mine in Panama (discussed here), but there are also growing worries about output in Zambia, which is facing an El Niño-induced power crisis.
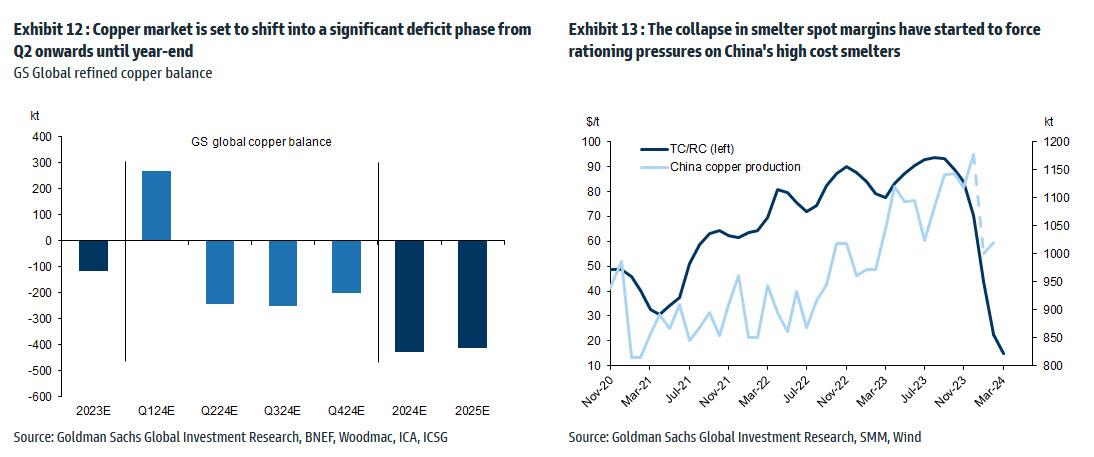
On Wednesday, copper prices jumped on huge volumes after smelters in China held a crisis meeting on how to cope with a sharp drop in processing fees following disruptions to supplies of mined ore. The group stopped short of coordinated production cuts, but pledged to re-arrange maintenance work, reduce runs and delay the startup of new projects. In the coming weeks investors will be watching Shanghai exchange inventories closely to gauge both the strength of demand and the extent of any capacity curtailments.
“The increase in SHFE stockpiles has been bigger than we’d anticipated, but we expect to see them coming down over the next few weeks,” Colin Hamilton, managing director for commodities research at BMO Capital Markets, said by phone. “If the pace of the inventory builds doesn’t start to slow, investors will start to question whether smelters are actually cutting and whether the impact of weak construction activity is starting to weigh more heavily on the market.”
* * *
Few have been as happy with the recent surge in copper prices as Goldman's commodity team, where copper has long been a preferred trade (even if it may have cost the former team head Jeff Currie his job due to his unbridled enthusiasm for copper in the past two years which saw many hedge fund clients suffer major losses).
As Goldman's Nicholas Snowdon writes in a note titled "Copper's time is now" (available to pro subscribers in the usual place)...

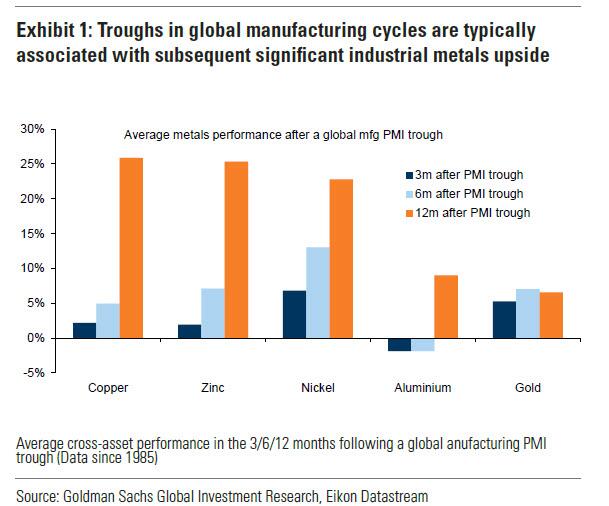
... there has been a "turn in the industrial cycle." Specifically according to the Goldman analyst, after a prolonged downturn, "incremental evidence now points to a bottoming out in the industrial cycle, with the global manufacturing PMI in expansion for the first time since September 2022." As a result, Goldman now expects copper to rise to $10,000/t by year-end and then $12,000/t by end of Q1-25.’
Here are the details:
Previous inflexions in global manufacturing cycles have been associated with subsequent sustained industrial metals upside, with copper and aluminium rising on average 25% and 9% over the next 12 months. Whilst seasonal surpluses have so far limited a tightening alignment at a micro level, we expect deficit inflexions to play out from quarter end, particularly for metals with severe supply binds. Supplemented by the influence of anticipated Fed easing ahead in a non-recessionary growth setting, another historically positive performance factor for metals, this should support further upside ahead with copper the headline act in this regard.
Goldman then turns to what it calls China's "green policy put":
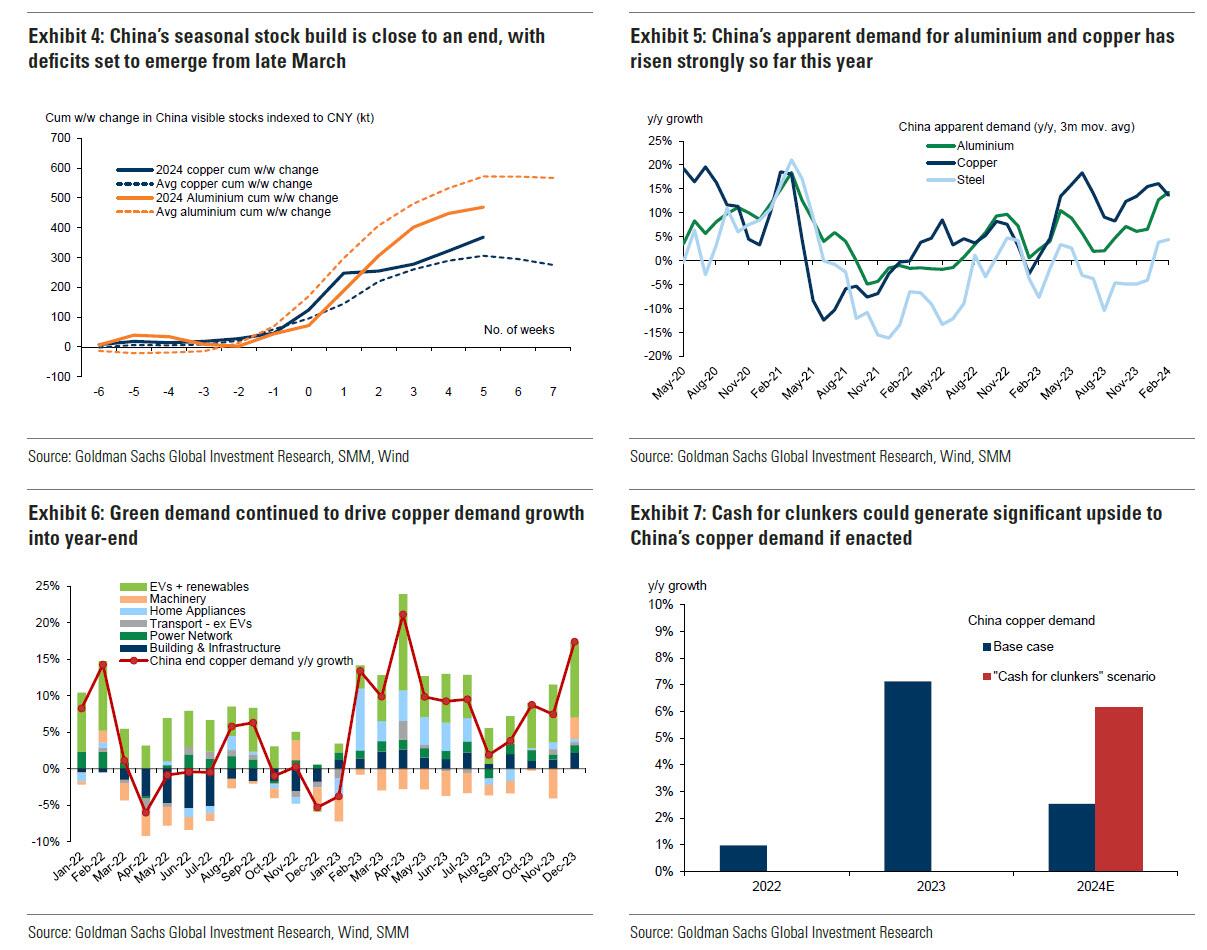
Much of the recent focus on the “Two Sessions” event centred on the lack of significant broad stimulus, and in particular the limited property support. In our view it would be wrong – just as in 2022 and 2023 – to assume that this will result in weak onshore metals demand. Beijing’s emphasis on rapid growth in the metals intensive green economy, as an offset to property declines, continues to act as a policy put for green metals demand. After last year’s strong trends, evidence year-to-date is again supportive with aluminium and copper apparent demand rising 17% and 12% y/y respectively. Moreover, the potential for a ‘cash for clunkers’ initiative could provide meaningful right tail risk to that healthy demand base case. Yet there are also clear metal losers in this divergent policy setting, with ongoing pressure on property related steel demand generating recent sharp iron ore downside.
Meanwhile, Snowdon believes that the driver behind Goldman's long-running bullish view on copper - a global supply shock - continues:
Copper’s supply shock progresses. The metal with most significant upside potential is copper, in our view. The supply shock which began with aggressive concentrate destocking and then sharp mine supply downgrades last year, has now advanced to an increasing bind on metal production, as reflected in this week's China smelter supply rationing signal. With continued positive momentum in China's copper demand, a healthy refined import trend should generate a substantial ex-China refined deficit this year. With LME stocks having halved from Q4 peak, China’s imminent seasonal demand inflection should accelerate a path into extreme tightness by H2. Structural supply underinvestment, best reflected in peak mine supply we expect next year, implies that demand destruction will need to be the persistent solver on scarcity, an effect requiring substantially higher pricing than current, in our view. In this context, we maintain our view that the copper price will surge into next year (GSe 2025 $15,000/t average), expecting copper to rise to $10,000/t by year-end and then $12,000/t by end of Q1-25’
Another reason why Goldman is doubling down on its bullish copper outlook: gold.
The sharp rally in gold price since the beginning of March has ended the period of consolidation that had been present since late December. Whilst the initial catalyst for the break higher came from a (gold) supportive turn in US data and real rates, the move has been significantly amplified by short term systematic buying, which suggests less sticky upside. In this context, we expect gold to consolidate for now, with our economists near term view on rates and the dollar suggesting limited near-term catalysts for further upside momentum. Yet, a substantive retracement lower will also likely be limited by resilience in physical buying channels. Nonetheless, in the midterm we continue to hold a constructive view on gold underpinned by persistent strength in EM demand as well as eventual Fed easing, which should crucially reactivate the largely for now dormant ETF buying channel. In this context, we increase our average gold price forecast for 2024 from $2,090/toz to $2,180/toz, targeting a move to $2,300/toz by year-end.
Much more in the full Goldman note available to pro subs.
International
The millions of people not looking for work in the UK may be prioritising education, health and freedom
Economic inactivity is not always the worst option.
Share this:


Around one in five British people of working age (16-64) are now outside the labour market. Neither in work nor looking for work, they are officially labelled as “economically inactive”.
Some of those 9.2 million people are in education, with many students not active in the labour market because they are studying full-time. Others are older workers who have chosen to take early retirement.
But that still leaves a large number who are not part of the labour market because they are unable to work. And one key driver of economic inactivity in recent years has been illness.
This increase in economic inactivity – which has grown since before the pandemic – is not just harming the economy, but also indicative of a deeper health crisis.
For those suffering ill health, there are real constraints on access to work. People with health-limiting conditions cannot just slot into jobs that are available. They need help to address the illnesses they have, and to re-engage with work through organisations offering supportive and healthy work environments.
And for other groups, such as stay-at-home parents, businesses need to offer flexible work arrangements and subsidised childcare to support the transition from economic inactivity into work.
The government has a role to play too. Most obviously, it could increase investment in the NHS. Rising levels of poor health are linked to years of under-investment in the health sector and economic inactivity will not be tackled without more funding.
Carrots and sticks
For the time being though, the UK government appears to prefer an approach which mixes carrots and sticks. In the March 2024 budget, for example, the chancellor cut national insurance by 2p as a way of “making work pay”.
But it is unclear whether small tax changes like this will have any effect on attracting the economically inactive back into work.
Jeremy Hunt also extended free childcare. But again, questions remain over whether this is sufficient to remove barriers to work for those with parental responsibilities. The high cost and lack of availability of childcare remain key weaknesses in the UK economy.
The benefit system meanwhile has been designed to push people into work. Benefits in the UK remain relatively ungenerous and hard to access compared with other rich countries. But labour shortages won’t be solved by simply forcing the economically inactive into work, because not all of them are ready or able to comply.
It is also worth noting that work itself may be a cause of bad health. The notion of “bad work” – work that does not pay enough and is unrewarding in other ways – can lead to economic inactivity.
There is also evidence that as work has become more intensive over recent decades, for some people, work itself has become a health risk.
The pandemic showed us how certain groups of workers (including so-called “essential workers”) suffered more ill health due to their greater exposure to COVID. But there are broader trends towards lower quality work that predate the pandemic, and these trends suggest improving job quality is an important step towards tackling the underlying causes of economic inactivity.
Freedom
Another big section of the economically active population who cannot be ignored are those who have retired early and deliberately left the labour market behind. These are people who want and value – and crucially, can afford – a life without work.
Here, the effects of the pandemic can be seen again. During those years of lockdowns, furlough and remote working, many of us reassessed our relationship with our jobs. Changed attitudes towards work among some (mostly older) workers can explain why they are no longer in the labour market and why they may be unresponsive to job offers of any kind.

And maybe it is from this viewpoint that we should ultimately be looking at economic inactivity – that it is actually a sign of progress. That it represents a move towards freedom from the drudgery of work and the ability of some people to live as they wish.
There are utopian visions of the future, for example, which suggest that individual and collective freedom could be dramatically increased by paying people a universal basic income.
In the meantime, for plenty of working age people, economic inactivity is a direct result of ill health and sickness. So it may be that the levels of economic inactivity right now merely show how far we are from being a society which actually supports its citizens’ wellbeing.
David Spencer has received funding from the ESRC.
uk pandemicInternational
Illegal Immigrants Leave US Hospitals With Billions In Unpaid Bills
Illegal Immigrants Leave US Hospitals With Billions In Unpaid Bills
By Autumn Spredemann of The Epoch Times
Tens of thousands of illegal…
Share this:


By Autumn Spredemann of The Epoch Times
Tens of thousands of illegal immigrants are flooding into U.S. hospitals for treatment and leaving billions in uncompensated health care costs in their wake.
The House Committee on Homeland Security recently released a report illustrating that from the estimated $451 billion in annual costs stemming from the U.S. border crisis, a significant portion is going to health care for illegal immigrants.
With the majority of the illegal immigrant population lacking any kind of medical insurance, hospitals and government welfare programs such as Medicaid are feeling the weight of these unanticipated costs.
Apprehensions of illegal immigrants at the U.S. border have jumped 48 percent since the record in fiscal year 2021 and nearly tripled since fiscal year 2019, according to Customs and Border Protection data.
Last year broke a new record high for illegal border crossings, surpassing more than 3.2 million apprehensions.
And with that sea of humanity comes the need for health care and, in most cases, the inability to pay for it.
In January, CEO of Denver Health Donna Lynne told reporters that 8,000 illegal immigrants made roughly 20,000 visits to the city’s health system in 2023.
The total bill for uncompensated care costs last year to the system totaled $140 million, said Dane Roper, public information officer for Denver Health. More than $10 million of it was attributed to “care for new immigrants,” he told The Epoch Times.
Though the amount of debt assigned to illegal immigrants is a fraction of the total, uncompensated care costs in the Denver Health system have risen dramatically over the past few years.
The total uncompensated costs in 2020 came to $60 million, Mr. Roper said. In 2022, the number doubled, hitting $120 million.
He also said their city hospitals are treating issues such as “respiratory illnesses, GI [gastro-intenstinal] illnesses, dental disease, and some common chronic illnesses such as asthma and diabetes.”
“The perspective we’ve been trying to emphasize all along is that providing healthcare services for an influx of new immigrants who are unable to pay for their care is adding additional strain to an already significant uncompensated care burden,” Mr. Roper said.
He added this is why a local, state, and federal response to the needs of the new illegal immigrant population is “so important.”
Colorado is far from the only state struggling with a trail of unpaid hospital bills.

Dr. Robert Trenschel, CEO of the Yuma Regional Medical Center situated on the Arizona–Mexico border, said on average, illegal immigrants cost up to three times more in human resources to resolve their cases and provide a safe discharge.
“Some [illegal] migrants come with minor ailments, but many of them come in with significant disease,” Dr. Trenschel said during a congressional hearing last year.
“We’ve had migrant patients on dialysis, cardiac catheterization, and in need of heart surgery. Many are very sick.”
He said many illegal immigrants who enter the country and need medical assistance end up staying in the ICU ward for 60 days or more.
A large portion of the patients are pregnant women who’ve had little to no prenatal treatment. This has resulted in an increase in babies being born that require neonatal care for 30 days or longer.
Dr. Trenschel told The Epoch Times last year that illegal immigrants were overrunning healthcare services in his town, leaving the hospital with $26 million in unpaid medical bills in just 12 months.
ER Duty to Care
The Emergency Medical Treatment and Labor Act of 1986 requires that public hospitals participating in Medicare “must medically screen all persons seeking emergency care … regardless of payment method or insurance status.”
The numbers are difficult to gauge as the policy position of the Centers for Medicare & Medicaid Services (CMS) is that it “will not require hospital staff to ask patients directly about their citizenship or immigration status.”
In southern California, again close to the border with Mexico, some hospitals are struggling with an influx of illegal immigrants.
American patients are enduring longer wait times for doctor appointments due to a nursing shortage in the state, two health care professionals told The Epoch Times in January.
A health care worker at a hospital in Southern California, who asked not to be named for fear of losing her job, told The Epoch Times that “the entire health care system is just being bombarded” by a steady stream of illegal immigrants.
“Our healthcare system is so overwhelmed, and then add on top of that tuberculosis, COVID-19, and other diseases from all over the world,” she said.

A newly-enacted law in California provides free healthcare for all illegal immigrants residing in the state. The law could cost taxpayers between $3 billion and $6 billion per year, according to recent estimates by state and federal lawmakers.
In New York, where the illegal immigration crisis has manifested most notably beyond the southern border, city and state officials have long been accommodating of illegal immigrants’ healthcare costs.
Since June 2014, when then-mayor Bill de Blasio set up The Task Force on Immigrant Health Care Access, New York City has worked to expand avenues for illegal immigrants to get free health care.
“New York City has a moral duty to ensure that all its residents have meaningful access to needed health care, regardless of their immigration status or ability to pay,” Mr. de Blasio stated in a 2015 report.
The report notes that in 2013, nearly 64 percent of illegal immigrants were uninsured. Since then, tens of thousands of illegal immigrants have settled in the city.
“The uninsured rate for undocumented immigrants is more than three times that of other noncitizens in New York City (20 percent) and more than six times greater than the uninsured rate for the rest of the city (10 percent),” the report states.
The report states that because healthcare providers don’t ask patients about documentation status, the task force lacks “data specific to undocumented patients.”
Some health care providers say a big part of the issue is that without a clear path to insurance or payment for non-emergency services, illegal immigrants are going to the hospital due to a lack of options.
“It’s insane, and it has been for years at this point,” Dana, a Texas emergency room nurse who asked to have her full name omitted, told The Epoch Times.
Working for a major hospital system in the greater Houston area, Dana has seen “a zillion” migrants pass through under her watch with “no end in sight.” She said many who are illegal immigrants arrive with treatable illnesses that require simple antibiotics. “Not a lot of GPs [general practitioners] will see you if you can’t pay and don’t have insurance.”
She said the “undocumented crowd” tends to arrive with a lot of the same conditions. Many find their way to Houston not long after crossing the southern border. Some of the common health issues Dana encounters include dehydration, unhealed fractures, respiratory illnesses, stomach ailments, and pregnancy-related concerns.
“This isn’t a new problem, it’s just worse now,” Dana said.

Medicaid Factor
One of the main government healthcare resources illegal immigrants use is Medicaid.
All those who don’t qualify for regular Medicaid are eligible for Emergency Medicaid, regardless of immigration status. By doing this, the program helps pay for the cost of uncompensated care bills at qualifying hospitals.
However, some loopholes allow access to the regular Medicaid benefits. “Qualified noncitizens” who haven’t been granted legal status within five years still qualify if they’re listed as a refugee, an asylum seeker, or a Cuban or Haitian national.
Yet the lion’s share of Medicaid usage by illegal immigrants still comes through state-level benefits and emergency medical treatment.
A Congressional report highlighted data from the CMS, which showed total Medicaid costs for “emergency services for undocumented aliens” in fiscal year 2021 surpassed $7 billion, and totaled more than $5 billion in fiscal 2022.
Both years represent a significant spike from the $3 billion in fiscal 2020.
An employee working with Medicaid who asked to be referred to only as Jennifer out of concern for her job, told The Epoch Times that at a state level, it’s easy for an illegal immigrant to access the program benefits.
Jennifer said that when exceptions are sent from states to CMS for approval, “denial is actually super rare. It’s usually always approved.”
She also said it comes as no surprise that many of the states with the highest amount of Medicaid spending are sanctuary states, which tend to have policies and laws that shield illegal immigrants from federal immigration authorities.
Moreover, Jennifer said there are ways for states to get around CMS guidelines. “It’s not easy, but it can and has been done.”
The first generation of illegal immigrants who arrive to the United States tend to be healthy enough to pass any pre-screenings, but Jennifer has observed that the subsequent generations tend to be sicker and require more access to care. If a family is illegally present, they tend to use Emergency Medicaid or nothing at all.
The Epoch Times asked Medicaid Services to provide the most recent data for the total uncompensated care that hospitals have reported. The agency didn’t respond.
Continue reading over at The Epoch Times


Net Zero, The Digital Panopticon, & The Future Of Food


Illegal Immigrants Leave US Hospitals With Billions In Unpaid Bills


Problems After COVID-19 Vaccination More Prevalent Among Naturally Immune: Study


For-profit nursing homes are cutting corners on safety and draining resources with financial shenanigans − especially at midsize chains that dodge public scrutiny


Looking Back At COVID’s Authoritarian Regimes


Trump nearly derailed democracy once − here’s what to watch out for in reelection campaign


‘Excess Mortality Skyrocketed’: Tucker Carlson and Dr. Pierre Kory Unpack ‘Criminal’ COVID Response


Health Officials: Man Dies From Bubonic Plague In New Mexico


Five Aerospace Investments to Buy as Wars Worsen Copy


MIPIM 2024 Reflects Mixed Feelings on CRE Recovery
-

 Uncategorized3 weeks ago
All Of The Elements Are In Place For An Economic Crisis Of Staggering Proportions
-

 International1 week ago
EyePoint poaches medical chief from Apellis; Sandoz CFO, longtime BioNTech exec to retire
-

 Uncategorized4 weeks ago
California Counties Could Be Forced To Pay $300 Million To Cover COVID-Era Program
-

 Uncategorized3 weeks ago
Apparel Retailer Express Moving Toward Bankruptcy
-

 Uncategorized4 weeks ago
Industrial Production Decreased 0.1% in January
-

 International1 week ago
Walmart launches clever answer to Target’s new membership program
-

 Spread & Containment2 days ago
IFM’s Hat Trick and Reflections On Option-To-Buy M&A
-

 Uncategorized4 weeks ago
RFK Jr: The Wuhan Cover-Up & The Rise Of The Biowarfare-Industrial Complex