LENDINGTREE REPORTS FOURTH QUARTER 2021 RESULTS
Outlook suggests strength in high margin Consumer segment and demonstrated recovery in Insurance
Share this:


LENDINGTREE REPORTS FOURTH QUARTER 2021 RESULTS
Outlook suggests strength in high margin Consumer segment and demonstrated recovery in Insurance
- Consolidated revenue of $258.3 million
- GAAP net income from continuing operations of $48.4 million or $3.57 per diluted share
- Variable marketing margin of $88.5 million
- Adjusted EBITDA of $24.7 million
- Adjusted net loss per share of $(0.14)
PR Newswire
CHARLOTTE, N.C., Feb. 25, 2022
CHARLOTTE, N.C., Feb. 25, 2022 /PRNewswire/ -- LendingTree, Inc. (NASDAQ: TREE), operator of LendingTree.com, the nation's leading online financial services marketplace, today announced results for the quarter ended December 31, 2021.
The Company has posted a letter to shareholders on its investor relations website at investors.lendingtree.com.
"As a company, we are galvanized around the strategy we shared with you recently at our Investor Day," said Doug Lebda, Chairman and CEO. "We know that connecting LendingTree's industry-leading brand and deep partner network with an unparalleled customer experience will enable us to accelerate revenue and margin growth while making a meaningful difference in the financial lives of our customers. We're already making substantive progress in designing and testing new experiences with complementary breakthrough marketing campaigns, and we look forward to sharing the results with you as we progress through the year."
Trent Ziegler, CFO, added, "We are pleased to affirm the fourth-quarter and full-year 2021 results we shared preliminarily at our Investor Day earlier this month, and reaffirm our previously released 2022 annual guidance. The Home and Consumer segments continue to perform well, helping offset headwinds in our Insurance business that we see as temporary. Our capital structure and balance sheet afford us flexibility we have not had since before the onset of the pandemic and allowed us to restart our share repurchase during the quarter. Given the rapidly changing landscape across our industry, we are prepared to capitalize on evolving opportunities."
Fourth Quarter 2021 Business Highlights
- Home segment revenue of $96.3 million grew 8% over fourth quarter 2020 and produced segment profit of $33.8 million, up 5% over the same period.
- Within Home, mortgage products revenue of $79.6 million declined 2% over the prior year period.
- Consumer segment revenue of $96.4 million grew 102% over fourth quarter 2020 as the segment continues to rebound.
- Within Consumer, credit card revenue of $26.4 million was up 122% year-over-year.
- Personal loans revenue of $36.2 million improved from $33.8 million in third quarter 2021.
- Revenue from our small business offering grew 13% sequentially from the third quarter 2021.
- Insurance segment revenue of $65.4 million declined 24% over fourth quarter 2020 and translated into segment profit of $20.8 million, down 38% over the same period.
- Through December 31, 2021, 21.0 million consumers have signed up for MyLendingTree.
LendingTree Summary Financial Metrics | |||||||||||||||
(In millions, except per share amounts) | |||||||||||||||
Three Months Ended | Y/Y | Three Months Ended | Q/Q | ||||||||||||
2021 | 2020 | % Change | 2021 | % Change | |||||||||||
Total revenue | $ | 258.3 | $ | 222.3 | 16% | $ | 297.4 | (13)% | |||||||
Income (loss) before income taxes | $ | 60.2 | $ | (13.2) | 556% | (4.4) | 1468% | ||||||||
Income tax (expense) benefit | (11.8) | 5.1 | (331)% | — | —% | ||||||||||
Net income (loss) from continuing operations | $ | 48.4 | $ | (8.1) | 698 % | $ | (4.4) | 1200% | |||||||
Net income (loss) from continuing operations % of revenue | 19% | (4)% | (1)% | ||||||||||||
Income (loss) per share from continuing operations | |||||||||||||||
Basic | $ | 3.67 | $ | (0.62) | 692% | $ | (0.33) | 1212% | |||||||
Diluted | $ | 3.57 | $ | (0.62) | 676% | $ | (0.33) | 1182% | |||||||
Variable marketing margin | |||||||||||||||
Total revenue | $ | 258.3 | $ | 222.3 | 16% | $ | 297.4 | (13)% | |||||||
Variable marketing expense (1) (2) | $ | (169.8) | $ | (140.0) | 21% | $ | (191.5) | (11)% | |||||||
Variable marketing margin (2) | $ | 88.5 | $ | 82.3 | 8% | $ | 105.9 | (16)% | |||||||
Variable marketing margin % of revenue (2) | 34% | 37% | 36% | ||||||||||||
Adjusted EBITDA (2) | $ | 24.7 | $ | 26.3 | (6)% | $ | 41.0 | (40)% | |||||||
Adjusted EBITDA % of revenue (2) | 10% | 12% | 14% | ||||||||||||
Adjusted net (loss) income (2) | $ | (1.8) | $ | 1.8 | (200)% | $ | 10.3 | (117)% | |||||||
Adjusted net (loss) income per share (2) | $ | (0.14) | $ | 0.13 | (208)% | $ | 0.75 | (119)% | |||||||
(1) | Represents the portion of selling and marketing expense attributable to variable costs paid for advertising, direct marketing and related expenses. Excludes overhead, fixed costs and personnel-related expenses. |
(2) | Variable marketing expense, variable marketing margin, variable marketing margin % of revenue, adjusted EBITDA, adjusted EBITDA % of revenue, adjusted net income and adjusted net income per share are non-GAAP measures. Please see "LendingTree's Reconciliation of Non-GAAP Measures to GAAP" and "LendingTree's Principles of Financial Reporting" below for more information. |
LendingTree Segment Results | |||||||||||
(In millions) | |||||||||||
Three Months Ended | Y/Y | Three Months Ended | Q/Q | ||||||||
2021 | 2020 | % Change | 2021 | % Change | |||||||
Home (1) | |||||||||||
Revenue | $ 96.3 | $ 88.8 | 8% | $ 112.4 | (14)% | ||||||
Segment profit | $ 33.8 | $ 32.3 | 5% | $ 41.5 | (19)% | ||||||
Segment profit % of revenue | 35% | 36% | 37% | ||||||||
Consumer (2) | |||||||||||
Revenue | $ 96.4 | $ 47.8 | 102% | $ 100.0 | (4)% | ||||||
Segment profit | $ 40.8 | $ 22.7 | 80% | $ 44.7 | (9)% | ||||||
Segment profit % of revenue | 42% | 47% | 45% | ||||||||
Insurance (3) | |||||||||||
Revenue | $ 65.4 | $ 85.6 | (24)% | $ 84.8 | (23)% | ||||||
Segment profit | $ 20.8 | $ 33.4 | (38)% | $ 26.6 | (22)% | ||||||
Segment profit % of revenue | 32% | 39% | 31% | ||||||||
Other (4) | |||||||||||
Revenue | $ 0.2 | $ 0.1 | 100% | $ 0.2 | —% | ||||||
Profit | $ 0.1 | $ (0.4) | 125% | $ 0.1 | —% | ||||||
Total revenue | $ 258.3 | $ 222.3 | 16% | $ 297.4 | (13)% | ||||||
Total segment profit | $ 95.5 | $ 88.0 | 9% | $ 112.9 | (15)% | ||||||
Brand marketing expense (5) | $ (7.0) | $ (5.7) | 23% | $ (7.0) | —% | ||||||
Variable marketing margin | $ 88.5 | $ 82.3 | 8% | $ 105.9 | (16)% | ||||||
Variable marketing margin % of revenue | 34% | 37% | 36% | ||||||||
(1) | The Home segment includes the following products: purchase mortgage, refinance mortgage, home equity loans, reverse mortgage loans, and real estate. |
(2) | The Consumer segment includes the following products: credit cards, personal loans, small business loans, student loans, auto loans, deposit accounts, and other credit products such as credit repair and debt settlement. |
(3) | The Insurance segment consists of insurance quote products. |
(4) | The Other category includes marketing revenue and related expenses not allocated to a specific segment. |
(5) | Brand marketing expense represents the portion of selling and marketing expense attributable to variable costs paid for advertising, direct marketing and related expenses that are not assignable to the segments' products. This measure excludes overhead, fixed costs and personnel-related expenses. |
Business Outlook - 2022
Today, the Company is providing revenue, variable marketing margin and adjusted EBITDA guidance for the first quarter of 2022 and maintaining guidance for full-year 2022, as follows:
For first-quarter 2022:
- Revenue: $280 - $290 million
- Variable Marketing Margin: $90 - $97 million
- Adjusted EBITDA: $26 - $31 million
For full-year 2022:
- Revenue is anticipated to be in the range of $1,200 - $1,250 million, representing growth of 9% - 14% over full-year 2021 results.
- Variable Marketing Margin is expected to be in the range of $445 - $475 million.
- Adjusted EBITDA is anticipated to be in the range of $160 - $180 million, up 19% - 34% over full-year 2021 results.
LendingTree is not able to provide a reconciliation of projected variable marketing margin or adjusted EBITDA to the most directly comparable expected GAAP results due to the unknown effect, timing and potential significance of the effects of legal matters and tax considerations. Expenses associated with legal matters and tax consequences have in the past, and may in the future, significantly affect GAAP results in a particular period.
Quarterly Conference Call
A conference call to discuss LendingTree's fourth-quarter 2021 financial results will be webcast live today, February 25, 2022 at 9:00 AM Eastern Time (ET). The live audiocast is open to the public and will be available on LendingTree's investor relations website at investors.lendingtree.com. The call may also be accessed toll-free via phone at (877) 606-1416. Callers outside the United States and Canada may dial (707) 287-9313. Following completion of the call, a recorded replay of the webcast will be available on LendingTree's investor relations website until 12:00 PM ET on Saturday, March 05, 2022. To listen to the telephone replay, call toll-free (855) 859-2056 with passcode #1665618. Callers outside the United States and Canada may dial (404) 537-3406 with passcode #1665618.
LENDINGTREE, INC. AND SUBSIDIARIES | |||||||
Three Months Ended December 31, | Twelve Months Ended December 31, | ||||||
2021 | 2020 | 2021 | 2020 | ||||
(in thousands, except per share amounts) | |||||||
Revenue | $ 258,285 | $ 222,329 | $ 1,098,499 | $ 909,990 | |||
Costs and expenses: | |||||||
Cost of revenue (exclusive of depreciation and amortization shown separately below) (1) | 14,448 | 13,558 | 57,297 | 54,494 | |||
Selling and marketing expense (1) | 184,847 | 153,275 | 773,990 | 617,404 | |||
General and administrative expense (1) | 38,546 | 34,825 | 153,472 | 129,101 | |||
Product development (1) | 13,723 | 10,384 | 52,865 | 43,636 | |||
Depreciation | 4,941 | 3,738 | 17,910 | 14,201 | |||
Amortization of intangibles | 9,771 | 12,475 | 42,738 | 53,078 | |||
Change in fair value of contingent consideration | — | (2,384) | (8,249) | 5,327 | |||
Severance | 6 | 105 | 53 | 295 | |||
Litigation settlements and contingencies | 32 | 40 | 392 | (943) | |||
Total costs and expenses | 266,314 | 226,016 | 1,090,468 | 916,593 | |||
Operating (loss) income | (8,029) | (3,687) | 8,031 | (6,603) | |||
Other (expense) income, net: | |||||||
Interest expense, net | (14,986) | (9,894) | (46,867) | (36,300) | |||
Other income | 83,200 | 369 | 123,272 | 376 | |||
Income (loss) before income taxes | 60,185 | (13,212) | 84,436 | (42,527) | |||
Income tax (expense) benefit | (11,753) | 5,095 | (11,298) | 19,961 | |||
Net income (loss) from continuing operations | 48,432 | (8,117) | 73,138 | (22,566) | |||
Loss from discontinued operations, net of tax | (507) | (139) | (4,023) | (25,689) | |||
Net income (loss) and comprehensive income (loss) | $ 47,925 | $ (8,256) | $ 69,115 | $ (48,255) | |||
Weighted average shares outstanding: | |||||||
Basic | 13,212 | 13,051 | 13,199 | 13,007 | |||
Diluted | 13,558 | 13,051 | 13,695 | 13,007 | |||
Income (loss) per share from continuing operations: | |||||||
Basic | $ 3.67 | $ (0.62) | $ 5.54 | $ (1.73) | |||
Diluted | $ 3.57 | $ (0.62) | $ 5.34 | $ (1.73) | |||
Loss per share from discontinued operations: | |||||||
Basic | $ (0.04) | $ (0.01) | $ (0.30) | $ (1.98) | |||
Diluted | $ (0.04) | $ (0.01) | $ (0.29) | $ (1.98) | |||
Net income (loss) per share: | |||||||
Basic | $ 3.63 | $ (0.63) | $ 5.24 | $ (3.71) | |||
Diluted | $ 3.53 | $ (0.63) | $ 5.05 | $ (3.71) | |||
(1) Amounts include non-cash compensation, as follows: | |||||||
Cost of revenue | $ 408 | $ 372 | $ 1,639 | $ 1,319 | |||
Selling and marketing expense | 1,897 | 1,809 | 7,480 | 6,240 | |||
General and administrative expense | 12,331 | 10,442 | 50,989 | 39,650 | |||
Product development | 2,115 | 1,874 | 8,447 | 6,524 | |||
LENDINGTREE, INC. AND SUBSIDIARIES | |||
December 31, | December 31, | ||
(in thousands, except par value and share amounts) | |||
ASSETS: | |||
Cash and cash equivalents | $ 251,231 | $ 169,932 | |
Restricted cash and cash equivalents | 111 | 117 | |
Accounts receivable, net | 97,658 | 89,841 | |
Prepaid and other current assets | 25,379 | 27,949 | |
Current assets of discontinued operations | — | 8,570 | |
Total current assets | 374,379 | 296,409 | |
Property and equipment, net | 72,477 | 62,381 | |
Operating lease right-of-use assets | 77,346 | 84,109 | |
Goodwill | 420,139 | 420,139 | |
Intangible assets, net | 85,763 | 128,502 | |
Deferred income tax assets | 87,581 | 96,224 | |
Equity investment | 158,140 | 80,000 | |
Other non-current assets | 6,942 | 5,334 | |
Non-current assets of discontinued operations | 16,589 | 15,892 | |
Total assets | $ 1,299,356 | $ 1,188,990 | |
LIABILITIES: | |||
Current portion of long-term debt | $ 166,008 | $ — | |
Accounts payable, trade | 1,692 | 10,111 | |
Accrued expenses and other current liabilities | 106,731 | 101,196 | |
Current liabilities of discontinued operations | 1 | 536 | |
Total current liabilities | 274,432 | 111,843 | |
Long-term debt | 478,151 | 611,412 | |
Operating lease liabilities | 96,165 | 92,363 | |
Non-current contingent consideration | — | 8,249 | |
Deferred income tax liabilities | 2,265 | — | |
Other non-current liabilities | 351 | 362 | |
Total liabilities | 851,364 | 824,229 | |
SHAREHOLDERS' EQUITY: | |||
Preferred stock $.01 par value; 5,000,000 shares authorized; none issued or outstanding | — | — | |
Common stock $.01 par value; 50,000,000 shares authorized; 16,070,720 and 15,766,193 shares issued, respectively, and 13,095,149 and 13,124,875 shares outstanding, respectively | 161 | 158 | |
Additional paid-in capital | 1,242,794 | 1,188,673 | |
Accumulated deficit | (571,794) | (640,909) | |
Treasury stock; 2,975,571 and 2,641,318 shares, respectively | (223,169) | (183,161) | |
Total shareholders' equity | 447,992 | 364,761 | |
Total liabilities and shareholders' equity | $ 1,299,356 | $ 1,188,990 | |
LENDINGTREE, INC. AND SUBSIDIARIES | |||
Year Ended December 31, | |||
2021 | 2020 | 2019 | |
(in thousands) | |||
Cash flows from operating activities attributable to continuing operations: | |||
Net income (loss) and comprehensive income (loss) | $ 69,115 | $ (48,255) | $ 17,828 |
Less: Loss from discontinued operations, net of tax | 4,023 | 25,689 | 21,632 |
Income (loss) from continuing operations | 73,138 | (22,566) | 39,460 |
Adjustments to reconcile income from continuing operations to net cash provided by operating activities attributable to continuing operations: | |||
Loss (gain) on impairments and disposal of assets | 3,465 | 1,160 | (695) |
Amortization of intangibles | 42,738 | 53,078 | 55,241 |
Depreciation | 17,910 | 14,201 | 10,998 |
Non-cash compensation expense | 68,555 | 53,733 | 52,167 |
Deferred income taxes | 10,908 | (9,628) | (8,555) |
Change in fair value of contingent consideration | (8,249) | 5,327 | 28,402 |
Gain on investments | (123,272) | — | — |
Bad debt expense | 2,472 | 1,785 | 1,697 |
Amortization of debt issuance costs | 5,992 | 3,474 | 1,974 |
Write-off of previously-capitalized debt issuance costs | 1,066 | — | 333 |
Amortization of debt discount | 30,695 | 19,570 | 12,016 |
Loss on extinguishment of debt | — | 7,768 | — |
Reduction in carrying amount of ROU asset, offset by change in operating lease liabilities | 12,807 | 8,888 | 213 |
Changes in current assets and liabilities: | |||
Accounts receivable | (10,289) | 21,861 | (22,457) |
Prepaid and other current assets | (4,902) | (952) | (3,258) |
Accounts payable, accrued expenses and other current liabilities | (1,537) | (8,013) | (2,322) |
Current contingent consideration | — | (25,787) | (12,500) |
Income taxes receivable | 10,680 | (10,598) | 4,548 |
Other, net | (921) | (2,002) | (88) |
Net cash provided by operating activities attributable to continuing operations | 131,256 | 111,299 | 157,174 |
Cash flows from investing activities attributable to continuing operations: | |||
Capital expenditures | (35,065) | (42,149) | (20,041) |
Proceeds from the sale of fixed assets | — | — | 24,077 |
Purchase of equity investment | (1,180) | (80,000) | — |
Proceeds from the sale of equity investment | 46,312 | — | — |
Acquisition of ValuePenguin, net of cash acquired | — | — | (105,578) |
Acquisition of QuoteWizard, net of cash acquired | — | — | 482 |
Net cash provided by (used in) investing activities attributable to continuing operations | 10,067 | (122,149) | (101,060) |
Cash flows from financing activities attributable to continuing operations: | |||
Payments related to net-share settlement of stock-based compensation, net of proceeds from exercise of stock options | (14,423) | (3,910) | (8,406) |
Purchase of treasury stock | (40,008) | — | (5,470) |
Proceeds from the issuance of 0.50% Convertible Senior Notes | — | 575,000 | — |
Repurchase of 0.625% Convertible Senior Notes | — | (233,862) | — |
Payment of convertible note hedge on the 0.50% Convertible Senior Notes | — | (124,200) | — |
Termination of convertible note hedge on the 0.625% Convertible Senior Notes | — | 109,881 | — |
Proceeds from the sale of warrants related to the 0.50% Convertible Senior Notes | — | 61,180 | — |
Termination of warrants related to the 0.625% Convertible Senior Notes | — | (94,292) | — |
Net repayment of revolving credit facility | — | (75,000) | (50,000) |
Payment of debt issuance costs | (6,385) | (16,568) | (2,518) |
Payment of original issue discount on undrawn term loan | (2,500) | — | — |
Contingent consideration payments | — | (4,755) | (21,275) |
Other financing activities | (31) | (184) | (9) |
Net cash (used in) provided by financing activities attributable to continuing operations | (63,347) | 193,290 | (87,678) |
Total cash provided by (used in) continuing operations | 77,976 | 182,440 | (31,564) |
Discontinued operations: | |||
Net cash provided by (used in) operating activities attributable to discontinued operations | 3,317 | (72,730) | (13,255) |
Total cash provided by (used in) discontinued operations | 3,317 | (72,730) | (13,255) |
Net increase (decrease) in cash, cash equivalents, restricted cash, and restricted cash equivalents | 81,293 | 109,710 | (44,819) |
Cash, cash equivalents, restricted cash, and restricted cash equivalents at beginning of period | 170,049 | 60,339 | 105,158 |
Cash, cash equivalents, restricted cash, and restricted cash equivalents at end of period | $ 251,342 | $ 170,049 | $ 60,339 |
Non-cash investing activities: | |||
(Decrease) increase in capital expenditures included in accounts payable and accrued expenses | $ (4,793) | $ 4,196 | $ (946) |
Capital additions from tenant improvement allowance | — | — | 1,111 |
Supplemental cash flow information: | |||
Interest paid | $ 8,912 | $ 4,741 | $ 7,005 |
Income tax payments | 186 | 561 | 25 |
Income tax refunds | 10,503 | 60 | 4,743 |
LENDINGTREE'S RECONCILIATION OF NON-GAAP MEASURES TO GAAP
Variable Marketing Expense
Below is a reconciliation of selling and marketing expense to variable marketing expense. See "Lending Tree's Principles of Financial Reporting" for further discussion of the Company's use of this non-GAAP measure.
Three Months Ended | Twelve Months Ended | |||||
December 31, | September 30, | December 31, | December 31, | December 31, | ||
(in thousands) | ||||||
Selling and marketing expense | $ 184,847 | $ 206,475 | $ 153,275 | $ 773,990 | $ 617,404 | |
Non-variable selling and marketing expense (1) | (15,053) | (14,928) | (13,248) | (57,351) | (49,652) | |
Cost of advertising re-sold to third parties (2) | — | — | — | — | 1,086 | |
Variable marketing expense | $ 169,794 | $ 191,547 | $ 140,027 | $ 716,639 | $ 568,838 | |
(1) | Represents the portion of selling and marketing expense not attributable to variable costs paid for advertising, direct marketing and related expenses. Includes overhead, fixed costs and personnel-related expenses. |
(2) | Represents the portion of cost of revenue attributable to costs paid for advertising re-sold to third parties. Excludes overhead, fixed costs, and personnel-related expenses. |
LENDINGTREE'S RECONCILIATION OF NON-GAAP MEASURES TO GAAP
Variable Marketing Margin
Below is a reconciliation of net income (loss) from continuing operations to variable marketing margin and net income (loss) from continuing operations % of revenue to variable marketing margin % of revenue. See "LendingTree's Principles of Financial Reporting" for further discussion of the Company's use of these non-GAAP measures.
Three Months Ended | Twelve Months Ended | |||||
December 31, | September 30, | December 31, | December 31, | December 31, | ||
(in thousands, except percentages) | ||||||
Net income (loss) from continuing operations | $ 48,432 | $ (4,406) | $ (8,117) | $ 73,138 | $ (22,566) | |
Net income (loss) from continuing operations % of revenue | 19 % | (1) % | (4) % | 7 % | (2) % | |
Adjustments to reconcile to variable marketing margin: | ||||||
Cost of revenue | 14,448 | 15,020 | 13,558 | 57,297 | 54,494 | |
Cost of advertising re-sold to third parties (1) | — | — | — | — | (1,086) | |
Non-variable selling and marketing expense (2) | 15,053 | 14,928 | 13,248 | 57,351 | 49,652 | |
General and administrative expense | 38,546 | 40,126 | 34,825 | 153,472 | 129,101 | |
Product development | 13,723 | 13,384 | 10,384 | 52,865 | 43,636 | |
Depreciation | 4,941 | 4,808 | 3,738 | 17,910 | 14,201 | |
Amortization of intangibles | 9,771 | 10,345 | 12,475 | 42,738 | 53,078 | |
Change in fair value of contingent consideration | — | (196) | (2,384) | (8,249) | 5,327 | |
Severance | 6 | 47 | 105 | 53 | 295 | |
Litigation settlements and contingencies | 32 | 22 | 40 | 392 | (943) | |
Interest expense, net | 14,986 | 11,826 | 9,894 | 46,867 | 36,300 | |
Other income | (83,200) | — | (369) | (123,272) | (376) | |
Income tax expense (benefit) | 11,753 | (1) | (5,095) | 11,298 | (19,961) | |
Variable marketing margin | $ 88,491 | $ 105,903 | $ 82,302 | $ 381,860 | $ 341,152 | |
Variable marketing margin % of revenue | 34 % | 36 % | 37 % | 35 % | 37 % | |
(1) | Represents the portion of cost of revenue attributable to costs paid for advertising re-sold to third parties. Excludes overhead, fixed costs, and personnel-related expenses. |
(2) | Represents the portion of selling and marketing expense not attributable to variable costs paid for advertising, direct marketing and related expenses. Includes overhead, fixed costs and personnel-related expenses. |
LENDINGTREE'S RECONCILIATION OF NON-GAAP MEASURES TO GAAP
Adjusted EBITDA
Below is a reconciliation of net income (loss) from continuing operations to adjusted EBITDA and net income (loss) from continuing operations % of revenue to adjusted EBITDA % of revenue. See "LendingTree's Principles of Financial Reporting" for further discussion of the Company's use of these non-GAAP measures.
Three Months Ended | Twelve Months Ended | |||||
December 31, | September 30, | December 31, | December 31, | December 31, | ||
(in thousands, except percentages) | ||||||
Net income (loss) from continuing operations | $ 48,432 | $ (4,406) | $ (8,117) | $ 73,138 | $ (22,566) | |
Net income (loss) from continuing operations % of revenue | 19 % | (1) % | (4) % | 7 % | (2) % | |
Adjustments to reconcile to adjusted EBITDA: | ||||||
Amortization of intangibles | 9,771 | 10,345 | 12,475 | 42,738 | 53,078 | |
Depreciation | 4,941 | 4,808 | 3,738 | 17,910 | 14,201 | |
Severance | 6 | 47 | 105 | 53 | 295 | |
Loss on impairments and disposal of assets | 814 | 1,251 | 474 | 3,465 | 1,160 | |
Gain on investments | (83,200) | — | — | (123,272) | — | |
Non-cash compensation expense | 16,751 | 17,074 | 14,497 | 68,555 | 53,733 | |
Costs of secondary public offering | — | — | 863 | — | 863 | |
Change in fair value of contingent consideration | — | (196) | (2,384) | (8,249) | 5,327 | |
Acquisition expense | 430 | 227 | (188) | 1,796 | 2,217 | |
Litigation settlements and contingencies | 32 | 22 | 40 | 392 | (943) | |
Interest expense, net | 14,986 | 11,826 | 9,894 | 46,867 | 36,300 | |
Income tax expense (benefit) | 11,753 | (1) | (5,095) | 11,298 | (19,961) | |
Adjusted EBITDA | $ 24,716 | $ 40,997 | $ 26,302 | $ 134,691 | $ 123,704 | |
Adjusted EBITDA % of revenue | 10 % | 14 % | 12 % | 12 % | 14 % | |
LENDINGTREE'S RECONCILIATION OF NON-GAAP MEASURES TO GAAP
Adjusted Net Income
Below is a reconciliation of net income (loss) from continuing operations to adjusted net (loss) income and net income (loss) per diluted share from continuing operations to adjusted net (loss) income per share. See "LendingTree's Principles of Financial Reporting" for further discussion of the Company's use of these non-GAAP measures.
Three Months Ended | Twelve Months Ended | |||||
December 31, | September 30, | December 31, | December 31, | December 31, | ||
(in thousands, except per share amounts) | ||||||
Net income (loss) from continuing operations | $ 48,432 | $ (4,406) | $ (8,117) | $ 73,138 | $ (22,566) | |
Adjustments to reconcile to adjusted net (loss) income: | ||||||
Severance | 6 | 47 | 105 | 53 | 295 | |
Loss on impairments and disposal of assets | 814 | 1,251 | 474 | 3,465 | 1,160 | |
Gain in investments | (83,200) | — | — | (123,272) | — | |
Non-cash compensation | 16,751 | 17,074 | 14,497 | 68,555 | 53,733 | |
Costs of secondary public offering | — | — | 863 | — | 863 | |
Change in fair value of contingent consideration | — | (196) | (2,384) | (8,249) | 5,327 | |
Acquisition expense | 430 | 227 | (188) | 1,796 | 2,217 | |
Litigation settlements and contingencies | 32 | 22 | 40 | 392 | (943) | |
Loss on extinguishment of debt | — | — | — | — | 7,768 | |
Income tax expense (benefit) from adjusted items | 16,980 | (4,687) | (3,402) | 14,968 | (17,880) | |
Excess tax (benefit) deficit from stock-based compensation | (2,046) | 938 | (51) | (9,401) | (2,033) | |
Income tax benefit from CARES Act | — | — | — | — | (6,104) | |
Adjusted net (loss) income | $ (1,801) | $ 10,270 | $ 1,837 | $ 21,445 | $ 21,837 | |
Net income (loss) per diluted share from continuing operations | $ 3.57 | $ (0.33) | $ (0.62) | $ 5.34 | $ (1.73) | |
Adjustments to reconcile net income (loss) from continuing operations to adjusted net (loss) income | (3.71) | 1.10 | 0.76 | (3.77) | 3.41 | |
Adjustments to reconcile effect of dilutive securities | — | (0.02) | (0.01) | — | (0.14) | |
Adjusted net (loss) income per share | $ (0.14) | $ 0.75 | $ 0.13 | $ 1.57 | $ 1.54 | |
Adjusted weighted average diluted shares outstanding | 13,212 | 13,707 | 14,163 | 13,695 | 14,150 | |
Effect of dilutive securities | (346) | 439 | 1,112 | — | 1,143 | |
Weighted average diluted shares outstanding | 13,558 | 13,268 | 13,051 | 13,695 | 13,007 | |
Effect of dilutive securities | 346 | — | — | 496 | — | |
Weighted average basic shares outstanding | 13,212 | 13,268 | 13,051 | 13,199 | 13,007 | |
LENDINGTREE'S PRINCIPLES OF FINANCIAL REPORTING
LendingTree reports the following non-GAAP measures as supplemental to GAAP:
- Variable marketing margin, including variable marketing expense
- Variable marketing margin % of revenue
- Earnings Before Interest, Taxes, Depreciation and Amortization, as adjusted for certain items discussed below ("Adjusted EBITDA")
- Adjusted EBITDA % of revenue
- Adjusted net income
- Adjusted net income per share
Variable marketing margin is a measure of the efficiency of the Company's operating model, measuring revenue after subtracting variable marketing and advertising costs that directly influence revenue. The Company's operating model is highly sensitive to the amount and efficiency of variable marketing expenditures, and the Company's proprietary systems are able to make rapidly changing decisions concerning the deployment of variable marketing expenditures (primarily but not exclusively online and mobile advertising placement) based on proprietary and sophisticated analytics. Variable marketing margin and variable marketing margin % of revenue are primary metrics by which the Company measures the effectiveness of its marketing efforts.
Adjusted EBITDA and adjusted EBITDA % of revenue are primary metrics by which LendingTree evaluates the operating performance of its businesses, on which its marketing expenditures and internal budgets are based and, in the case of adjusted EBITDA, by which management and many employees are compensated in most years.
Adjusted net income and adjusted net income per share supplement GAAP income from continuing operations and GAAP income per diluted share from continuing operations by enabling investors to make period to period comparisons of those components of the nearest comparable GAAP measures that management believes better reflect the underlying financial performance of the Company's business operations during particular financial reporting periods. Adjusted net income and adjusted net income per share exclude certain amounts, such as non-cash compensation, non-cash asset impairment charges, gain/loss on disposal of assets, gain/loss on investments, restructuring and severance, litigation settlements and contingencies, acquisition and disposition income or expenses including with respect to changes in fair value of contingent consideration, gain/loss on extinguishment of debt, one-time items which are recognized and recorded under GAAP in particular periods but which might be viewed as not necessarily coinciding with the underlying business operations for the periods in which they are so recognized and recorded, the effects to income taxes of the aforementioned adjustments and any excess tax benefit or expense associated with stock-based compensation recorded in net income in conjunction with FASB pronouncement ASU 2016-09. LendingTree believes that adjusted net income and adjusted net income per share are useful financial indicators that provide a different view of the financial performance of the Company than adjusted EBITDA (the primary metric by which LendingTree evaluates the operating performance of its businesses) and the GAAP measures of net income from continuing operations and GAAP income per diluted share from continuing operations.
These non-GAAP measures should be considered in addition to results prepared in accordance with GAAP, but should not be considered a substitute for or superior to GAAP results. LendingTree provides and encourages investors to examine the reconciling adjustments between the GAAP and non-GAAP measures set forth above.
Definition of LendingTree's Non-GAAP Measures
Variable marketing margin is defined as revenue less variable marketing expense. Variable marketing expense is defined as the expense attributable to variable costs paid for advertising, direct marketing and related expenses, and excluding overhead, fixed costs and personnel-related expenses. The majority of these variable advertising costs are expressly intended to drive traffic to our websites and these variable advertising costs are included in selling and marketing expense on the Company's consolidated statements of operations and consolidated income.
EBITDA is defined as net income from continuing operations excluding interest, income taxes, amortization of intangibles and depreciation.
Adjusted EBITDA is defined as EBITDA excluding (1) non-cash compensation expense, (2) non-cash impairment charges, (3) gain/loss on disposal of assets, (4) gain/loss on investments, (5) restructuring and severance expenses, (6) litigation settlements and contingencies, (7) acquisitions and dispositions income or expense (including with respect to changes in fair value of contingent consideration), and (8) one-time items.
Adjusted net income is defined as net income (loss) from continuing operations excluding (1) non-cash compensation expense, (2) non-cash impairment charges, (3) gain/loss on disposal of assets, (4) gain/loss on investments, (5) restructuring and severance expenses, (6) litigation settlements and contingencies, (7) acquisitions and dispositions income or expense (including with respect to changes in fair value of contingent consideration), (8) gain/loss on extinguishment of debt, (9) one-time items, (10) the effects to income taxes of the aforementioned adjustments, and (11) any excess tax benefit or expense associated with stock-based compensation recorded in net income in conjunction with FASB pronouncement ASU 2016-09.
Adjusted net income per share is defined as adjusted net income divided by the adjusted weighted average diluted shares outstanding. For periods which the Company reports GAAP loss from continuing operations, the effects of potentially dilutive securities are excluded from the calculation of net loss per diluted share from continuing operations because their inclusion would have been anti-dilutive. In periods where the Company reports GAAP loss from continuing operations but reports positive non-GAAP adjusted net income, the effects of potentially dilutive securities are included in the denominator for calculating adjusted net income per share.
LendingTree endeavors to compensate for the limitations of these non-GAAP measures by also providing the comparable GAAP measures with equal or greater prominence and descriptions of the reconciling items, including quantifying such items, to derive the non-GAAP measures. These non-GAAP measures may not be comparable to similarly titled measures used by other companies.
One-Time Items
Adjusted EBITDA and adjusted net income are adjusted for one-time items, if applicable. Items are considered one-time in nature if they are non-recurring, infrequent or unusual, and have not occurred in the past two years or are not expected to recur in the next two years, in accordance with SEC rules. For the periods presented in this report, there are no adjustments for one-time items, except for the $6.1 million income tax benefit from the CARES Act in Q1 2020 and the Q4 2020 expenses incurred in connection with a secondary public offering of our common stock by our largest shareholder, for which we did not receive any proceeds.
Non-Cash Expenses That Are Excluded From LendingTree's Adjusted EBITDA and Adjusted Net Income
Non-cash compensation expense consists principally of expense associated with the grants of restricted stock, restricted stock units and stock options. Non-cash compensation expense also includes expense associated with employee stock purchase plans. These expenses are not paid in cash and LendingTree includes the related shares in its calculations of fully diluted shares outstanding. Upon settlement of restricted stock units, exercise of certain stock options or vesting of restricted stock awards, the awards may be settled on a net basis, with LendingTree remitting the required tax withholding amounts from its current funds. Cash expenditures for employer payroll taxes on non-cash compensation are included within adjusted EBITDA and adjusted net income.
Amortization of intangibles are non-cash expenses relating primarily to acquisitions. At the time of an acquisition, the intangible assets of the acquired company, such as purchase agreements, technology and customer relationships, are valued and amortized over their estimated lives. Amortization of intangibles are only excluded from adjusted EBITDA, except for the $6.1 million income tax benefit from the CARES Act in Q1 2020 and the Q4 2020 expenses incurred in connection with a secondary public offering of our common stock by our largest shareholder, for which we did not receive any proceeds.
Safe Harbor Statement Under the Private Securities Litigation Reform Act of 1995
The matters contained in the discussion above may be considered to be "forward-looking statements" within the meaning of the Securities Act of 1933 and the Securities Exchange Act of 1934, as amended by the Private Securities Litigation Reform Act of 1995. Those statements include statements regarding the intent, belief or current expectations or anticipations of LendingTree and members of our management team. Factors currently known to management that could cause actual results to differ materially from those in forward-looking statements include the following: uncertainty regarding the duration and scope of the coronavirus referred to as COVID-19 pandemic; actions governments and businesses take in response to the pandemic, including actions that could affect levels of advertising activity; the impact of the pandemic and actions taken in response to the pandemic on national and regional economies and economic activity; the pace of recovery when the COVID-19 pandemic subsides; adverse conditions in the primary and secondary mortgage markets and in the economy, particularly interest rates; default rates on loans, particularly unsecured loans; demand by investors for unsecured personal loans; the effect of such demand on interest rates for personal loans and consumer demand for personal loans; seasonality of results; potential liabilities to secondary market purchasers; changes in the Company's relationships with network lenders, including dependence on certain key network lenders; breaches of network security or the misappropriation or misuse of personal consumer information; failure to provide competitive service; failure to maintain brand recognition; ability to attract and retain consumers in a cost-effective manner; the effects of potential acquisitions of other businesses, including the ability to integrate them successfully with LendingTree's existing operations; accounting rules related to contingent consideration and excess tax benefits or expenses on stock-based compensation that could materially affect earnings in future periods; ability to develop new products and services and enhance existing ones; competition; allegations of failure to comply with existing or changing laws, rules or regulations, or to obtain and maintain required licenses; failure of network lenders or other affiliated parties to comply with regulatory requirements; failure to maintain the integrity of systems and infrastructure; liabilities as a result of privacy regulations; failure to adequately protect intellectual property rights or allegations of infringement of intellectual property rights; and changes in management. These and additional factors to be considered are set forth under "Risk Factors" in our Annual Report on Form 10-K for the period ended December 31, 2020, in our Quarterly Report on Form 10-Q for the period ended September 30, 2021, and in our other filings with the Securities and Exchange Commission. LendingTree undertakes no obligation to update or revise forward-looking statements to reflect changed assumptions, the occurrence of unanticipated events or changes to future operating results or expectations.
About LendingTree, Inc.
LendingTree, Inc. is the parent of LendingTree, LLC and several companies owned by LendingTree, LLC (collectively, "LendingTree" or the "Company").
LendingTree operates what it believes to be the leading online consumer platform that connects consumers with the choices they need to be confident in their financial decisions. The Company offers consumers tools and resources, including free credit scores, that facilitate comparison-shopping for mortgage loans, home equity loans and lines of credit, reverse mortgage loans, auto loans, credit cards, deposit accounts, personal loans, student loans, small business loans, insurance quotes and other related offerings. The Company primarily seeks to match in-market consumers with multiple providers on its marketplace who can provide them with competing quotes for loans, deposit products, insurance or other related offerings they are seeking. The Company also serves as a valued partner to lenders and other providers seeking an efficient, scalable and flexible source of customer acquisition with directly measurable benefits, by matching the consumer inquiries it generates with these providers.
LendingTree, Inc. is headquartered in Charlotte, NC. For more information, please visit www.lendingtree.com.
Investor Relations:
investors@lendingtree.com
Media Relations:
press@lendingtree.com
View original content to download multimedia:https://www.prnewswire.com/news-releases/lendingtree-reports-fourth-quarter-2021-results-301490403.html
SOURCE LendingTree, Inc.
 recovery
interest rates
grants
pandemic
coronavirus
covid-19
press-release
recovery
interest rates
grants
pandemic
coronavirus
covid-19
press-release
Uncategorized
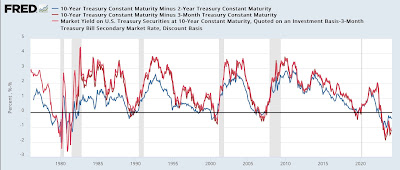
Manufacturing and construction vs. the still-inverted yield curve
– by New Deal democratProf. Menzie Chinn at Econbrowser makes the point that the yield curve is still inverted, and has not yet eclipsed the longest…
Share this:

- by New Deal democrat
Prof. Menzie Chinn at Econbrowser makes the point that the yield curve is still inverted, and has not yet eclipsed the longest previous time between onset of such an inversion and a recession. So he believes the threat of recession is still on the table.


Uncategorized
Half Of Downtown Pittsburgh Office Space Could Be Empty In 4 Years
Half Of Downtown Pittsburgh Office Space Could Be Empty In 4 Years
Authored by Mike Shedlock via MishTalk.com,
The CRE implosion is picking…
Share this:


Authored by Mike Shedlock via MishTalk.com,
The CRE implosion is picking up steam.
Check out the grim stats on Pittsburgh.
Unions are also a problem in Pittsburgh as they are in Illinois and California.
Downtown Pittsburgh Implosion
The Post Gazette reports nearly half of Downtown Pittsburgh office space could be empty in 4 years.
Confidential real estate information obtained by the Pittsburgh Post-Gazette estimates that 17 buildings are in “significant distress” and another nine are in “pending distress,” meaning they are either approaching foreclosure or at risk of foreclosure. Those properties represent 63% of the Downtown office stock and account for $30.5 million in real estate taxes, according to the data.
It also calculates the current office vacancy rate at 27% when subleases are factored in — one of the highest in the country.
And with an additional three million square feet of unoccupied leased space becoming available over the next five years, the vacancy rate could soar to 46% by 2028, based on the data.
Property assessments on 10 buildings, including U.S. Steel Tower, PPG Place, and the Tower at PNC Plaza, have been slashed by $364.4 million for the 2023 tax year, as high vacancies drive down their income.
Another factor has been the steep drop — to 63.5% from 87.5% — in the common level ratio, the number used to compute taxable value in county assessment appeal hearings.
The assessment cuts have the potential to cost the city, the county, and the Pittsburgh schools nearly $8.4 million in tax refunds for that year alone. Downtown represents nearly 25% of the city’s overall tax base.
In response Pittsburgh City Councilman Bobby Wilson wants to remove a $250,000 limit on the amount of tax relief available to a building owner or developer as long as a project creates at least 50 full-time equivalent jobs.
It’s unclear if the proposal will be enough. Annual interest costs to borrow $1 million have soared from $32,500 at the start of the pandemic in 2020 to $85,000 on March 1. Local construction costs have increased by about 30% since 2019.
But the city is doomed if it does nothing. Aaron Stauber, president of Rugby Realty said it will probably empty out Gulf Tower and mothball it once all existing leases expire.
“It’s cheaper to just shut the lights off,” he said. “At some point, we would move on to greener pastures.”
Where’s There’s Smoke There’s Unions
In addition to the commercial real estate woes, the city is also wrestling with union contracts.
Please consider Sounding the alarm: Pittsburgh Controller’s letter should kick off fiscal soul-searching
It’s only March, and Pittsburgh’s 2024 house-of-cards operating budget is already falling down. That’s the clear implication of a letter sent by new City Controller Rachael Heisler to Mayor Ed Gainey and members of City Council on Wednesday afternoon.
The letter is a rare and welcome expression of urgency in a city government that has fallen in complacency — and is close to falling into fiscal disaster.
The approaching crisis was thrown into sharp relief this week, when City Council approved amendments to the operating budget accounting for a pricey new contract with the firefighters union. The Post-Gazette Editorial Board had predicted that this contract — plus two others yet to be announced and approved — would demonstrate the dishonesty of Mayor Ed Gainey’s budget, and that’s exactly what’s happening: The new contract is adding $11 million to the administration’s artificially low 5-year spending projections, bringing expected 2028 reserves to just barely the legal limit.
But there’s still two big contracts to go, with the EMS union and the Pittsburgh Joint Collective Bargaining Committee, which covers Public Works workers. Worse, there are tens — possibly hundreds — of millions in unrealistic revenues still on the books. On this, Ms. Heisler’s letter only scratched the surface.
Similarly, as we have observed, the budget’s real estate tax revenue projections are radically inconsistent with reality. Due to high vacancies and a sharp reduction in the common level ratio, a significant drop in revenues was predictable — but not reflected in the budget. Ms. Heisler’s estimate of a 20% drop in revenues from Downtown property, or $5.3 million a year, may even be optimistic: Other estimates peg the loss at twice that, or more.
Left unmentioned in the letter are massive property tax refunds the city will owe, as well as fanciful projections of interest income that are inconsistent with the dwindling reserves, and drawing-down of federal COVID relief funds, predicted in the budget itself. That’s another unrealistic $80 million over five years.
Pittsburgh exited Act 47 state oversight after nearly 15 years on Feb. 12, 2018, with a clean bill of fiscal health.
It has already ruined that bill of health.
Act 47 in Pittsburgh
Flashback February 21, 2018: Act 47 in Pittsburgh: What Was Accomplished?
Pittsburgh’s tax structure was a much-complained-about topic leading up to the Act 47 declaration. The year following Pittsburgh’s designation as financially distressed under Act 47 it levied taxes on real estate, real estate transfers, parking, earned income, business gross receipts (business privilege and mercantile), occupational privilege and amusements. The General Assembly enacted tax reforms in 2004 giving the city authority to levy a payroll preparation tax in exchange for the immediate elimination of the mercantile tax and the phase out of the business privilege tax. The tax reforms increased the amount of the occupational privilege tax from $10 to $52 (this is today known as the local services tax and all municipalities outside of Philadelphia levy it and could raise it thanks to the change for Pittsburgh).
The coordinators recommended an increase in the deed transfer tax, which occurred in late 2004 (it was just increased again by City Council) and in the real estate tax, which increased in 2015.
Legacy costs, principally debt and underfunded pensions, were the primary focus of the 2009 amended recovery plan. The city’s pension funded ratio has increased significantly from where it stood a decade ago, rising from the mid-30 percent range to over 60 percent at last measurement.
The obvious question? Will the city stick to the steps taken to improve financially and avoid slipping back into distressed status? If Pittsburgh once stood “on the precipice of full-blown crisis,” as described in the first recovery plan, hopefully it won’t return to that position.
The Obvious Question
I could have answered the 2018 obvious question with the obvious answer. Hell no.
No matter how much you raise taxes, it will never be enough because public unions will suck every penny and want more.
On top of union graft, and insanely woke policies in California, we have an additional huge problem.
Hybrid Work Leaves Offices Empty and Building Owners Reeling
Hybrid work has put office building owners in a bind and could pose a risk to banks. Landlords are now confronting the fact that some of their office buildings have become obsolete, if not worthless.
Meanwhile, in Illinois …
Chicago Teachers’ Union Seeks $50 Billion Despite $700 Million City Deficit
Please note the Chicago Teachers’ Union Seeks $50 Billion Despite $700 Million City Deficit
The CTU wants to raise taxes across the board, especially targeting real estate.
My suggestion, get the hell out...
International
A popular vacation destination is about to get much more expensive
The entry fee to this destination known for its fauna has been unchanged since 1998.
Share this:


When visiting certain islands and other remote parts of the world, travelers need to be prepared to pay more than just the plane ticket and accommodation costs.
Particularly for smaller places grappling with overtourism, local governments will often introduce "tourist taxes" to go toward things like reversing ecological degradation and keeping popular attractions clean and safe.
Related: A popular European city is introducing the highest 'tourist tax' yet
Located 900 kilometers off the coast of Ecuador and often associated with the many species of giant turtles who call it home, the Galápagos Islands are not easy to get to (visitors from the U.S. often pass through Quito and then get on a charter flight to the islands) but are often a dream destination for those interested in seeing rare animal species in an unspoiled environment.
Shutterstock
This is how much you'll have to pay to visit the Galápagos Islands
While local authorities have been charging a $100 USD entry fee for all visitors to the islands since 1998, Ecuador's Ministry of Tourism announced that this number would rise to $200 for adults starting from August 1, 2024.
More Travel:
- A new travel term is taking over the internet (and reaching airlines and hotels)
- The 10 best airline stocks to buy now
- Airlines see a new kind of traveler at the front of the plane
According to the local tourism board, the increase has been prompted by the fact that record numbers of visitors since the pandemic have started taking a toll on the local environment. The islands are home to just 30,000 people but have been seeing nearly 300,000 visitors each year.
"It is our collective responsibility to protect and preserve this unparalleled ecosystem for future generations," Ecuador's Minister of Tourism Niels Olsen said in a statement. "The adjustment in the entry fee, the first in 26 years, is a necessary measure to ensure that tourism in the Galápagos remains sustainable and mutually beneficial to both the environment and our local communities."
These are the other countries which are raising (or adding) their tourist taxes
While the $200 applies to most international adult arrivals, there are some exceptions that can make one eligible for a lower rate. Adult citizens of the countries that make up the South American treaty bloc Mercosur will pay a $100 fee while children from any country will also get a discounted rate that is currently set at $50. Children under the age of two will continue to get free access.
In recent years, multiple countries and destinations have either raised or introduced new taxes for visitors. Thailand recently started charging all international visitors between 150 and 300 baht (up to $9 USD) that are put toward a sustainability budget while the Italian city of Venice is running a test in which it charges those coming into the city during the most popular summer weekends five euros.
Places such as Bali, the Maldives and New Zealand have been charging international arrivals a fee for years while Iceland's Prime Minister Katrín Jakobsdóttir hinted at plans to introduce something similar at the United Nations Climate Ambition Summit in 2023.
"Tourism has really grown exponentially in Iceland in the last decade and that obviously is not just creating effects on the climate," Jakobsdóttir told a Bloomberg reporter. "Most of our guests visit our unspoiled nature and obviously that creates a pressure."
stocks pandemic european

Mistakes Were Made


Home buyers must now navigate higher mortgage rates and prices


Supreme Court Rules Public Officials May Block Their Constituents On Social Media


“Extreme Events”: US Cancer Deaths Spiked In 2021 And 2022 In “Large Excess Over Trend”


Harvard Medical School Professor Was Fired Over Not Getting COVID Vaccine


Germany Is Running Out Of Money And Debt Levels Are Exploding, Finance Minister Warns


TikTok Ban Obscures Chinese Stock Gold Rush


Default: San Francisco Four Seasons Hotel Investors $3 Million Late On Loan As Foreclosure Looms


You can strike gold and silver investment opportunities at Costco


Correcting the Washington Post’s 11 Charts That Are Supposed to Tell Us How the Economy Changed Since Covid
-

 Uncategorized4 weeks ago
All Of The Elements Are In Place For An Economic Crisis Of Staggering Proportions
-

 Spread & Containment5 days ago
IFM’s Hat Trick and Reflections On Option-To-Buy M&A
-

 International1 week ago
EyePoint poaches medical chief from Apellis; Sandoz CFO, longtime BioNTech exec to retire
-

 Uncategorized1 month ago
California Counties Could Be Forced To Pay $300 Million To Cover COVID-Era Program
-

 Uncategorized3 weeks ago
Apparel Retailer Express Moving Toward Bankruptcy
-

 Uncategorized1 month ago
Industrial Production Decreased 0.1% in January
-

 International1 week ago
Walmart launches clever answer to Target’s new membership program
-

 Uncategorized1 month ago
RFK Jr: The Wuhan Cover-Up & The Rise Of The Biowarfare-Industrial Complex