Connect with us

Uncategorized

Kitchen sinks market size to grow by USD 533.96 million from 2021 to 2026: A descriptive analysis of customer landscape, vendor assessment, and market dynamics – Technavio

Kitchen sinks market size to grow by USD 533.96 million from 2021 to 2026: A descriptive analysis of customer landscape, vendor assessment, and market dynamics – Technavio
PR Newswire
NEW YORK, Jan. 16, 2023

NEW YORK, Jan. 16, 2023 /PRNewswire/ — …

Published

on

Kitchen sinks market size to grow by USD 533.96 million from 2021 to 2026: A descriptive analysis of customer landscape, vendor assessment, and market dynamics - Technavio

PR Newswire

NEW YORK, Jan. 16, 2023 /PRNewswire/ -- The global kitchen sinks market size is estimated to increase by USD 533.96 million from 2021 to 2026. The market's growth momentum will accelerate at a CAGR of 3.37% during the forecast period, according to Technavio. - Request a sample report

Global kitchen sinks market – Vendor analysis
Vendor offerings -

  • BLANCO GmbH and Co. KG – The company offers kitchen sinks made of stainless steel and anti-scratch brushed finish.
  • Dornbracht AG and Co. KG - The company offers kitchen sinks such as Glazed steel sinks, Matte stainless steel, and Polished stainless steel.
  • FRANKE Holding AG - The company offers kitchen sinks such as undermount sinks and topmount sinks.
  • Kohler Co. - The company offers a wide range of kitchen sinks such as Whitehaven, Prolific, and Gilford.
  • For details on vendors and their offerings – Buy the report!

Vendor landscape –

The global kitchen sinks market is fragmented, with the presence of several established vendors. A few prominent vendors that offer kitchen sinks in the market are Acrysil Ltd., BLANCO GmbH and Co. KG, Dornbracht AG and Co. KG, Elkay Manufacturing Co., Fletcher Building Ltd., FRANKE Holding AG, Futura Kitchen sinks Ind Pvt Ltd., JOMOO Kitchen and Bath Co. Ltd., JULIEN Inc., Kohler Co., Kovinoplastika Loz d.o.o., Kraus USA Inc., Moen Inc., Roca Sanitario SA, Ruvati, Schock GmbH, TEKA INDUSTRIAL S.A., VIGO INDUSTRIES LLC., Whitehaus Collection, and Zuhne and others.

Companies adopt various marketing strategies to increase their market share. Partnerships and acquisitions of new brands allow leading competitors to maintain their presence in the market. Moreover, many global players are expected to expand their presence across the world during the forecast period.

Global kitchen sinks market - Customer landscape
To help companies evaluate and develop growth strategies, the report outlines –

  • Key purchase criteria
  • Adoption rates
  • Adoption lifecycle
  • Drivers of price sensitivity

Global kitchen sinks market - Segmentation assessment

Segment overview
Technavio has segmented the market based on end-user (residential and commercial). 

  • The residential segment will grow at a significant rate during the forecast period, especially in APAC and North America. APAC has a large number of developing economies. Governments across countries such as India, Qatar, the United Arab Emirates (UAE), and Nigeria are investing in residential construction, which will increase the demand for home furnishing products in the next few years. These factors will drive the growth of the segment during the forecast period.

Geography overview
Based on geography, the global kitchen sinks market is segmented into North America, Europe, APAC, Middle East and Africa, and South America. The report provides actionable insights and estimates the contribution of all regions to the growth of the global kitchen sinks market.

  • North America will account for 34% of the market's growth during the forecast period. The US is a key country for the kitchen sinks market in the region. Moreover, market growth in this region will be faster than the growth of the market in other regions. The rising number of residential construction activities will drive the kitchen sinks market growth in North America during the forecast period.

Download a sample report

Global kitchen sinks market – Market dynamics

Leading drivers - The growing global residential building construction market is driving the kitchen sinks market growth. APAC has contributed significantly to the global residential building construction market due to rapid urbanization and growing disposable income. Houses are considered long-term assets, and owners can rent the house as rent is a non-detectible expense. This, in turn, will fuel the kitchen sinks market growth during the forecast period.

Key trends - The emerging growth of semi-recessed sinks is a key trend in the market. A semi-recessed sink combines the features of an undermount sink and the contemporary appearance of a kitchen sink. It is designed to save space on kitchen counters. Moreover, semi-recessed sinks are easy to clean. Such advantages will support the kitchen sinks market growth during the forecast period.

Major challenges - Fluctuations in raw material prices are challenging the market growth. Most raw materials are obtained on the basis of purchase orders. Therefore, any change in raw material prices can adversely affect the production cost of kitchen sinks. High prices of materials also lead to a reduction in sales, which affects the profit margins of vendors. Such factors can hinder the growth of the kitchen sinks market during the forecast period.

Drivers, trends, and challenges have an impact on market dynamics, which can impact businesses. Find more insights in a sample report!

What are the key data covered in this kitchen sinks market report?

  • CAGR of the market during the forecast period
  • Detailed information on factors that will drive the growth of the kitchen sinks market between 2022 and 2026
  • Precise estimation of the size of the kitchen sinks market and its contribution to the parent market
  • Accurate predictions about upcoming trends and changes in consumer behavior
  • Growth of the kitchen sinks market across North America, Europe, APAC, Middle East and Africa, and South America
  • A thorough analysis of the market's competitive landscape and detailed information about vendors
  • Comprehensive analysis of factors that will challenge the growth of kitchen sinks market vendors

Gain instant access to 17,000+ market research reports. 

Technavio's SUBSCRIPTION platform

Related Reports:

The kitchen appliances market size is expected to increase by USD 41.91 billion from 2021 to 2026, and the market's growth momentum will accelerate at a CAGR of 4.62%. This report extensively covers segmentation by application (residential and commercial), distribution channel (offline and online), and geography (APAC, North America, Europe, South America, and the Middle East and Africa).

The outdoor kitchen cabinets market size is expected to increase by USD 913.09 million from 2021 to 2026, and the market's growth momentum will accelerate at a CAGR of 4.75%. This report extensively covers market segmentation by end-user (residential and commercial) and geography (North America, Europe, APAC, South America, and the Middle East and Africa).

Kitchen Sinks Market Scope

Report Coverage

Details

Page number

132

Base year

2021

Forecast period

2022-2026

Growth momentum & CAGR

Accelerate at a CAGR of 3.37%

Market growth 2022-2026

USD 533.96 million

Market structure

Fragmented

YoY growth 2021-2022 (%)

2.84

Regional analysis

North America, Europe, APAC, Middle East and Africa, and South America

Performing market contribution

North America at 34%

Key countries

US, China, Japan, UK, and Germany

Competitive landscape

Leading vendors, market positioning of vendors, competitive strategies, and industry risks

Key companies profiled

Acrysil Ltd., BLANCO GmbH and Co. KG, Dornbracht AG and Co. KG, Elkay Manufacturing Co., Fletcher Building Ltd., FRANKE Holding AG, Futura Kitchen sinks Ind Pvt Ltd., JOMOO Kitchen and Bath Co. Ltd., JULIEN Inc., Kohler Co., Kovinoplastika Loz d.o.o., Kraus USA Inc., Moen Inc., Roca Sanitario SA, Ruvati, Schock GmbH, TEKA INDUSTRIAL S.A., VIGO INDUSTRIES LLC., Whitehaus Collection, and Zuhne

Market dynamics

Parent market analysis, market growth inducers and obstacles, fast-growing and slow-growing segment analysis, COVID-19 impact and recovery analysis and future consumer dynamics, and market condition analysis for the forecast period.

Customization purview

If our report has not included the data that you are looking for, you can reach out to our analysts and get segments customized.

Customization purview

If our report has not included the data that you are looking for, you can reach out to our analysts and get segments customized.

Browse for Technavio's consumer discretionary market reports

Table of contents

1 Executive Summary

  • 1.1 Market overview 
    • Exhibit 01: Executive Summary – Chart on Market Overview
    • Exhibit 02: Executive Summary – Data Table on Market Overview
    • Exhibit 03: Executive Summary – Chart on Global Market Characteristics
    • Exhibit 04: Executive Summary – Chart on Market by Geography
    • Exhibit 05: Executive Summary – Chart on Market Segmentation by End-user
    • Exhibit 06: Executive Summary – Chart on Incremental Growth
    • Exhibit 07: Executive Summary – Data Table on Incremental Growth
    • Exhibit 08: Executive Summary – Chart on Vendor Market Positioning

2 Market Landscape

  • 2.1 Market ecosystem 
    • Exhibit 09: Parent market
    • Exhibit 10: Market Characteristics

3 Market Sizing

  • 3.1 Market definition 
    • Exhibit 11: Offerings of vendors included in the market definition
  • 3.2 Market segment analysis 
    • Exhibit 12: Market segments
  • 3.3 Market size 2021
  • 3.4 Market outlook: Forecast for 2021-2026 
    • Exhibit 13: Chart on Global - Market size and forecast 2021-2026 ($ million)
    • Exhibit 14: Data Table on Global - Market size and forecast 2021-2026 ($ million)
    • Exhibit 15: Chart on Global Market: Year-over-year growth 2021-2026 (%)
    • Exhibit 16: Data Table on Global Market: Year-over-year growth 2021-2026 (%)

4 Five Forces Analysis

  • 4.1 Five forces summary 
    • Exhibit 17: Five forces analysis - Comparison between 2021 and 2026
  • 4.2 Bargaining power of buyers 
    • Exhibit 18: Chart on Bargaining power of buyers – Impact of key factors 2021 and 2026
  • 4.3 Bargaining power of suppliers 
    • Exhibit 19: Bargaining power of suppliers – Impact of key factors in 2021 and 2026
  • 4.4 Threat of new entrants 
    • Exhibit 20: Threat of new entrants – Impact of key factors in 2021 and 2026
  • 4.5 Threat of substitutes 
    • Exhibit 21: Threat of substitutes – Impact of key factors in 2021 and 2026
  • 4.6 Threat of rivalry 
    • Exhibit 22: Threat of rivalry – Impact of key factors in 2021 and 2026
  • 4.7 Market condition 
    • Exhibit 23: Chart on Market condition - Five forces 2021 and 2026

5 Market Segmentation by End-user

  • 5.1 Market segments 
    • Exhibit 24: Chart on End-user - Market share 2021-2026 (%)
    • Exhibit 25: Data Table on End-user - Market share 2021-2026 (%)
  • 5.2 Comparison by End-user 
    • Exhibit 26: Chart on Comparison by End-user
    • Exhibit 27: Data Table on Comparison by End-user
  • 5.3 Residential - Market size and forecast 2021-2026
    • Exhibit 28: Chart on Residential - Market size and forecast 2021-2026 ($ million)
    • Exhibit 29: Data Table on Residential - Market size and forecast 2021-2026 ($ million)
    • Exhibit 30: Chart on Residential - Year-over-year growth 2021-2026 (%)
    • Exhibit 31: Data Table on Residential - Year-over-year growth 2021-2026 (%)
  • 5.4 Commercial - Market size and forecast 2021-2026
    • Exhibit 32: Chart on Commercial - Market size and forecast 2021-2026 ($ million)
    • Exhibit 33: Data Table on Commercial - Market size and forecast 2021-2026 ($ million)
    • Exhibit 34: Chart on Commercial - Year-over-year growth 2021-2026 (%)
    • Exhibit 35: Data Table on Commercial - Year-over-year growth 2021-2026 (%)
  • 5.5 Market opportunity by End-user 
    • Exhibit 36: Market opportunity by End-user ($ million)

6 Customer Landscape

  • 6.1 Customer landscape overview 
    • Exhibit 37: Analysis of price sensitivity, lifecycle, customer purchase basket, adoption rates, and purchase criteria

7 Geographic Landscape

  • 7.1 Geographic segmentation 
    • Exhibit 38: Chart on Market share by geography 2021-2026 (%)
    • Exhibit 39: Data Table on Market share by geography 2021-2026 (%)
  • 7.2 Geographic comparison 
    • Exhibit 40: Chart on Geographic comparison
    • Exhibit 41: Data Table on Geographic comparison
  • 7.3 North America - Market size and forecast 2021-2026
    • Exhibit 42: Chart on North America - Market size and forecast 2021-2026 ($ million)
    • Exhibit 43: Data Table on North America - Market size and forecast 2021-2026 ($ million)
    • Exhibit 44: Chart on North America - Year-over-year growth 2021-2026 (%)
    • Exhibit 45: Data Table on North America - Year-over-year growth 2021-2026 (%)
  • 7.4 Europe - Market size and forecast 2021-2026
    • Exhibit 46: Chart on Europe - Market size and forecast 2021-2026 ($ million)
    • Exhibit 47: Data Table on Europe - Market size and forecast 2021-2026 ($ million)
    • Exhibit 48: Chart on Europe - Year-over-year growth 2021-2026 (%)
    • Exhibit 49: Data Table on Europe - Year-over-year growth 2021-2026 (%)
  • 7.5 APAC - Market size and forecast 2021-2026
    • Exhibit 50: Chart on APAC - Market size and forecast 2021-2026 ($ million)
    • Exhibit 51: Data Table on APAC - Market size and forecast 2021-2026 ($ million)
    • Exhibit 52: Chart on APAC - Year-over-year growth 2021-2026 (%)
    • Exhibit 53: Data Table on APAC - Year-over-year growth 2021-2026 (%)
  • 7.6 Middle East and Africa - Market size and forecast 2021-2026 
    • Exhibit 54: Chart on Middle East and Africa - Market size and forecast 2021-2026 ($ million)
    • Exhibit 55: Data Table on Middle East and Africa - Market size and forecast 2021-2026 ($ million)
    • Exhibit 56: Chart on Middle East and Africa - Year-over-year growth 2021-2026 (%)
    • Exhibit 57: Data Table on Middle East and Africa - Year-over-year growth 2021-2026 (%)
  • 7.7 South America - Market size and forecast 2021-2026
    • Exhibit 58: Chart on South America - Market size and forecast 2021-2026 ($ million)
    • Exhibit 59: Data Table on South America - Market size and forecast 2021-2026 ($ million)
    • Exhibit 60: Chart on South America - Year-over-year growth 2021-2026 (%)
    • Exhibit 61: Data Table on South America - Year-over-year growth 2021-2026 (%)
  • 7.8 US - Market size and forecast 2021-2026
    • Exhibit 62: Chart on US - Market size and forecast 2021-2026 ($ million)
    • Exhibit 63: Data Table on US - Market size and forecast 2021-2026 ($ million)
    • Exhibit 64: Chart on US - Year-over-year growth 2021-2026 (%)
    • Exhibit 65: Data Table on US - Year-over-year growth 2021-2026 (%)
  • 7.9 China - Market size and forecast 2021-2026
    • Exhibit 66: Chart on China - Market size and forecast 2021-2026 ($ million)
    • Exhibit 67: Data Table on China - Market size and forecast 2021-2026 ($ million)
    • Exhibit 68: Chart on China - Year-over-year growth 2021-2026 (%)
    • Exhibit 69: Data Table on China - Year-over-year growth 2021-2026 (%)
  • 7.10 UK - Market size and forecast 2021-2026
    • Exhibit 70: Chart on UK - Market size and forecast 2021-2026 ($ million)
    • Exhibit 71: Data Table on UK - Market size and forecast 2021-2026 ($ million)
    • Exhibit 72: Chart on UK - Year-over-year growth 2021-2026 (%)
    • Exhibit 73: Data Table on UK - Year-over-year growth 2021-2026 (%)
  • 7.11 Germany - Market size and forecast 2021-2026
    • Exhibit 74: Chart on Germany - Market size and forecast 2021-2026 ($ million)
    • Exhibit 75: Data Table on Germany - Market size and forecast 2021-2026 ($ million)
    • Exhibit 76: Chart on Germany - Year-over-year growth 2021-2026 (%)
    • Exhibit 77: Data Table on Germany - Year-over-year growth 2021-2026 (%)
  • 7.12 Japan - Market size and forecast 2021-2026
    • Exhibit 78: Chart on Japan - Market size and forecast 2021-2026 ($ million)
    • Exhibit 79: Data Table on Japan - Market size and forecast 2021-2026 ($ million)
    • Exhibit 80: Chart on Japan - Year-over-year growth 2021-2026 (%)
    • Exhibit 81: Data Table on Japan - Year-over-year growth 2021-2026 (%)
  • 7.13 Market opportunity by geography 
    • Exhibit 82: Market opportunity by geography ($ million)

8 Drivers, Challenges, and Trends

  • 8.1 Market drivers
  • 8.2 Market challenges
  • 8.3 Impact of drivers and challenges 
    • Exhibit 83: Impact of drivers and challenges in 2021 and 2026
  • 8.4 Market trends

9 Vendor Landscape

  • 9.1 Overview
  • 9.2 Vendor landscape 
    • Exhibit 84: Overview on Criticality of inputs and Factors of differentiation
  • 9.3 Landscape disruption 
    • Exhibit 85: Overview on factors of disruption
  • 9.4 Industry risks 
    • Exhibit 86: Impact of key risks on business

10 Vendor Analysis

  • 10.1 Vendors covered 
    • Exhibit 87: Vendors covered
  • 10.2 Market positioning of vendors 
    • Exhibit 88: Matrix on vendor position and classification
  • 10.3 BLANCO GmbH and Co. KG 
    • Exhibit 89: BLANCO GmbH and Co. KG - Overview
    • Exhibit 90: BLANCO GmbH and Co. KG - Product / Service
    • Exhibit 91: BLANCO GmbH and Co. KG - Key offerings
  • 10.4 Dornbracht AG and Co. KG 
    • Exhibit 92: Dornbracht AG and Co. KG - Overview
    • Exhibit 93: Dornbracht AG and Co. KG - Product / Service
    • Exhibit 94: Dornbracht AG and Co. KG - Key news
    • Exhibit 95: Dornbracht AG and Co. KG - Key offerings
  • 10.5 FRANKE Holding AG 
    • Exhibit 96: FRANKE Holding AG - Overview
    • Exhibit 97: FRANKE Holding AG - Business segments
    • Exhibit 98: FRANKE Holding AG - Key news
    • Exhibit 99: FRANKE Holding AG - Key offerings
    • Exhibit 100: FRANKE Holding AG - Segment focus
  • 10.6 Kohler Co. 
    • Exhibit 101: Kohler Co. - Overview
    • Exhibit 102: Kohler Co. - Product / Service
    • Exhibit 103: Kohler Co. - Key news
    • Exhibit 104: Kohler Co. - Key offerings
  • 10.7 Kraus USA Inc. 
    • Exhibit 105: Kraus USA Inc. - Overview
    • Exhibit 106: Kraus USA Inc. - Product / Service
    • Exhibit 107: Kraus USA Inc. - Key news
    • Exhibit 108: Kraus USA Inc. - Key offerings
  • 10.8 Moen Inc. 
    • Exhibit 109: Moen Inc. - Overview
    • Exhibit 110: Moen Inc. - Product / Service
    • Exhibit 111: Moen Inc. - Key offerings
  • 10.9 Roca Sanitario SA 
    • Exhibit 112: Roca Sanitario SA - Overview
    • Exhibit 113: Roca Sanitario SA - Product / Service
    • Exhibit 114: Roca Sanitario SA - Key offerings
  • 10.10 Ruvati 
    • Exhibit 115: Ruvati - Overview
    • Exhibit 116: Ruvati - Product / Service
    • Exhibit 117: Ruvati - Key news
    • Exhibit 118: Ruvati - Key offerings
  • 10.11 TEKA INDUSTRIAL S.A. 
    • Exhibit 119: TEKA INDUSTRIAL S.A. - Overview
    • Exhibit 120: TEKA INDUSTRIAL S.A. - Product / Service
    • Exhibit 121: TEKA INDUSTRIAL S.A. - Key offerings
  • 10.12 VIGO INDUSTRIES LLC. 
    • Exhibit 122: VIGO INDUSTRIES LLC. - Overview
    • Exhibit 123: VIGO INDUSTRIES LLC. - Product / Service
    • Exhibit 124: VIGO INDUSTRIES LLC. - Key offerings

11 Appendix

  • 11.1 Scope of the report
  • 11.2 Inclusions and exclusions checklist 
    • Exhibit 125: Inclusions checklist
    • Exhibit 126: Exclusions checklist
  • 11.3 Currency conversion rates for US$ 
    • Exhibit 127: Currency conversion rates for US$
  • 11.4 Research methodology 
    • Exhibit 128: Research methodology
    • Exhibit 129: Validation techniques employed for market sizing
    • Exhibit 130: Information sources
  • 11.5 List of abbreviations 
    • Exhibit 131: List of abbreviations
About Us

Technavio is a leading global technology research and advisory company. Their research and analysis focus on emerging market trends and provide actionable insights to help businesses identify market opportunities and develop effective strategies to optimize their market positions. With over 500 specialized analysts, Technavio's report library consists of more than 17,000 reports and counting, covering 800 technologies, spanning across 50 countries. Their client base consists of enterprises of all sizes, including more than 100 Fortune 500 companies. This growing client base relies on Technavio's comprehensive coverage, extensive research, and actionable market insights to identify opportunities in existing and potential markets and assess their competitive positions within changing market scenarios.

Contact
Technavio Research
Jesse Maida
Media & Marketing Executive
US: +1 844 364 1100
UK: +44 203 893 3200
Email: media@technavio.com
Website: www.technavio.com/

View original content to download multimedia:https://www.prnewswire.com/news-releases/kitchen-sinks-market-size-to-grow-by-usd-533-96-million-from-2021-to-2026-a-descriptive-analysis-of-customer-landscape-vendor-assessment-and-market-dynamics---technavio-301720063.html

SOURCE Technavio

Read More

Continue Reading

Uncategorized

When words make you sick

In a new book, experts in a variety of fields explore nocebo effects – how negative expectations concerning health can make a person sick. It is the…

Published

on

In a new book, experts in a variety of fields explore nocebo effects – how negative expectations concerning health can make a person sick. It is the first time a book has been written on this subject.

“I think it’s the idea that words really matter. It’s fascinating that how we communicate can affect the outcome. Communication in health care is perhaps more important than the patient recognises,” says Charlotte Blease, who is a researcher at the Department of Women’s and Children’s Health at Uppsala University. 
Along with colleagues at Brown University in the United States and the University of Zurich in Switzerland she has written the book “The Nocebo Effect: When Words Make You Sick”. Nocebo is sometimes called the placebo’s evil twin. A placebo effect occurs when a patient thinks they feel better because of receiving medicine and part of that perception is due not to the drug but to positive expectations. The concept of the nocebo effect means that harmful things can happen because a person expects it – unconsciously or consciously. This is the first time the phenomenon has been addressed in a scholarly book. Researchers in medicine, history, culture, psychology and philosophy have examined it, each in their own particular area. 

Credit: Catherine Blease

In a new book, experts in a variety of fields explore nocebo effects – how negative expectations concerning health can make a person sick. It is the first time a book has been written on this subject.

“I think it’s the idea that words really matter. It’s fascinating that how we communicate can affect the outcome. Communication in health care is perhaps more important than the patient recognises,” says Charlotte Blease, who is a researcher at the Department of Women’s and Children’s Health at Uppsala University. 
Along with colleagues at Brown University in the United States and the University of Zurich in Switzerland she has written the book “The Nocebo Effect: When Words Make You Sick”. Nocebo is sometimes called the placebo’s evil twin. A placebo effect occurs when a patient thinks they feel better because of receiving medicine and part of that perception is due not to the drug but to positive expectations. The concept of the nocebo effect means that harmful things can happen because a person expects it – unconsciously or consciously. This is the first time the phenomenon has been addressed in a scholarly book. Researchers in medicine, history, culture, psychology and philosophy have examined it, each in their own particular area. 

“It’s a very new field, an emerging discipline. Even if the nocebo effect is documented far back in history, it perhaps became especially obvious during the coronavirus pandemic,” Blease says.

A previous study of patients during the pandemic (see below) shows that as many as three quarters of the reported side-effects of the coronavirus vaccine may be due to the nocebo effect. The study involved more than 45,000 participants, approximately half of whom were injected with a saline solution instead of the vaccine but despite this still experienced many side-effects such as nausea and headache. In the book, the authors highlight that one issue that disappeared in the discussion of side-effects during the coronavirus pandemic was that many of these were actually due to the nocebo effect.

“Whether this is due to expectations – the nocebo effect – remains to be understood. However, it is curious that so many participants reported side-effects after receiving no vaccine. Regardless, some people may have been put off by what they heard about side-effects,” Blease comments.


Read More

Continue Reading

Uncategorized

Manufacturing and construction vs. the still-inverted yield curve

  – by New Deal democratProf. Menzie Chinn at Econbrowser makes the point that the yield curve is still inverted, and has not yet eclipsed the longest…

Published

on


 - by New Deal democrat


Prof. Menzie Chinn at Econbrowser makes the point that the yield curve is still inverted, and has not yet eclipsed the longest previous time between onset of such an inversion and a recession. So he believes the threat of recession is still on the table.


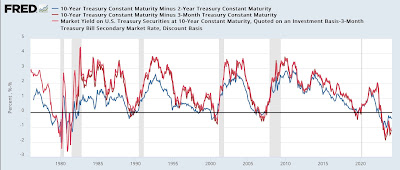
And he’s correct about the yield curve, although it is getting very long in the tooth. In the past half century, the shortest time between a 10 minus 2 year inversion (blue in the graph below) to recession has been 10 months (1980) and the longest 22 months (2007). For the 10 year minus 3 month inversion (red), the shortest time has been 8 months (1980 and 2001) and the longest has been 17 months (2007):


At present the former yield curve has been inverted for 20.5 months, and the latter for 16.5 months. So if there is no recession by May 1, we’re in uncharted territory as far as the yield curve indicator is concerned.

My view for the past half year or so has been much more cautious. While there has been nearly unprecedented Fed tightening (only the 1980-81 tightening was more severe), on the other hand there was massive pandemic stimulus, and what I described on some occasions as a “hurricane force tailwind” of supply chain unkinking. If the two positive forces have abated, does the negative force of the Fed tightening, which is still in place, now take precedence? Or because interest rates have plateaued in the past year, is it too something of a spent force? Since I confess not to know, because the situation is unprecedented in the modern era for which most data is available, I have highlighted turning to the short leading metrics. Do they remain steady or improve? Or do they deteriorate as they have before prior recessions?

First of all, let me show the NY Fed’s Global Supply Chain Index, which attempts to disaggregate supply sided information from demand side information. A positive value shows relative tightening, a negative loosening:


You can see the huge pandemic tightening in 2020 into 2022, followed by a similarly large loosening through 2023. For the past few months, the Index has been close to neutral, or shown very slight tightness.

Typically in the past Fed tightenings have operated through two main channels: housing and manufacturing, especially durable goods manufacturing.

Let’s take the two in reverse order.

Manufacturing has at very least stalled, and by some measures turned down to recessionary levels.  Last week I discussed industrial production (not shown), which peaked in late 2022 and has continued to trend sideways to slightly negative right through February.

A very good harbinger with a record going back 75 years has been the ISM manufacturing index. Here’s its historical record through about 10 years ago (when FRED discontinued publishing it):


And here is its record for the past several years:


This index was frankly recessionary for almost all of last year. It is still negative, although not so much as before.

Two other metrics with lengthy records are the average hourly workweek in manufacturing (blue, right scale), which is one of the 10 “official” leading indicators, as well as real spending on durable goods (red, measured YoY for ease of comparison, left scale):


As a general rule, if real spending on durable goods turns negative YoY for more than an isolated month, a recession has started (with the peak in absolute terms coming before). Also, since employers generally cut hours before cutting jobs, a decline of about 0.8% of an hour in the average manufacturing workweek has typically preceded a recession - with the caveat in modern times that it must fall to at least roughly 40.5 hours:


The average manufacturing workweek has met the former criteria for the last 9 months, and the latter since November. By contrast, real spending on durable goods was up 0.7% YoY as of the last report for January, and in December had made an all-time record high.

But if some of the manufacturing data has met the historical criteria for a recession warning, it is important to note that manufacturing is less of US GDP than before the year 2000, and had been down more in 2015-16 without a recession occurring.

Further, housing construction has not meaningfully constricted at all. The below graph shows the leading metric of housing permits (another “official” component of the LEI, right scale), together with housing units under construction (gold, *1.2 for scale, right scale), and also real GDP q/q (red, left scale):


Housing permits declined -30% after the Fed began tightening, which has normally been enough to trigger a recession. *BUT* the actual measure of economic activity, housing units under construction, has barely turned down at all. In comparison to past downturns, where typically it had fallen at least 10%, and more often 20%, before a recession had begun, as of last month it was only 2% off peak!

The only other two occasions where housing permits declined comparably with no recession ensuing - 1966 and 1986 - real gross domestic product increased robustly. This was similarly the case in 2023.

An important reason is the other historical reason proppin up expansions: stimulative government spending. Here’s the historical record comparing fiscal surpluses vs. deficits:


Note the abrupt end of stimulative spending in 1937, normally thought to have been the prime driver of the steep 1938 recession. Note also the big “Great Society” stimulative spending in 1966-68, when a downturn was averted (indeed, although not shown in the first graph above, there was an inverted yield curve then as well). Needless to say, there as been a great deal of stimulative fiscal spending since 2020 as well.

Fed tightening typically works by constricting demand. Both government stimulus and the unkinking of supply chains work to stimulate supply. 

All of which leads to the conclusion that, while manufacturing has reacted to the tightening, the *real* measure of construction activity has not, or not sufficiently to be recessionary.

Tomorrow housing permits, starts, and units under construction will all be updated. Unless there is a sharp decline in units under construction, there is no short term recession signal at all.

Read More

Continue Reading

Uncategorized

Half Of Downtown Pittsburgh Office Space Could Be Empty In 4 Years

Half Of Downtown Pittsburgh Office Space Could Be Empty In 4 Years

Authored by Mike Shedlock via MishTalk.com,

The CRE implosion is picking…

Published

on

Half Of Downtown Pittsburgh Office Space Could Be Empty In 4 Years

Authored by Mike Shedlock via MishTalk.com,

The CRE implosion is picking up steam.

Check out the grim stats on Pittsburgh.

Unions are also a problem in Pittsburgh as they are in Illinois and California.

Downtown Pittsburgh Implosion

The Post Gazette reports nearly half of Downtown Pittsburgh office space could be empty in 4 years.

Confidential real estate information obtained by the Pittsburgh Post-Gazette estimates that 17 buildings are in “significant distress” and another nine are in “pending distress,” meaning they are either approaching foreclosure or at risk of foreclosure. Those properties represent 63% of the Downtown office stock and account for $30.5 million in real estate taxes, according to the data.

It also calculates the current office vacancy rate at 27% when subleases are factored in — one of the highest in the country.

And with an additional three million square feet of unoccupied leased space becoming available over the next five years, the vacancy rate could soar to 46% by 2028, based on the data.

Property assessments on 10 buildings, including U.S. Steel Tower, PPG Place, and the Tower at PNC Plaza, have been slashed by $364.4 million for the 2023 tax year, as high vacancies drive down their income.

Another factor has been the steep drop — to 63.5% from 87.5% — in the common level ratio, the number used to compute taxable value in county assessment appeal hearings.

The assessment cuts have the potential to cost the city, the county, and the Pittsburgh schools nearly $8.4 million in tax refunds for that year alone. Downtown represents nearly 25% of the city’s overall tax base.

In response Pittsburgh City Councilman Bobby Wilson wants to remove a $250,000 limit on the amount of tax relief available to a building owner or developer as long as a project creates at least 50 full-time equivalent jobs.

It’s unclear if the proposal will be enough. Annual interest costs to borrow $1 million have soared from $32,500 at the start of the pandemic in 2020 to $85,000 on March 1. Local construction costs have increased by about 30% since 2019.

But the city is doomed if it does nothing. Aaron Stauber, president of Rugby Realty said it will probably empty out Gulf Tower and mothball it once all existing leases expire.

“It’s cheaper to just shut the lights off,” he said. “At some point, we would move on to greener pastures.”

Where’s There’s Smoke There’s Unions

In addition to the commercial real estate woes, the city is also wrestling with union contracts.

Please consider Sounding the alarm: Pittsburgh Controller’s letter should kick off fiscal soul-searching

It’s only March, and Pittsburgh’s 2024 house-of-cards operating budget is already falling down. That’s the clear implication of a letter sent by new City Controller Rachael Heisler to Mayor Ed Gainey and members of City Council on Wednesday afternoon.

The letter is a rare and welcome expression of urgency in a city government that has fallen in complacency — and is close to falling into fiscal disaster.

The approaching crisis was thrown into sharp relief this week, when City Council approved amendments to the operating budget accounting for a pricey new contract with the firefighters union. The Post-Gazette Editorial Board had predicted that this contract — plus two others yet to be announced and approved — would demonstrate the dishonesty of Mayor Ed Gainey’s budget, and that’s exactly what’s happening: The new contract is adding $11 million to the administration’s artificially low 5-year spending projections, bringing expected 2028 reserves to just barely the legal limit.

But there’s still two big contracts to go, with the EMS union and the Pittsburgh Joint Collective Bargaining Committee, which covers Public Works workers. Worse, there are tens — possibly hundreds — of millions in unrealistic revenues still on the books. On this, Ms. Heisler’s letter only scratched the surface.

Similarly, as we have observed, the budget’s real estate tax revenue projections are radically inconsistent with reality. Due to high vacancies and a sharp reduction in the common level ratio, a significant drop in revenues was predictable — but not reflected in the budget. Ms. Heisler’s estimate of a 20% drop in revenues from Downtown property, or $5.3 million a year, may even be optimistic: Other estimates peg the loss at twice that, or more.

Left unmentioned in the letter are massive property tax refunds the city will owe, as well as fanciful projections of interest income that are inconsistent with the dwindling reserves, and drawing-down of federal COVID relief funds, predicted in the budget itself. That’s another unrealistic $80 million over five years.

Pittsburgh exited Act 47 state oversight after nearly 15 years on Feb. 12, 2018, with a clean bill of fiscal health. 

It has already ruined that bill of health.

Act 47 in Pittsburgh

Flashback February 21, 2018Act 47 in Pittsburgh: What Was Accomplished?

Pittsburgh’s tax structure was a much-complained-about topic leading up to the Act 47 declaration. The year following Pittsburgh’s designation as financially distressed under Act 47 it levied taxes on real estate, real estate transfers, parking, earned income, business gross receipts (business privilege and mercantile), occupational privilege and amusements. The General Assembly enacted tax reforms in 2004 giving the city authority to levy a payroll preparation tax in exchange for the immediate elimination of the mercantile tax and the phase out of the business privilege tax. The tax reforms increased the amount of the occupational privilege tax from $10 to $52 (this is today known as the local services tax and all municipalities outside of Philadelphia levy it and could raise it thanks to the change for Pittsburgh).

The coordinators recommended an increase in the deed transfer tax, which occurred in late 2004 (it was just increased again by City Council) and in the real estate tax, which increased in 2015.

Legacy costs, principally debt and underfunded pensions, were the primary focus of the 2009 amended recovery plan. The city’s pension funded ratio has increased significantly from where it stood a decade ago, rising from the mid-30 percent range to over 60 percent at last measurement.

The obvious question? Will the city stick to the steps taken to improve financially and avoid slipping back into distressed status? If Pittsburgh once stood “on the precipice of full-blown crisis,” as described in the first recovery plan, hopefully it won’t return to that position.

The Obvious Question

I could have answered the 2018 obvious question with the obvious answer. Hell no.

No matter how much you raise taxes, it will never be enough because public unions will suck every penny and want more.

On top of union graft, and insanely woke policies in California, we have an additional huge problem.

Hybrid Work Leaves Offices Empty and Building Owners Reeling

Hybrid work has put office building owners in a bind and could pose a risk to banks. Landlords are now confronting the fact that some of their office buildings have become obsolete, if not worthless.

Meanwhile, in Illinois …

Chicago Teachers’ Union Seeks $50 Billion Despite $700 Million City Deficit

Please note the Chicago Teachers’ Union Seeks $50 Billion Despite $700 Million City Deficit

The CTU wants to raise taxes across the board, especially targeting real estate.

My suggestion, get the hell out...

Tyler Durden Mon, 03/18/2024 - 12:10

Read More

Continue Reading

Trending