Invesco Reports Results for the Three Months Ended June 30, 2022
Invesco Reports Results for the Three Months Ended June 30, 2022
PR Newswire
ATLANTA, July 27, 2022
Invesco Announces Second Quarter Diluted EPS of $0.26; Adjusted Diluted EPS(1) of $0.39
ATLANTA, July 27, 2022 /PRNewswire/ — Invesco Ltd. (NYSE: I…
Share this:

Invesco Reports Results for the Three Months Ended June 30, 2022
PR Newswire
ATLANTA, July 27, 2022
Invesco Announces Second Quarter Diluted EPS of $0.26; Adjusted Diluted EPS(1) of $0.39
ATLANTA, July 27, 2022 /PRNewswire/ -- Invesco Ltd. (NYSE: IVZ) today reported financial results for the three months ended June 30, 2022.
- $6.8 billion of net long-term outflows, resilience in key capability areas with net long-term inflows of $4.8 billion from ETFs, $2.2 billion from Active Fixed Income and $2.2 billion from our China joint venture
- $1,390.4 billion in ending AUM, a decrease of 10.6% from the prior quarter
- 22.5% operating margin; 35.1% adjusted operating margin(1)
- Completed early redemption of the $600 million in Senior Notes due in November 2022
Update from Marty Flanagan, President and CEO
"The market environment for the first half of this year has been one of the most challenging in decades. Against this backdrop for the industry, and despite seeing the first net long-term outflow quarter in two years, our diversified product lineup maintained net inflows in key capability areas, notably ETFs, Active Fixed Income, and Greater China, where we maintain leadership positions.
"Our focus on building a stronger balance sheet has afforded us much greater flexibility as we weather this volatile period. In May, we took advantage of an economically attractive opportunity to redeem early $600 million of debt. As a result, total debt outstanding at the end of the second quarter was the lowest level in seven years and our leverage profile continues to improve. As we look to the future, we are committed to continuing to scale our global platform and delivering positive operating leverage as markets recover, while continuing to invest in our key capability areas.
"In this uncertain environment, clients seek an investment manager that can partner with them to meet a comprehensive range of constantly evolving needs and solve their most challenging problems. Our broad set of investment capabilities and the differentiated platform we've built position us well to continue to meet our clients' needs and compete in a dynamic market environment."
(1) | Represents non-GAAP financial measure. See the information on pages 7 through 10 for a reconciliation to the most directly comparable U.S. GAAP measure. |
Net Flows:
Net long-term outflows were $6.8 billion for the second quarter of 2022, compared to inflows of $17.2 billion in the first quarter of 2022. Active net long-term outflows for the quarter were $11.3 billion, which were partially offset by inflows of $4.5 billion from Passive AUM.
Retail net long-term outflows were $8.3 billion while institutional net long-term inflows were $1.5 billion. Net long-term flows by asset class include net long-term inflows of $4.8 billion in fixed income products offset by outflows of $7.7 billion in equity products, $2.3 billion in balanced products and $1.6 billion in alternative products. On a geographic basis, the Americas, UK and EMEA ex UK experienced net long-term outflows of $3.9 billion, $1.9 billion and $1.1 billion, respectively.
Net market losses and foreign exchange rate movements decreased AUM by $142.3 billion and $19.7 billion, respectively, in the second quarter. We had inflows of $3.5 billion into money market funds and outflows of $2.0 billion from non-management fee earning products during the quarter. Ending AUM decreased 10.6%, while average AUM decreased 5.7% in the second quarter compared to the first quarter.
Summary of net flows (in billions) | Q2-22 | Q1-22 | Q2-21 | |||
Active | $ (11.3) | $ 0.8 | $ 2.1 | |||
Passive | 4.5 | 16.4 | 29.0 | |||
Net long-term flows | (6.8) | 17.2 | 31.1 | |||
Non-management fee earning AUM | (2.0) | (1.0) | 2.5 | |||
Money market | 3.5 | 12.8 | 19.8 | |||
Total net flows | $ (5.3) | $ 29.0 | $ 53.4 | |||
Annualized long-term organic growth rate (1) | (2.4) % | 5.8 % | 10.6 % | |||
(1) | Annualized long-term organic growth rate is calculated using net long-term flows (annualized) divided by average long-term AUM for the period. Long-term AUM excludes money market and non-management fee earning AUM. |
Second Quarter Highlights:
Financial Results | Q2-22 | Q1-22 | Q2-22 vs. | Q2-21 | Q2-22 vs. | ||||
U.S. GAAP Financial Measures | |||||||||
Operating revenues | $1,530.4m | $1,629.4m | (6.1) % | $1,721.4m | (11.1) % | ||||
Operating income | $344.7m | $377.7m | (8.7) % | $470.9m | (26.8) % | ||||
Operating margin | 22.5 % | 23.2 % | 27.4 % | ||||||
Net income attributable to Invesco Ltd. | $121.0m | $197.7m | (38.8) % | $368.3m | (67.1) % | ||||
Diluted EPS | $0.26 | $0.43 | (39.5) % | $0.79 | (67.1) % | ||||
Adjusted Financial Measures(1) | |||||||||
Net revenues | $1,173.9m | $1,252.4m | (6.3) % | $1,302.9m | (9.9) % | ||||
Adjusted operating income | $411.9m | $494.6m | (16.7) % | $540.5m | (23.8) % | ||||
Adjusted operating margin | 35.1 % | 39.5 % | 41.5 % | ||||||
Adjusted net income attributable to Invesco Ltd. | $180.3m | $259.3m | (30.5) % | $364.7m | (50.6) % | ||||
Adjusted diluted EPS | $0.39 | $0.56 | (30.4) % | $0.78 | (50.0) % | ||||
Assets Under Management | |||||||||
Ending AUM | $1,390.4bn | $1,555.9bn | (10.6) % | $1,525.0bn | (8.8) % | ||||
Average AUM | $1,457.2bn | $1,545.1bn | (5.7) % | $1,480.2bn | (1.6) % | ||||
Headcount | 8,506 | 8,549 | (0.5) % | 8,483 | 0.3 % |
(1) | Represents non-GAAP financial measure. See the information on pages 7 through 10 for a reconciliation to the most directly comparable U.S. GAAP measure. |
U.S. GAAP Operating Results:
Second Quarter 2022 compared to First Quarter 2022
Operating revenues and expenses: Lower average AUM driven by market declines, changes in foreign exchange rates on AUM and net outflows resulted in a decrease in operating revenues of $99.0 million in the second quarter compared to the first quarter. Investment management fees decreased by $67.0 million during the period, which was net of the favorable impact of lower money market waivers of $20.5 million. Service and distribution fees decreased $25.2 million. Performance fees were $9.2 million for the second quarter, an increase of $8.2 million from the previous quarter. Other revenues decreased $15.0 million in the second quarter, resulting from lower front end fees and real estate disposition fees. Foreign exchange rate changes in the second quarter decreased operating revenues by $19.9 million.
Operating expenses decreased $66.0 million in the second quarter as compared to the first quarter. Third party distribution, service and advisory costs were down $37.6 million during the quarter resulting from lower average AUM. Employee compensation expense decreased $25.7 million in the second quarter. The decrease resulted primarily from lower seasonal payroll taxes and variable compensation costs. Marketing expenses were up $12.1 million, reflecting higher advertising and client event costs. General and administrative expenses were up $17.5 million in the second quarter, primarily driven by $14 million of net fund-related expenses. Increased travel costs also contributed to the rise in marketing and general and administrative costs in the second quarter as travel activity returned to more normalized levels with the easing of COVID-19-related travel restrictions. Transaction, integration and restructuring costs decreased $35.0 million in the second quarter to $0.2 million. During the quarter, restructuring costs were almost fully offset by $15 million of ongoing insurance recoveries related to the OppenheimerFunds acquisition-related matter. Foreign exchange rate changes in the second quarter decreased operating expenses by $17.8 million.
Non-operating income and expenses: Equity in earnings of unconsolidated affiliates was $24.7 million, earned primarily from our China joint venture. Other gains and losses was a net loss of $90.0 million, driven by market value changes on deferred compensation and seed money investments. Other net income/(expense) of consolidated investment products (CIP) was a gain of $26.2 million, primarily driven by market gains on the underlying investments held by the funds, which are generally recorded on a one to three month lag.
The effective tax rate was 22.3% in the second quarter as compared to 25.9% in the first quarter. The decrease in the effective tax rate in the second quarter is primarily due to the increase in income attributable to interests in CIP.
Diluted earnings per common share: Diluted earnings per common share was $0.26 for the second quarter of 2022.
Second Quarter 2022 compared to Second Quarter 2021
Operating revenues and expenses: Lower average AUM driven by market declines, changes in foreign exchange rates on AUM and net AUM outflows resulted in a decrease in operating revenues of $191.0 million in the second quarter of 2022 compared to the second quarter of 2021. Investment management fees decreased by $133.9 million during the period, which was net of the favorable impact of lower money market waivers of $35.5 million. Service and distribution fees decreased by $47.2 million. Performance fees were $9.2 million for the second quarter, a decrease of $1.3 million from the second quarter of 2021. Other revenues decreased $8.6 million, resulting from lower front end fees. Foreign exchange rate changes in the second quarter of 2022 decreased operating revenues by $39.6 million.
Operating expenses decreased $64.8 million compared to the second quarter of 2021. Third party distribution, service and advisory costs were down $64.6 million resulting from lower average AUM. Employee compensation expense decreased $79.8 million compared to the second quarter of 2021. The decrease was primarily comprised of fair value changes on deferred compensation liabilities and reduced variable compensation. Marketing expenses rose by $9.3 million, related to increased client events and advertising. General administrative expenses increased by $16.4 million primarily driven by a net $14 million of fund-related expenses. Increased travel costs also contributed to the rise in marketing and general and administrative costs in the second quarter as travel activity returned to more normalized levels with the easing of COVID-19-related travel restrictions. Transaction, integration and restructuring costs increased to an expense of $0.2 million in the second quarter of 2022 from a benefit of $47.1 million in the second quarter of 2021. Foreign exchange rate changes in the second quarter of 2022 decreased operating expenses by $37.6 million.
The effective tax rate was 22.3% in the second quarter of 2022 as compared to 23.7% in the second quarter of 2021. The effective tax rate was higher in the second quarter of 2021 primarily due to an increase in tax expense related to the remeasurement of deferred tax assets and liabilities following the enactment of an increase in the UK corporate tax rate, which was partially offset by the change in the mix of income across tax jurisdiction in the second quarter of 2022.
Adjusted(1) Operating Results:
Second Quarter 2022 compared to First Quarter 2022
Net revenues decreased $78.5 million or 6.3% as compared to the first quarter, resulting from lower average AUM. The impact of decreased investment management fees, service and distribution fees and other revenues was partially offset by lower third party distribution, service and advisory costs.
Adjusted operating expenses increased 0.6% in the second quarter to $762.0 million from $757.8 million in the first quarter, reflecting increased marketing and general and administrative costs partially offset by lower employee compensation costs.
Adjusted operating income decreased $82.7 million to $411.9 million in the second quarter from $494.6 million in the first quarter. Adjusted operating margin declined to 35.1% from 39.5% for the prior quarter.
Adjusted diluted earnings per common share decreased to $0.39 as a result of lower operating income, net market losses on our investments and lower equity in earnings compared to the first quarter. The effective tax rate on adjusted net income increased to 24.8% in the second quarter from 24.2% in the first quarter.
Second Quarter 2022 compared to Second Quarter 2021
Net revenues decreased $129.0 million or 9.9% as compared to the second quarter of 2021, resulting from lower average AUM. The impact of decreased investment management fees, service and distribution fees and other revenues was partially offset by lower third party distribution, service and advisory costs.
Adjusted operating expenses decreased $0.4 million or 0.1% to $762.0 million from $762.4 million in the second quarter of 2021, reflecting lower employee compensation costs offset by higher marketing, general and administrative and property, office and technology costs.
Adjusted operating income decreased $128.6 million to $411.9 million from $540.5 million in the second quarter of 2021. Adjusted operating margin declined to 35.1% from 41.5% for the prior year quarter.
Adjusted diluted earnings per common share decreased to $0.39 as a result of lower operating income, net market losses on our investments and lower equity in earnings in the second quarter of 2022, compared to the second quarter of 2021. The effective tax rate on adjusted net income increased to 24.8% in the second quarter of 2022 from 22.8% in the second quarter of 2021. The rate increase is primarily due to the change in the mix of income across tax jurisdictions.
(1) | Represents non-GAAP financial measure. See the information on pages 7 through 10 for a reconciliation to the most directly comparable U.S. GAAP measure. |
Capital Management:
Cash and cash equivalents: $936.8 million at June 30, 2022 ($1,309.6 million as of March 31, 2022).
Debt: $1,671.2 million at June 30, 2022 ($2,085.7 million as of March 31, 2022). The credit facility balance was $184.6 million at June 30, 2022 (zero as of March 31, 2022).
On May 6, 2022, the company redeemed the $600 million Senior Notes due November 30, 2022.
Common shares outstanding (end of period): 454.9 million
Diluted common shares outstanding (end of period): 459.6 million
Dividends paid: $85.6 million (common); $59.2 million (preferred)
Common dividends declared: The company is announcing a second quarter cash dividend of $0.1875 per share to holders of common shares. The dividend is payable on September 2, 2022, to common shareholders of record at the close of business on August 12, 2022, with an ex-dividend date of August 11, 2022.
Preferred dividends declared: The company is announcing a preferred cash dividend of $14.75 per share representing the period from June 1, 2022 through August 31, 2022. The preferred dividend is payable on September 1, 2022 to preferred shareholders of record at the close of business on August 15, 2022.
About Invesco Ltd.
Invesco is a global independent investment management firm dedicated to delivering an investment experience that helps people get more out of life. Our distinctive investment teams deliver a comprehensive range of active, passive and alternative investment capabilities. With offices in more than 20 countries, Invesco managed $1.4 trillion in assets on behalf of clients worldwide as of June 30, 2022. For more information, visit invesco.com/corporate.
Members of the investment community and general public are invited to listen to the conference call today, July 27, 2022, at 9:00 a.m. ET by dialing one of the following numbers: 1-866-803-2143 for U.S. and Canadian callers or 1-210-795-1098 for international callers, using the Passcode: Invesco. An audio replay of the conference call will be available until Tuesday, August 9, 2022 at 5:00 p.m. ET by calling 1-888-566-0411 for U.S. and Canadian callers or 1-203-369-3041 for international callers. A presentation highlighting the company's performance will be available during a live Webcast and on Invesco's Website at invesco.com/corporate.
This release, and comments made in the associated conference call today, may include "forward-looking statements." Forward-looking statements include information concerning future results of our operations, expenses, earnings, liquidity, cash flow and capital expenditures, industry or market conditions, assets under management, geopolitical events and the COVID-19 pandemic and their respective potential impact on the company, acquisitions and divestitures, debt and our ability to obtain additional financing or make payments, regulatory developments, demand for and pricing of our products and other aspects of our business or general economic conditions. In addition, words such as "believes," "expects," "anticipates," "intends," "plans," "estimates," "projects," "forecasts," and future or conditional verbs such as "will," "may," "could," "should," and "would" as well as any other statement that necessarily depends on future events, are intended to identify forward-looking statements.
Forward-looking statements are not guarantees, and they involve risks, uncertainties and assumptions. Although we make such statements based on assumptions that we believe to be reasonable, there can be no assurance that actual results will not differ materially from our expectations. We caution investors not to rely unduly on any forward-looking statements and urge you to carefully consider the risks described in our most recent Form 10-K and subsequent Forms 10-Q, filed with the Securities and Exchange Commission. You may obtain these reports from the SEC's website at www.sec.gov. We expressly disclaim any obligation to update the information in any public disclosure if any forward-looking statement later turns out to be inaccurate.
Investor Relations Contacts:
Media Relations Contact: | Greg Ketron Matt Seitz Graham Galt | 404-724-4299 404-439-4853 404-439-3070 |
Invesco Ltd. | |||||||||
U.S. GAAP Condensed Consolidated Income Statements | |||||||||
(Unaudited, in millions, other than per share amounts) | |||||||||
Q2-22 | Q1-22 | % Change | Q2-21 | % Change | |||||
Operating revenues: | |||||||||
Investment management fees | $ 1,113.5 | $ 1,180.5 | (5.7) % | $ 1,247.4 | (10.7) % | ||||
Service and distribution fees | 353.8 | 379.0 | (6.6) % | 401.0 | (11.8) % | ||||
Performance fees | 9.2 | 1.0 | 820.0 % | 10.5 | (12.4) % | ||||
Other | 53.9 | 68.9 | (21.8) % | 62.5 | (13.8) % | ||||
Total operating revenues | 1,530.4 | 1,629.4 | (6.1) % | 1,721.4 | (11.1) % | ||||
Operating expenses: | |||||||||
Third-party distribution, service and advisory | 475.0 | 512.6 | (7.3) % | 539.6 | (12.0) % | ||||
Employee compensation | 407.2 | 432.9 | (5.9) % | 487.0 | (16.4) % | ||||
Marketing | 33.8 | 21.7 | 55.8 % | 24.5 | 38.0 % | ||||
Property, office and technology | 135.0 | 132.0 | 2.3 % | 127.2 | 6.1 % | ||||
General and administrative | 119.7 | 102.2 | 17.1 % | 103.3 | 15.9 % | ||||
Transaction, integration and restructuring | 0.2 | 35.2 | (99.4) % | (47.1) | N/A | ||||
Amortization of intangible assets | 14.8 | 15.1 | (2.0) % | 16.0 | (7.5) % | ||||
Total operating expenses | 1,185.7 | 1,251.7 | (5.3) % | 1,250.5 | (5.2) % | ||||
Operating income | 344.7 | 377.7 | (8.7) % | 470.9 | (26.8) % | ||||
Other income/(expense): | |||||||||
Equity in earnings of unconsolidated affiliates | 24.7 | 33.4 | (26.0) % | 37.2 | (33.6) % | ||||
Interest and dividend income | 2.1 | 1.2 | 75.0 % | 0.4 | 425.0 % | ||||
Interest expense | (25.8) | (23.2) | 11.2 % | (24.6) | 4.9 % | ||||
Other gains and losses, net | (90.0) | (45.5) | 97.8 % | 43.4 | N/A | ||||
Other income/(expense) of CIP, net | 26.2 | (23.3) | N/A | 122.0 | (78.5) % | ||||
Income before income taxes | 281.9 | 320.3 | (12.0) % | 649.3 | (56.6) % | ||||
Income tax provision | (63.0) | (82.8) | (23.9) % | (154.2) | (59.1) % | ||||
Net income | 218.9 | 237.5 | (7.8) % | 495.1 | (55.8) % | ||||
Net (income)/loss attributable to noncontrolling | (38.7) | 19.4 | N/A | (67.6) | (42.8) % | ||||
Less: Dividends declared on preferred shares | (59.2) | (59.2) | — % | (59.2) | — % | ||||
Net income attributable to Invesco Ltd. | $ 121.0 | $ 197.7 | (38.8) % | $ 368.3 | (67.1) % | ||||
Earnings per common share: | |||||||||
---basic | $0.27 | $0.43 | (37.2) % | $0.80 | (66.3) % | ||||
---diluted | $0.26 | $0.43 | (39.5) % | $0.79 | (67.1) % | ||||
Average common shares outstanding: | |||||||||
---basic | 456.5 | 459.5 | (0.7) % | 462.8 | (1.4) % | ||||
---diluted | 459.5 | 462.4 | (0.6) % | 466.2 | (1.4) % | ||||
Invesco Ltd.
Non-GAAP Information and Reconciliations
We utilize the following non-GAAP performance measures: net revenues (and by calculation, net revenue yield on AUM), adjusted operating income, adjusted operating margin, adjusted net income attributable to Invesco Ltd., and adjusted diluted EPS. We believe the adjusted measures provide valuable insight into our ongoing operational performance and assist in comparisons to our competitors. These measures also assist management with the establishment of operational budgets and forecasts. The most directly comparable U.S. GAAP measures are operating revenues (and by calculation, gross revenue yield on AUM), operating income, operating margin, net income attributable to Invesco Ltd., and diluted EPS.
The following are reconciliations of operating revenues, operating income (and by calculation, operating margin), and net income attributable to Invesco Ltd. (and by calculation, diluted EPS) on a U.S. GAAP basis to a non-GAAP basis of net revenues, adjusted operating income (and by calculation, adjusted operating margin), and adjusted net income attributable to Invesco Ltd. (and by calculation, adjusted diluted EPS). In addition, a reconciliation of adjusted operating expenses is provided below, together with reconciliations of the U.S. GAAP operating expense lines to provide further analysis of the non-GAAP adjustments. These non-GAAP measures should not be considered as substitutes for any U.S. GAAP measures and may not be comparable to other similarly titled measures of other companies. The tax effect of the reconciling items is based on the tax jurisdiction attributable to the transactions. These measures are described more fully in the company's Forms 10-K and 10-Q. Refer to these public filings for additional information about the company's non-GAAP performance measures.
Reconciliation of Operating revenues to Net revenues: | ||||||
in millions | Q2-22 | Q1-22 | Q2-21 | |||
Operating revenues, U.S. GAAP basis | $ 1,530.4 | $ 1,629.4 | $ 1,721.4 | |||
Invesco Great Wall (1) | 106.1 | 124.1 | 110.9 | |||
Revenue Adjustments (2) | ||||||
Investment management fees | (193.1) | (205.9) | (212.8) | |||
Service and distribution fees | (240.3) | (257.7) | (269.7) | |||
Other | (41.6) | (49.0) | (57.1) | |||
Total Revenue Adjustments | $ (475.0) | $ (512.6) | $ (539.6) | |||
CIP | 12.4 | 11.5 | 10.2 | |||
Net revenues | $ 1,173.9 | $ 1,252.4 | $ 1,302.9 | |||
Reconciliation of Operating income to Adjusted operating income: | ||||||
in millions | Q2-22 | Q1-22 | Q2-21 | |||
Operating income, U.S. GAAP basis | $ 344.7 | $ 377.7 | $ 470.9 | |||
Invesco Great Wall (1) | 62.2 | 73.7 | 62.0 | |||
CIP | 16.1 | 14.8 | 19.2 | |||
Transaction, integration and restructuring (3) | 0.2 | 35.2 | (47.1) | |||
Amortization of intangible assets | 14.8 | 15.1 | 16.0 | |||
Compensation expense related to market valuation changes in deferred | (26.1) | (21.9) | 19.5 | |||
Adjusted operating income | $ 411.9 | $ 494.6 | $ 540.5 | |||
Operating margin (4) | 22.5 % | 23.2 % | 27.4 % | |||
Adjusted operating margin (5) | 35.1 % | 39.5 % | 41.5 % | |||
Reconciliation of Net income attributable to Invesco Ltd. to Adjusted net income attributable to Invesco Ltd. | ||||||
in millions | Q2-22 | Q1-22 | Q2-21 | |||
Net income attributable to Invesco Ltd., U.S. GAAP basis | $ 121.0 | $ 197.7 | $ 368.3 | |||
Transaction, integration and restructuring, net of tax (3) | 0.2 | 27.0 | (34.8) | |||
Amortization of intangible assets and related tax benefits (6) | 18.6 | 18.8 | 21.8 | |||
Deferred compensation plan market valuation changes and dividend | 40.5 | 15.8 | (7.6) | |||
Impact of tax rate changes (7) | — | — | 17.0 | |||
Adjusted net income attributable to Invesco Ltd. (8) | $ 180.3 | $ 259.3 | $ 364.7 | |||
Average common shares outstanding - diluted | 459.5 | 462.4 | 466.2 | |||
Diluted EPS | $0.26 | $0.43 | $0.79 | |||
Adjusted diluted EPS (9) | $0.39 | $0.56 | $0.78 | |||
Reconciliation of Operating expenses to Adjusted operating expenses: | ||||||
in millions | Q2-22 | Q1-22 | Q2-21 | |||
Operating expenses, U.S. GAAP basis | $ 1,185.7 | $ 1,251.7 | $ 1,250.5 | |||
Invesco Great Wall (1) | 43.9 | 50.4 | 48.9 | |||
Third party distribution, service and advisory expenses | (475.0) | (512.6) | (539.6) | |||
CIP | (3.7) | (3.3) | (9.0) | |||
Transaction, integration and restructuring (3) | (0.2) | (35.2) | 47.1 | |||
Amortization of intangible assets | (14.8) | (15.1) | (16.0) | |||
Compensation expense related to market valuation changes in deferred | 26.1 | 21.9 | (19.5) | |||
Adjusted operating expenses | $ 762.0 | $ 757.8 | $ 762.4 | |||
Employee compensation, U.S. GAAP basis | $ 407.2 | $ 432.9 | $ 487.0 | |||
Invesco Great Wall (1) | 34.8 | 40.4 | 39.5 | |||
Compensation expense related to market valuation changes in deferred | 26.1 | 21.9 | (19.5) | |||
Adjusted employee compensation | $ 468.1 | $ 495.2 | $ 507.0 | |||
Marketing, U.S. GAAP basis | $ 33.8 | $ 21.7 | $ 24.5 | |||
Invesco Great Wall (1) | 2.6 | 4.4 | 4.1 | |||
Adjusted marketing | $ 36.4 | $ 26.1 | $ 28.6 | |||
Property, office and technology, U.S. GAAP basis | $ 135.0 | $ 132.0 | $ 127.2 | |||
Invesco Great Wall (1) | 5.0 | 3.7 | 3.2 | |||
Adjusted property, office and technology | $ 140.0 | $ 135.7 | $ 130.4 | |||
General and administrative, U.S. GAAP basis | $ 119.7 | $ 102.2 | $ 103.3 | |||
Invesco Great Wall (1) | 1.5 | 1.9 | 2.1 | |||
CIP | (3.7) | (3.3) | (9.0) | |||
Adjusted general and administrative | $ 117.5 | $ 100.8 | $ 96.4 | |||
Transaction, integration and restructuring, U.S. GAAP basis (3) | $ 0.2 | $ 35.2 | $ (47.1) | |||
Transaction, integration and restructuring | (0.2) | (35.2) | 47.1 | |||
Adjusted transaction, integration and restructuring | $ — | $ — | $ — | |||
Amortization of intangible assets, U.S. GAAP basis | $ 14.8 | $ 15.1 | $ 16.0 | |||
Amortization of intangible assets | (14.8) | (15.1) | (16.0) | |||
Adjusted amortization of intangibles | $ — | $ — | $ — | |||
(1) | The company reflects 100% of Invesco Great Wall in its net revenues and adjusted operating expenses. The company's non-GAAP operating results reflect the economics of these holdings on a basis consistent with the underlying AUM and flows. Adjusted net income is reduced by the amount of earnings attributable to noncontrolling interests. |
(2) | The company calculates net revenues by reducing operating revenues to exclude fees that are passed through to external parties who perform functions on behalf of, and distribute, the company's managed funds. The net revenue presentation assists in identifying the revenue contribution generated by the company, removing distortions caused by the differing distribution channel fees and allowing for a fair comparison with U.S. peer investment managers and within Invesco's own investment units. Additionally, management evaluates net revenue yield on AUM, which is equal to net revenues divided by average AUM during the reporting period, as an indicator of the basis point net revenues we receive for each dollar of AUM we manage. |
Investment management fees are adjusted by renewal commissions and certain administrative fees. Service and distribution fees are primarily adjusted by distribution fees passed through to broker dealers for certain share classes and pass through fund-related costs. Other revenues are primarily adjusted by transaction fees passed through to third parties. | |
(3) | In the second quarter of 2022, Invesco received an insurance recovery of $15.0 million related to the OppenheimerFunds acquisition-related matter, which was recorded as a benefit to the Transaction, integration and restructuring expense line item. During the second quarter of 2021, the company recorded an $85.4 million benefit to the Transaction, integration and restructuring line item resulting from an adjustment to the estimated OppenheimerFunds acquisition-related liability. |
(4) | Operating margin is equal to operating income divided by operating revenues. |
(5) | Adjusted operating margin is equal to adjusted operating income divided by net revenues. |
(6) | The company reflects the tax benefit realized on the tax amortization of goodwill and intangibles in adjusted net income. We believe it is useful to include this tax benefit in arriving at the adjusted diluted EPS measure. |
(7) | The second quarter of 2021 included a net non-cash income tax expense of $17.0 million related to the remeasurement of certain deferred tax assets and liabilities due to tax rate changes. |
(8) | The effective tax rate on adjusted net income attributable to Invesco Ltd. is 24.8% (first quarter 2022: 24.2%; second quarter 2021: 22.8%). |
(9) | Adjusted diluted EPS is equal to adjusted net income attributable to Invesco Ltd. divided by the weighted average number of common and restricted common shares outstanding. There is no difference between the calculated earnings per common share amounts presented above and the calculated earnings per common share amounts under the two class method. |
Invesco Ltd. | |||||||
Quarterly Assets Under Management | |||||||
in billions | Q2-22 | Q1-22 | % Change | Q2-21 | |||
Beginning Assets | $1,555.9 | $1,610.9 | (3.4) % | $1,404.1 | |||
Long-term inflows | 81.4 | 106.3 | (23.4) % | 114.4 | |||
Long-term outflows | (88.2) | (89.1) | (1.0) % | (83.3) | |||
Net long-term flows | (6.8) | 17.2 | N/A | 31.1 | |||
Net flows in non-management fee earning AUM (a) | (2.0) | (1.0) | 100.0 % | 2.5 | |||
Net flows in money market funds | 3.5 | 12.8 | (72.7) % | 19.8 | |||
Total net flows | (5.3) | 29.0 | N/A | 53.4 | |||
Reinvested distributions | 1.8 | 0.8 | 125.0 % | 0.9 | |||
Market gains and losses | (142.3) | (80.9) | 75.9 % | 65.6 | |||
Foreign currency translation | (19.7) | (3.9) | 405.1 % | 1.0 | |||
Ending Assets | $1,390.4 | $1,555.9 | (10.6) % | $1,525.0 | |||
Ending long-term AUM | $1,063.7 | $1,184.4 | (10.2) % | $1,199.0 | |||
Average long-term AUM | $1,117.2 | $1,187.7 | (5.9) % | $1,173.9 | |||
Average AUM | $1,457.2 | $1,545.1 | (5.7) % | $1,480.2 | |||
Average QQQ AUM | $169.0 | $189.0 | (10.6) % | $162.7 | |||
in billions | Total AUM | Active(d) | Passive(d) | ||
March 31, 2022 | $1,555.9 | $1,042.7 | $513.2 | ||
Long-term inflows | 81.4 | 48.8 | 32.6 | ||
Long-term outflows | (88.2) | (60.1) | (28.1) | ||
Net long-term flows | (6.8) | (11.3) | 4.5 | ||
Net flows in non-management fee earning AUM (a) | (2.0) | — | (2.0) | ||
Net flows in money market funds | 3.5 | 3.5 | — | ||
Total net flows | (5.3) | (7.8) | 2.5 | ||
Reinvested distributions | 1.8 | 1.8 | — | ||
Market gains and losses | (142.3) | (61.6) | (80.7) | ||
Foreign currency translation | (19.7) | (17.2) | (2.5) | ||
June 30, 2022 | $1,390.4 | $957.9 | $432.5 | ||
Average AUM | $1,457.2 | $989.2 | $468.0 | ||
By channel: (in billions) | Total | Retail | Institutional | ||
March 31, 2022 | $1,555.9 | $1,044.7 | $511.2 | ||
Long-term inflows | 81.4 | 62.4 | 19.0 | ||
Long-term outflows | (88.2) | (70.7) | (17.5) | ||
Net long-term flows | (6.8) | (8.3) | 1.5 | ||
Net flows in non-management fee earning AUM (a) | (2.0) | 0.2 | (2.2) | ||
Net flows in money market funds | 3.5 | 0.4 | 3.1 | ||
Total net flows | (5.3) | (7.7) | 2.4 | ||
Reinvested distributions | 1.8 | 1.7 | 0.1 | ||
Market gains and losses | (142.3) | (132.6) | (9.7) | ||
Foreign currency translation | (19.7) | (7.3) | (12.4) | ||
June 30, 2022 | $1,390.4 | $898.8 | $491.6 | ||
See the footnotes immediately following these tables. |
Invesco Ltd. | |||||||||||
Quarterly Assets Under Management (continued) | |||||||||||
By asset class: (in billions) | Total | Equity | Fixed | Balanced | Money | Alternatives(b) | |||||
March 31, 2022 | $1,555.9 | $780.0 | $323.9 | $79.5 | $162.0 | $210.5 | |||||
Long-term inflows | 81.4 | 35.9 | 29.1 | 3.1 | — | 13.3 | |||||
Long-term outflows | (88.2) | (43.6) | (24.3) | (5.4) | — | (14.9) | |||||
Net long-term flows | (6.8) | (7.7) | 4.8 | (2.3) | — | (1.6) | |||||
Net flows in non-management fee earning AUM (a) | (2.0) | 0.2 | (2.2) | — | — | — | |||||
Net flows in money market funds | 3.5 | — | — | — | 3.5 | — | |||||
Total net flows | (5.3) | (7.5) | 2.6 | (2.3) | 3.5 | (1.6) | |||||
Reinvested distributions | 1.8 | 1.0 | 0.4 | 0.1 | — | 0.3 | |||||
Market gains and losses | (142.3) | (121.9) | (11.6) | (1.8) | 0.6 | (7.6) | |||||
Foreign currency translation | (19.7) | (6.8) | (6.2) | (2.6) | (2.1) | (2.0) | |||||
June 30, 2022 | $1,390.4 | $644.8 | $309.1 | $72.9 | $164.0 | $199.6 | |||||
Average AUM | $1,457.2 | $701.9 | $313.4 | $74.0 | $159.7 | $208.2 | |||||
By client domicile: (in billions) | Total | Americas | Asia | EMEA Ex | UK | ||||
March 31, 2022 | $1,555.9 | $1,091.5 | $239.8 | $169.7 | $54.9 | ||||
Long-term inflows | 81.4 | 49.0 | 15.4 | 15.1 | 1.9 | ||||
Long-term outflows | (88.2) | (52.9) | (15.3) | (16.2) | (3.8) | ||||
Net long-term flows | (6.8) | (3.9) | 0.1 | (1.1) | (1.9) | ||||
Net flows in non-management fee earning AUM (a) | (2.0) | (2.5) | 0.9 | (0.5) | 0.1 | ||||
Net flows in money market funds | 3.5 | 4.0 | (0.4) | (0.1) | — | ||||
Total net flows | (5.3) | (2.4) | 0.6 | (1.7) | (1.8) | ||||
Reinvested distributions | 1.8 | 1.7 | — | — | 0.1 | ||||
Market gains and losses | (142.3) | (116.3) | (3.5) | (19.3) | (3.2) | ||||
Foreign currency translation | (19.7) | (1.0) | (12.5) | (2.4) | (3.8) | ||||
June 30, 2022 | $1,390.4 | $973.5 | $224.4 | $146.3 | $46.2 | ||||
See the footnotes immediately following these tables. |
Invesco Ltd. | |||||||
Quarterly Assets Under Management - Active (d) | |||||||
in billions | Q2-22 | Q1-22 | % Change | Q2-21 | |||
Beginning Assets | $ 1,042.7 | $ 1,082.5 | (3.7) % | $ 1,006.3 | |||
Long-term inflows | 48.8 | 61.7 | (20.9) % | 61.1 | |||
Long-term outflows | (60.1) | (60.9) | (1.3) % | (59.0) | |||
Net long-term flows | (11.3) | 0.8 | N/A | 2.1 | |||
Net flows in money market funds | 3.5 | 12.8 | (72.7) % | 19.8 | |||
Total net flows | (7.8) | 13.6 | N/A | 21.9 | |||
Reinvested distributions | 1.8 | 0.8 | 125.0 % | 0.9 | |||
Market gains and losses | (61.6) | (50.0) | 23.2 % | 35.3 | |||
Foreign currency translation | (17.2) | (4.2) | 309.5 % | 1.6 | |||
Ending Assets | $ 957.9 | $ 1,042.7 | (8.1) % | $ 1,066.0 | |||
Average long-term AUM | $ 829.7 | $ 895.6 | (7.4) % | $ 921.4 | |||
Average AUM | $ 989.2 | $ 1,050.0 | (5.8) % | $ 1,049.1 | |||
By channel: (in billions) | Total | Retail | Institutional | ||
March 31, 2022 | $1,042.7 | $581.9 | $460.8 | ||
Long-term inflows | 48.8 | 30.9 | 17.9 | ||
Long-term outflows | (60.1) | (43.8) | (16.3) | ||
Net long-term flows | (11.3) | (12.9) | 1.6 | ||
Net flows in money market funds | 3.5 | 0.4 | 3.1 | ||
Total net flows | (7.8) | (12.5) | 4.7 | ||
Reinvested distributions | 1.8 | 1.7 | 0.1 | ||
Market gains and losses | (61.6) | (55.5) | (6.1) | ||
Foreign currency translation | (17.2) | (6.6) | (10.6) | ||
June 30, 2022 | $957.9 | $509.0 | $448.9 | ||
By asset class: (in billions) | Total | Equity | Fixed | Balanced | Money | Alternatives(b) | |||||
March 31, 2022 | $1,042.7 | $347.9 | $283.3 | $78.5 | $162.0 | $171.0 | |||||
Long-term inflows | 48.8 | 13.7 | 23.8 | 3.1 | — | 8.2 | |||||
Long-term outflows | (60.1) | (24.5) | (21.6) | (5.4) | — | (8.6) | |||||
Net long-term flows | (11.3) | (10.8) | 2.2 | (2.3) | — | (0.4) | |||||
Net flows in money market funds | 3.5 | — | — | — | 3.5 | — | |||||
Total net flows | (7.8) | (10.8) | 2.2 | (2.3) | 3.5 | (0.4) | |||||
Reinvested distributions | 1.8 | 1.0 | 0.4 | 0.1 | — | 0.3 | |||||
Market gains and losses | (61.6) | (45.5) | (9.6) | (1.7) | 0.6 | (5.4) | |||||
Foreign currency translation | (17.2) | (5.1) | (5.7) | (2.6) | (2.1) | (1.7) | |||||
June 30, 2022 | $957.9 | $287.5 | $270.6 | $72.0 | $164.0 | $163.8 | |||||
Average AUM | $989.2 | $313.1 | $274.4 | $73.1 | $159.7 | $168.9 | |||||
See the footnotes immediately following these tables. |
Invesco Ltd. | |||||||||
Quarterly Assets Under Management - Active (d) (continued) | |||||||||
By client domicile: (in billions) | Total | Americas | Asia | EMEA Ex | UK | ||||
March 31, 2022 | $1,042.7 | $703.2 | $202.3 | $83.3 | $53.9 | ||||
Long-term inflows | 48.8 | 28.7 | 13.8 | 4.5 | 1.8 | ||||
Long-term outflows | (60.1) | (36.3) | (13.2) | (7.0) | (3.6) | ||||
Net long-term flows | (11.3) | (7.6) | 0.6 | (2.5) | (1.8) | ||||
Net flows in non-management fee earning AUM (a) | — | — | 0.1 | (0.1) | — | ||||
Net flows in money market funds | 3.5 | 4.0 | (0.4) | (0.1) | — | ||||
Total net flows | (7.8) | (3.6) | 0.3 | (2.7) | (1.8) | ||||
Reinvested distribution | 1.8 | 1.7 | — | — | 0.1 | ||||
Market gains and losses | (61.6) | (51.2) | (0.9) | (6.5) | (3.0) | ||||
Foreign currency translation | (17.2) | (1.0) | (10.4) | (2.0) | (3.8) | ||||
June 30, 2022 | $957.9 | $649.1 | $191.3 | $72.1 | $45.4 | ||||
See the footnotes immediately following these tables. |
Invesco Ltd. | |||||||
Quarterly Assets Under Management - Passive (d) | |||||||
in billions | Q2-22 | Q1-22 | % Change | Q2-21 | |||
Beginning Assets | $513.2 | $528.4 | (2.9) % | $397.8 | |||
Long-term inflows | 32.6 | 44.6 | (26.9) % | 53.3 | |||
Long-term outflows | (28.1) | (28.2) | (0.4) % | (24.3) | |||
Net long-term flows | 4.5 | 16.4 | (72.6) % | 29.0 | |||
Net flows in non-management fee earning AUM (a) | (2.0) | (1.0) | 100.0 % | 2.5 | |||
Total net flows | 2.5 | 15.4 | (83.8) % | 31.5 | |||
Market gains and losses | (80.7) | (30.9) | 161.2 % | 30.3 | |||
Foreign currency translation | (2.5) | 0.3 | N/A | (0.6) | |||
Ending Assets | $432.5 | $513.2 | (15.7) % | $459.0 | |||
Average long-term AUM | $287.5 | $292.1 | (1.6) % | $252.5 | |||
Average AUM | $468.0 | $495.1 | (5.5) % | $431.1 | |||
Average QQQ AUM | $169.0 | $189.0 | (10.6) % | $162.7 | |||
By channel: (in billions) | Total | Retail | Institutional | ||
March 31, 2022 | $513.2 | $462.8 | $50.4 | ||
Long-term inflows | 32.6 | 31.5 | 1.1 | ||
Long-term outflows | (28.1) | (26.9) | (1.2) | ||
Net long-term flows | 4.5 | 4.6 | (0.1) | ||
Net flows in non-management fee earning AUM (a) | (2.0) | 0.2 | (2.2) | ||
Total net flows | 2.5 | 4.8 | (2.3) | ||
Market gains and losses | (80.7) | (77.1) | (3.6) | ||
Foreign currency translation | (2.5) | (0.7) | (1.8) | ||
June 30, 2022 | $432.5 | $389.8 | $42.7 | ||
By asset class: (in billions) | Total | Equity | Fixed | Balanced | Money | Alternatives(b) | |||||
March 31, 2022 | $513.2 | $432.1 | $40.6 | $1.0 | $— | $39.5 | |||||
Long-term inflows | 32.6 | 22.2 | 5.3 | — | — | 5.1 | |||||
Long-term outflows | (28.1) | (19.1) | (2.7) | — | — | (6.3) | |||||
Net long-term flows | 4.5 | 3.1 | 2.6 | — | — | (1.2) | |||||
Net flows in non-management fee earning AUM (a) | (2.0) | 0.2 | (2.2) | — | — | — | |||||
Total net flows | 2.5 | 3.3 | 0.4 | — | — | (1.2) | |||||
Market gains and losses | (80.7) | (76.4) | (2.0) | (0.1) | — | (2.2) | |||||
Foreign currency translation | (2.5) | (1.7) | (0.5) | — | — | (0.3) | |||||
June 30, 2022 | $432.5 | $357.3 | $38.5 | $0.9 | $— | $35.8 | |||||
Average AUM | $468.0 | $388.8 | $39.0 | $0.9 | $— | $39.3 | |||||
See the footnotes immediately following these tables. |
Invesco Ltd. | |||||||||
Quarterly Assets Under Management - Passive (d) (continued) | |||||||||
By client domicile: (in billions) | Total | Americas | Asia | EMEA Ex | UK | ||||
March 31, 2022 | $513.2 | $388.3 | $37.5 | $86.4 | $1.0 | ||||
Long-term inflows | 32.6 | 20.3 | 1.6 | 10.6 | 0.1 | ||||
Long-term outflows | (28.1) | (16.6) | (2.1) | (9.2) | (0.2) | ||||
Net long-term flows | 4.5 | 3.7 | (0.5) | 1.4 | (0.1) | ||||
Net flows in non-management fee earning AUM (a) | (2.0) | (2.5) | 0.8 | (0.4) | 0.1 | ||||
Total net flows | 2.5 | 1.2 | 0.3 | 1.0 | — | ||||
Market gains and losses | (80.7) | (65.1) | (2.6) | (12.8) | (0.2) | ||||
Foreign currency translation | (2.5) | — | (2.1) | (0.4) | — | ||||
June 30, 2022 | $432.5 | $324.4 | $33.1 | $74.2 | $0.8 | ||||
See the footnotes immediately following these tables. |
Invesco Ltd. | ||||||
Year-to-Date Assets Under Management | ||||||
in billions | June 30, 2022 | June 30, 2021 | % Change | |||
Beginning Assets | $1,610.9 | $1,349.9 | 19.3 % | |||
Long-term inflows | 187.7 | 234.6 | (20.0) % | |||
Long-term outflows | (177.3) | (179.0) | (0.9) % | |||
Net long-term flows | 10.4 | 55.6 | (81.3) % | |||
Net flows in non-management fee earning AUM (a) | (3.0) | 2.6 | N/A | |||
Net flows in money market funds | 16.3 | 27.1 | (39.9) % | |||
Total net flows | 23.7 | 85.3 | (72.2) % | |||
Reinvested distributions | 2.6 | 1.8 | 44.4 % | |||
Market gains and losses | (223.2) | 90.2 | N/A | |||
Foreign currency translation | (23.6) | (2.2) | 972.7 % | |||
Ending Assets | $1,390.4 | $1,525.0 | (8.8) % | |||
Average long-term AUM | $1,152.4 | $1,142.1 | 0.9 % | |||
Average AUM | $1,501.2 | $1,437.7 | 4.4 % | |||
in billions | Total AUM | Active(d) | Passive(d) | ||
December 31, 2021 | $1,610.9 | $1,082.5 | $528.4 | ||
Long-term inflows | 187.7 | 110.5 | 77.2 | ||
Long-term outflows | (177.3) | (121.0) | (56.3) | ||
Net long-term flows | 10.4 | (10.5) | 20.9 | ||
Net flows in non-management fee earning AUM (a) | (3.0) | — | (3.0) | ||
Net flows in money market funds | 16.3 | 16.3 | — | ||
Total net flows | 23.7 | 5.8 | 17.9 | ||
Reinvested distributions | 2.6 | 2.6 | — | ||
Market gains and losses | (223.2) | (111.6) | (111.6) | ||
Foreign currency translation | (23.6) | (21.4) | (2.2) | ||
June 30, 2022 | $1,390.4 | $957.9 | $432.5 | ||
Average AUM | $1,501.2 | $1,019.6 | $481.6 | ||
By channel: (in billions) | Total | Retail | Institutional | ||
December 31, 2021 | $1,610.9 | $1,106.5 | $504.4 | ||
Long-term inflows | 187.7 | 143.5 | 44.2 | ||
Long-term outflows | (177.3) | (141.4) | (35.9) | ||
Net long-term flows | 10.4 | 2.1 | 8.3 | ||
Net flows in non-management fee earning AUM (a) | (3.0) | 0.6 | (3.6) | ||
Net flows in money market funds | 16.3 | 2.5 | 13.8 | ||
Total net flows | 23.7 | 5.2 | 18.5 | ||
Reinvested distributions | 2.6 | 2.4 | 0.2 | ||
Market gains and losses | (223.2) | (206.9) | (16.3) | ||
Foreign currency translation | (23.6) | (8.4) | (15.2) | ||
June 30, 2022 | $1,390.4 | $898.8 | $491.6 | ||
See the footnotes immediately following these tables. |
Invesco Ltd. | |||||||||||
Year-to-Date Asset Under Management (continued) | |||||||||||
By asset class: (in billions) | Total | Equity | Fixed | Balanced | Money | Alternatives(b) | |||||
December 31, 2021 | $1,610.9 | $841.6 | $334.8 | $88.6 | $148.8 | $197.1 | |||||
Long-term inflows | 187.7 | 86.5 | 58.5 | 8.6 | — | 34.1 | |||||
Long-term outflows | (177.3) | (88.6) | (48.9) | (11.7) | — | (28.1) | |||||
Net long-term flows | 10.4 | (2.1) | 9.6 | (3.1) | — | 6.0 | |||||
Net flows in non-management fee earning AUM (a) | (3.0) | 0.6 | (3.6) | — | — | — | |||||
Net flows in money market funds | 16.3 | — | — | — | 16.3 | — | |||||
Total net flows | 23.7 | (1.5) | 6.0 | (3.1) | 16.3 | 6.0 | |||||
Reinvested distributions | 2.6 | 1.2 | 0.7 | 0.2 | — | 0.5 | |||||
Market gains and losses | (223.2) | (188.4) | (24.3) | (10.1) | 1.0 | (1.4) | |||||
Foreign currency translation | (23.6) | (8.1) | (8.1) | (2.7) | (2.1) | (2.6) | |||||
June 30, 2022 | $1,390.4 | $644.8 | $309.1 | $72.9 | $164.0 | $199.6 | |||||
Average AUM | $1,501.2 | $739.3 | $320.6 | $78.8 | $157.1 | $205.4 | |||||
By client domicile: (in billions) | Total | Americas | Asia | EMEA Ex | UK | ||||
December 31, 2021 | 1,610.9 | 1,132.5 | 247.3 | 171.5 | 59.6 | ||||
Long-term inflows | 187.7 | 110.5 | 36.8 | 36.6 | 3.8 | ||||
Long-term outflows | (177.3) | (106.5) | (31.1) | (31.8) | (7.9) | ||||
Net long-term flows | 10.4 | 4.0 | 5.7 | 4.8 | (4.1) | ||||
Net flows in non-management fee earning AUM (a) | (3.0) | (4.7) | 0.8 | 0.6 | 0.3 | ||||
Net flows in money market funds | 16.3 | 16.4 | 0.8 | (0.9) | — | ||||
Total net flows | 23.7 | 15.7 | 7.3 | 4.5 | (3.8) | ||||
Reinvested distributions | 2.6 | 2.5 | — | — | 0.1 | ||||
Market gains and losses | (223.2) | (176.3) | (15.9) | (26.5) | (4.5) | ||||
Foreign currency translation | (23.6) | (0.9) | (14.3) | (3.2) | (5.2) | ||||
June 30, 2022 | 1,390.4 | 973.5 | 224.4 | 146.3 | 46.2 | ||||
See the footnotes immediately following these tables. |
Invesco Ltd. | ||||||
Year-to-Date Assets Under Management - Active (d) | ||||||
in billions | June 30, 2022 | June 30, 2021 | % Change | |||
Beginning Assets | $ 1,082.5 | $ 979.3 | 10.5 % | |||
Long-term inflows | 110.5 | 137.4 | (19.6) % | |||
Long-term outflows | (121.0) | (127.8) | (5.3) % | |||
Net long-term flows | (10.5) | 9.6 | N/A | |||
Net flows in money market funds | 16.3 | 27.1 | (39.9) % | |||
Total net flows | 5.8 | 36.7 | (84.2) % | |||
Reinvested distributions | 2.6 | 1.8 | 44.4 % | |||
Market gains and losses | (111.6) | 49.5 | N/A | |||
Foreign currency translation | (21.4) | (1.3) | 1,546.2 % | |||
Ending Assets | $ 957.9 | $ 1,066.0 | (10.1) % | |||
Average long-term AUM | $ 862.6 | $ 907.1 | (4.9) % | |||
Average AUM | $ 1,019.6 | $ 1,028.8 | (0.9) % | |||
By channel: (in billions) | Total | Retail | Institutional | ||
December 31, 2021 | $1,082.5 | $631.7 | $450.8 | ||
Long-term inflows | 110.5 | 68.0 | 42.5 | ||
Long-term outflows | (121.0) | (87.2) | (33.8) | ||
Net long-term flows | (10.5) | (19.2) | 8.7 | ||
Net flows in money market funds | 16.3 | 2.5 | 13.8 | ||
Total net flows | 5.8 | (16.7) | 22.5 | ||
Reinvested distributions | 2.6 | 2.4 | 0.2 | ||
Market gains and losses | (111.6) | (100.9) | (10.7) | ||
Foreign currency translation | (21.4) | (7.5) | (13.9) | ||
June 30, 2022 | $ 957.9 | $ 509.0 | $ 448.9 | ||
By asset class: (in billions) | Total | Equity | Fixed | Balanced | Money | Alternatives(b) | |||||
December 31, 2021 | $1,082.5 | $389.6 | $293.1 | $87.4 | $148.8 | $163.6 | |||||
Long-term inflows | 110.5 | 32.8 | 48.3 | 8.6 | — | 20.8 | |||||
Long-term outflows | (121.0) | (48.7) | (43.6) | (11.6) | — | (17.1) | |||||
Net long-term flows | (10.5) | (15.9) | 4.7 | (3.0) | — | 3.7 | |||||
Net flows in money market funds | 16.3 | — | — | — | 16.3 | — | |||||
Total net flows | 5.8 | (15.9) | 4.7 | (3.0) | 16.3 | 3.7 | |||||
Reinvested distributions | 2.6 | 1.2 | 0.7 | 0.2 | — | 0.5 | |||||
Market gains and losses | (111.6) | (80.7) | (20.3) | (9.9) | 1.0 | (1.7) | |||||
Foreign currency translation | (21.4) | (6.7) | (7.6) | (2.7) | (2.1) | (2.3) | |||||
June 30, 2022 | $957.9 | $287.5 | $270.6 | $72.0 | $164.0 | $163.8 | |||||
Average AUM | $1,019.6 | $335.9 | $280.8 | $77.7 | $157.1 | $168.1 | |||||
See the footnotes immediately following these tables. |
Invesco Ltd. | |||||||||
Year-to-Date Assets Under Management - Active (d) (continued) | |||||||||
By client domicile: (in billions) | Total | Americas | Asia | EMEA Ex | UK | ||||
December 31, 2021 | $1,082.5 | $724.5 | $208.8 | $90.5 | $58.7 | ||||
Long-term inflows | 110.5 | 63.2 | 33.6 | 10.2 | 3.5 | ||||
Long-term outflows | (121.0) | (71.8) | (27.9) | (13.9) | (7.4) | ||||
Net long-term flows | (10.5) | (8.6) | 5.7 | (3.7) | (3.9) | ||||
Net flows in non-management fee earning AUM (a) | — | — | 0.1 | (0.1) | — | ||||
Net flows in money market funds | 16.3 | 16.4 | 0.8 | (0.9) | — | ||||
Total net flows | 5.8 | 7.8 | 6.6 | (4.7) | (3.9) | ||||
Reinvested distributions | 2.6 | 2.5 | — | — | 0.1 | ||||
Market gains and losses | (111.6) | (84.8) | (11.4) | (11.1) | (4.3) | ||||
Foreign currency translation | (21.4) | (0.9) | (12.7) | (2.6) | (5.2) | ||||
June 30, 2022 | $957.9 | $649.1 | $191.3 | $72.1 | $45.4 | ||||
See the footnotes immediately following these tables. |
Invesco Ltd. | ||||||
Year-to-Date Assets Under Management - Passive (d) | ||||||
in billions | June 30, 2022 | June 30, 2021 | % Change | |||
Beginning Assets | $528.4 | $370.6 | 42.6 % | |||
Long-term inflows | 77.2 | 97.2 | (20.6) % | |||
Long-term outflows | (56.3) | (51.2) | 10.0 % | |||
Net long-term flows | 20.9 | 46.0 | (54.6) % | |||
Net flows in non-management fee earning AUM (a) | (3.0) | 2.6 | N/A | |||
Total net flows | 17.9 | 48.6 | (63.2) % | |||
Market gains and losses | (111.6) | 40.7 | N/A | |||
Foreign currency translation | (2.2) | (0.9) | 144.4 % | |||
Ending Assets | $432.5 | $459.0 | (5.8) % | |||
Average long-term AUM | $289.8 | $235.0 | 23.3 % | |||
Average AUM | $481.6 | $408.9 | 17.8 % | |||
Average QQQ AUM | $179.0 | $157.9 | 13.4 % | |||
By channel: (in billions) | Total | Retail | Institutional | ||
December 31, 2021 | $528.4 | $474.8 | $53.6 | ||
Long-term inflows | 77.2 | 75.5 | 1.7 | ||
Long-term outflows | (56.3) | (54.2) | (2.1) | ||
Net long-term flows | 20.9 | 21.3 | (0.4) | ||
Net flows in non-management fee earning AUM (a) | (3.0) | 0.6 | (3.6) | ||
Total net flows | 17.9 | 21.9 | (4.0) | ||
Market gains and losses | (111.6) | (106.0) | (5.6) | ||
Foreign currency translation | (2.2) | (0.9) | (1.3) | ||
June 30, 2022 | $432.5 | $389.8 | $42.7 | ||
By asset class: (in billions) | Total | Equity | Fixed | Balanced | Money | Alternatives(b) | |||||
December 31, 2021 | $528.4 | $452.0 | $41.7 | $1.2 | $— | $33.5 | |||||
Long-term inflows | 77.2 | 53.7 | 10.2 | — | — | 13.3 | |||||
Long-term outflows | (56.3) | (39.9) | (5.3) | (0.1) | — | (11.0) | |||||
Net long-term flows | 20.9 | 13.8 | 4.9 | (0.1) | — | 2.3 | |||||
Net flows in non-management fee earning AUM (a) | (3.0) | 0.6 | (3.6) | — | — | — | |||||
Total net flows | 17.9 | 14.4 | 1.3 | (0.1) | — | 2.3 | |||||
Market gains and losses | (111.6) | (107.7) | (4.0) | (0.2) | — | 0.3 | |||||
Foreign currency translation | (2.2) | (1.4) | (0.5) | — | — | (0.3) | |||||
June 30, 2022 | $432.5 | $357.3 | $38.5 | $0.9 | $— | $35.8 | |||||
Average AUM | $481.6 | $403.4 | $39.8 | $1.0 | $— | $37.4 | |||||
See the footnotes immediately following these tables. |
Invesco Ltd. | |||||||||
Year-to-Date Assets Under Management - Passive (d) (continued) | |||||||||
By client domicile: (in billions) | Total | Americas | Asia | EMEA Ex | UK | ||||
December 31, 2021 | $528.4 | $408.0 | $38.5 | $81.0 | $0.9 | ||||
Long-term inflows | 77.2 | 47.3 | 3.2 | 26.4 | 0.3 | ||||
Long-term outflows | (56.3) | (34.7) | (3.2) | (17.9) | (0.5) | ||||
Net long-term flows | 20.9 | 12.6 | — | 8.5 | (0.2) | ||||
Net flows in non-management fee earning AUM (a) | (3.0) | (4.7) | 0.7 | 0.7 | 0.3 | ||||
Total net flows | 17.9 | 7.9 | 0.7 | 9.2 | 0.1 | ||||
Market gains and losses | (111.6) | (91.5) | (4.5) | (15.4) | (0.2) | ||||
Foreign currency translation | (2.2) | — | (1.6) | (0.6) | — | ||||
June 30, 2022 | $432.5 | $324.4 | $33.1 | $74.2 | $0.8 | ||||
See the footnotes immediately following these tables. |
Invesco Ltd.
Footnotes to the Assets Under Management Tables
(a) | Non-management fee earning AUM includes non-management fee earning ETFs, UIT and product leverage. |
(b) | The alternatives asset class includes absolute return, commodities, currencies, financial structures, global macro, long/short equity, managed futures, multi-alternatives, private capital - direct, private capital - fund of funds, private direct real estate, public real estate securities, senior secured loans and custom solutions. |
(c) | Long-term AUM excludes money market and non-management fee earning AUM. Ending AUM as of June 30, 2022 includes $164.0 billion in money market AUM and $162.8 billion in non-management fee earning AUM (March 31, 2022: $162.0 billion and $209.5 billion, respectively; June 30, 2021: $135.7 billion and $190.2 billion, respectively). |
(d) | Passive AUM includes index-based ETFs, unit investment trusts (UITs), non-fee earning leverage and other passive mandates. Active AUM is total AUM less Passive AUM. |
Invesco Ltd. | ||||||||
Investment Capabilities Performance Overview | ||||||||
Benchmark Comparison | Peer Group Comparison | |||||||
% of AUM in Top Half of Benchmark | % of AUM in Top Half of Peer Group | |||||||
Equities (1) | 1yr | 3yr | 5yr | 10yr | 1yr | 3yr | 5yr | 10yr |
U.S. Core (4%) | 42 % | 40 % | 15 % | 15 % | 12 % | 20 % | 11 % | — % |
U.S. Growth (6%) | 28 % | 43 % | 43 % | 43 % | 18 % | 41 % | 29 % | 36 % |
U.S. Value (7%) | 91 % | 59 % | 45 % | 52 % | 81 % | 41 % | 40 % | 38 % |
Sector (1%) | 1 % | 1 % | 1 % | 55 % | 30 % | 24 % | 56 % | 56 % |
UK (1%) | 79 % | 46 % | 38 % | 43 % | 100 % | 40 % | 35 % | 35 % |
Canadian (<1%) | 100 % | 77 % | 77 % | 37 % | 88 % | 77 % | 40 % | — % |
Asian (3%) | 51 % | 78 % | 86 % | 90 % | 25 % | 27 % | 59 % | 85 % |
Continental European (2%) | 77 % | 29 % | 9 % | 92 % | 90 % | 33 % | 4 % | 91 % |
Global (5%) | 17 % | 13 % | 6 % | 80 % | 12 % | 8 % | — % | 31 % |
Global Ex U.S. and Emerging Markets (9%) | 11 % | 18 % | 10 % | 91 % | 18 % | 1 % | 10 % | 12 % |
Fixed Income (1) | ||||||||
Money Market (23%) | 19 % | 77 % | 96 % | 100 % | 78 % | 80 % | 79 % | 98 % |
U.S. Fixed Income (11%) | 31 % | 74 % | 83 % | 97 % | 27 % | 67 % | 82 % | 92 % |
Global Fixed Income (7%) | 49 % | 83 % | 78 % | 92 % | 66 % | 69 % | 74 % | 87 % |
Stable Value (6%) | 100 % | 100 % | 100 % | 100 % | 97 % | 97 % | 97 % | 100 % |
Other (1) | ||||||||
Alternatives (7%) | 29 % | 48 % | 41 % | 34 % | 66 % | 51 % | 49 % | 44 % |
Balanced (8%) | 41 % | 94 % | 65 % | 65 % | 37 % | 62 % | 87 % | 94 % |
Note: | Excludes passive products, closed-end funds, private equity limited partnerships, non-discretionary funds, unit investment trusts, fund of funds with component funds managed by Invesco, stable value building block funds and CDOs. Certain funds and products were excluded from the analysis because of limited benchmark or peer group data. Had these been available, results may have been different. These results are preliminary and subject to revision. |
Data as of June 30, 2022. AUM measured in the one, three, five and ten year quartile rankings represents 47%, 46%, 45% and 41% of total Invesco AUM, respectively, and AUM measured versus benchmark on a one, three, five and ten year basis represents 60%, 58%, 56% and 51% of total Invesco AUM. Peer group rankings are sourced from a widely-used third party ranking agency in each fund's market (e.g., Morningstar, IA, Lipper, eVestment, Mercer, Galaxy, SITCA, Value Research) and asset-weighted in USD. Rankings are as of prior quarter-end for most institutional products and prior month-end for Australian retail funds due to their late release by third parties. Rankings are calculated against all funds in each peer group. Rankings for the primary share class of the most representative fund in each composite are applied to all products within each composite. Performance assumes the reinvestment of dividends. Past performance is not indicative of future results and may not reflect an investor's experience. | |
(1) | Numbers in parenthesis reflect AUM for each investment product (see Note above for exclusions) as a percentage of the total AUM for the five-year peer group ($632 billion). |
Invesco Ltd. | |||||||||||
Supplemental Information (1) | |||||||||||
For the three months ended | For the three months ended | ||||||||||
Cash flow information $ in millions | U.S. GAAP | Impact of | Excluding | U.S. GAAP | Impact of | Excluding | |||||
Invesco and CIP cash, cash equivalents and | $ 1,614.1 | $ 304.5 | $ 1,309.6 | $ 1,795.9 | $ 429.6 | $ 1,366.3 | |||||
Cash flows from operating activities | 123.1 | (151.2) | 274.3 | 507.7 | (18.8) | 526.5 | |||||
Cash flows from investing activities | (76.7) | (36.7) | (40.0) | (83.8) | (44.4) | (39.4) | |||||
Cash flows from financing activities | (477.7) | 84.4 | (562.1) | (482.7) | 36.6 | (519.3) | |||||
Increase/(decrease) in cash and cash equivalents | (431.3) | (103.5) | (327.8) | (58.8) | (26.6) | (32.2) | |||||
Foreign exchange movement on cash and cash | (50.0) | (5.0) | (45.0) | — | 1.1 | (1.1) | |||||
Invesco and CIP cash and cash equivalents, end of the period | $ 1,132.8 | $ 196.0 | $ 936.8 | $ 1,737.1 | $ 404.1 | $ 1,333.0 | |||||
For the six months ended June 30, 2022 | For the six months ended June 30, 2021 | ||||||||||
Cash flow information $ in millions | U.S. GAAP | Impact of | Excluding | U.S. GAAP | Impact of | Excluding | |||||
Invesco and CIP cash, cash equivalents and | $ 2,147.1 | $ 250.7 | $ 1,896.4 | $ 1,839.3 | $ 301.7 | $ 1,537.6 | |||||
Cash flows from operating activities | (252.3) | (407.2) | 154.9 | 480.8 | (120.4) | 601.2 | |||||
Cash flows from investing activities | (155.8) | (38.3) | (117.5) | (223.7) | (169.0) | (54.7) | |||||
Cash flows from financing activities | (533.0) | 398.6 | (931.6) | (344.9) | 396.5 | (741.4) | |||||
Increase/(decrease) in cash and cash equivalents | (941.1) | (46.9) | (894.2) | (87.8) | 107.1 | (194.9) | |||||
Foreign exchange movement on cash and cash | (73.2) | (7.8) | (65.4) | (14.4) | (4.7) | (9.7) | |||||
Invesco and CIP cash and cash equivalents, end of the period | $ 1,132.8 | $ 196.0 | $ 936.8 | $ 1,737.1 | $ 404.1 | $ 1,333.0 | |||||
(1) | These tables include non-GAAP presentations. Cash held by CIP is not available for use by Invesco. Additionally, there is no recourse to Invesco for CIP debt. The cash flows of CIP do not form part of the company's cash flow management processes, nor do they form part of the company's significant liquidity evaluations and decisions. Policyholder assets and liabilities are equal and offsetting and have no impact on Invesco's shareholder's equity. The impact of cash inflows/outflows from policyholder assets and liabilities are reflected within cash flows from operating activities as changes in receivable and/or payables, as applicable. |
(2) | There was no restricted cash during three and six months ended June 30, 2022. The beginning of period cash excluding CIP for the three and six months ended June 30, 2021 included restricted cash of $208.0 million and $129.2 million, respectively. There was no restricted cash at the end of the period for the three and six months ended June 30, 2021. |
Invesco Ltd. | |||||||||||||||
Supplemental Information(1) | |||||||||||||||
As of June 30, 2022 | As of December 31, 2021 | ||||||||||||||
Balance Sheet information $ in millions | U.S. | Impact of | Impact of | As | U.S. | Impact of | Impact of | As | |||||||
ASSETS | |||||||||||||||
Cash and cash equivalents | $ 936.8 | $ — | $ — | $ 936.8 | $ 1,896.4 | — | — | $ 1,896.4 | |||||||
Investments | 884.6 | (448.2) | — | 1,332.8 | 926.3 | (454.8) | — | 1,381.1 | |||||||
Investments and other assets of | 9,007.9 | 9,007.9 | — | — | 9,575.1 | 9,575.1 | — | — | |||||||
Cash and cash equivalents of | 196.0 | 196.0 | — | — | 250.7 | 250.7 | — | — | |||||||
Assets held for policyholders | 1,067.7 | — | 1,067.7 | — | 1,893.6 | — | 1,893.6 | — | |||||||
Goodwill and intangible assets, | 15,820.6 | — | — | 15,820.6 | 16,110.5 | — | — | 16,110.5 | |||||||
Other assets (2) | 2,273.1 | (8.4) | — | 2,281.5 | 2,033.0 | (6.4) | — | 2,039.4 | |||||||
Total assets | 30,186.7 | 8,747.3 | 1,067.7 | 20,371.7 | 32,685.6 | 9,364.6 | 1,893.6 | 21,427.4 | |||||||
LIABILITIES | |||||||||||||||
Debt of CIP | 6,731.1 | 6,731.1 | — | — | 7,336.1 | 7,336.1 | — | — | |||||||
Other liabilities of CIP | 443.0 | 443.0 | — | — | 846.3 | 846.3 | — | — | |||||||
Policyholder payables | 1,067.7 | — | 1,067.7 | — | 1,893.6 | — | 1,893.6 | — | |||||||
Debt | 1,671.2 | — | — | 1,671.2 | 2,085.1 | — | — | 2,085.1 | |||||||
Other liabilities (3) | 3,586.1 | — | — | 3,586.1 | 3,845.7 | — | — | 3,845.7 | |||||||
Total liabilities | 13,499.1 | 7,174.1 | 1,067.7 | 5,257.3 | 16,006.8 | 8,182.4 | 1,893.6 | 5,930.8 | |||||||
EQUITY | |||||||||||||||
Total equity attributable to | 15,113.7 | (0.1) | — | 15,113.8 | 15,495.8 | (0.1) | — | 15,495.9 | |||||||
Noncontrolling interests (4) | 1,573.9 | 1,573.3 | — | 0.6 | 1,183.0 | 1,182.3 | — | 0.7 | |||||||
Total equity | 16,687.6 | 1,573.2 | — | 15,114.4 | 16,678.8 | 1,182.2 | — | 15,496.6 | |||||||
Total liabilities and equity | $ 30,186.7 | $ 8,747.3 | $ 1,067.7 | $ 20,371.7 | $ 32,685.6 | $ 9,364.6 | $ 1,893.6 | $ 21,427.4 | |||||||
(1) | These tables include non-GAAP presentations. Cash held by CIP is not available for use by Invesco. Additionally, there is no recourse to Invesco for CIP debt. The cash flows of CIP do not form part of the company's cash flow management processes, nor do they form part of the company's significant liquidity evaluations and decisions. Policyholder assets and liabilities are equal and offsetting and have no impact on Invesco's shareholder's equity. The impact of cash inflows/outflows from policyholder assets and liabilities are reflected within cash flows from operating activities as changes in receivable and/or payables, as applicable. |
(2) | Amounts include accounts receivable, prepaid assets, unsettled funds receivables, property, equipment and software, right-of-use asset, and other assets. |
(3) | Amounts include accrued compensation and benefits, unsettled funds payables, accounts payable and accrued expenses, lease liability, and deferred tax liabilities. |
(4) | Amounts include redeemable noncontrolling interests in consolidated entities and equity attributable to nonredeemable noncontrolling interests in consolidated entities. |
View original content to download multimedia:https://www.prnewswire.com/news-releases/invesco-reports-results-for-the-three-months-ended-june-30-2022-301594014.html
SOURCE Invesco Ltd.
Uncategorized
Homes listed for sale in early June sell for $7,700 more
New Zillow research suggests the spring home shopping season may see a second wave this summer if mortgage rates fall
The post Homes listed for sale in…
Share this:


- A Zillow analysis of 2023 home sales finds homes listed in the first two weeks of June sold for 2.3% more.
- The best time to list a home for sale is a month later than it was in 2019, likely driven by mortgage rates.
- The best time to list can be as early as the second half of February in San Francisco, and as late as the first half of July in New York and Philadelphia.
Spring home sellers looking to maximize their sale price may want to wait it out and list their home for sale in the first half of June. A new Zillow® analysis of 2023 sales found that homes listed in the first two weeks of June sold for 2.3% more, a $7,700 boost on a typical U.S. home.
The best time to list consistently had been early May in the years leading up to the pandemic. The shift to June suggests mortgage rates are strongly influencing demand on top of the usual seasonality that brings buyers to the market in the spring. This home-shopping season is poised to follow a similar pattern as that in 2023, with the potential for a second wave if the Federal Reserve lowers interest rates midyear or later.
The 2.3% sale price premium registered last June followed the first spring in more than 15 years with mortgage rates over 6% on a 30-year fixed-rate loan. The high rates put home buyers on the back foot, and as rates continued upward through May, they were still reassessing and less likely to bid boldly. In June, however, rates pulled back a little from 6.79% to 6.67%, which likely presented an opportunity for determined buyers heading into summer. More buyers understood their market position and could afford to transact, boosting competition and sale prices.
The old logic was that sellers could earn a premium by listing in late spring, when search activity hit its peak. Now, with persistently low inventory, mortgage rate fluctuations make their own seasonality. First-time home buyers who are on the edge of qualifying for a home loan may dip in and out of the market, depending on what’s happening with rates. It is almost certain the Federal Reserve will push back any interest-rate cuts to mid-2024 at the earliest. If mortgage rates follow, that could bring another surge of buyers later this year.
Mortgage rates have been impacting affordability and sale prices since they began rising rapidly two years ago. In 2022, sellers nationwide saw the highest sale premium when they listed their home in late March, right before rates barreled past 5% and continued climbing.
Zillow’s research finds the best time to list can vary widely by metropolitan area. In 2023, it was as early as the second half of February in San Francisco, and as late as the first half of July in New York. Thirty of the top 35 largest metro areas saw for-sale listings command the highest sale prices between May and early July last year.
Zillow also found a wide range in the sale price premiums associated with homes listed during those peak periods. At the hottest time of the year in San Jose, homes sold for 5.5% more, a $88,000 boost on a typical home. Meanwhile, homes in San Antonio sold for 1.9% more during that same time period.
| Metropolitan Area | Best Time to List | Price Premium | Dollar Boost |
| United States | First half of June | 2.3% | $7,700 |
| New York, NY | First half of July | 2.4% | $15,500 |
| Los Angeles, CA | First half of May | 4.1% | $39,300 |
| Chicago, IL | First half of June | 2.8% | $8,800 |
| Dallas, TX | First half of June | 2.5% | $9,200 |
| Houston, TX | Second half of April | 2.0% | $6,200 |
| Washington, DC | Second half of June | 2.2% | $12,700 |
| Philadelphia, PA | First half of July | 2.4% | $8,200 |
| Miami, FL | First half of June | 2.3% | $12,900 |
| Atlanta, GA | Second half of June | 2.3% | $8,700 |
| Boston, MA | Second half of May | 3.5% | $23,600 |
| Phoenix, AZ | First half of June | 3.2% | $14,700 |
| San Francisco, CA | Second half of February | 4.2% | $50,300 |
| Riverside, CA | First half of May | 2.7% | $15,600 |
| Detroit, MI | First half of July | 3.3% | $7,900 |
| Seattle, WA | First half of June | 4.3% | $31,500 |
| Minneapolis, MN | Second half of May | 3.7% | $13,400 |
| San Diego, CA | Second half of April | 3.1% | $29,600 |
| Tampa, FL | Second half of June | 2.1% | $8,000 |
| Denver, CO | Second half of May | 2.9% | $16,900 |
| Baltimore, MD | First half of July | 2.2% | $8,200 |
| St. Louis, MO | First half of June | 2.9% | $7,000 |
| Orlando, FL | First half of June | 2.2% | $8,700 |
| Charlotte, NC | Second half of May | 3.0% | $11,000 |
| San Antonio, TX | First half of June | 1.9% | $5,400 |
| Portland, OR | Second half of April | 2.6% | $14,300 |
| Sacramento, CA | First half of June | 3.2% | $17,900 |
| Pittsburgh, PA | Second half of June | 2.3% | $4,700 |
| Cincinnati, OH | Second half of April | 2.7% | $7,500 |
| Austin, TX | Second half of May | 2.8% | $12,600 |
| Las Vegas, NV | First half of June | 3.4% | $14,600 |
| Kansas City, MO | Second half of May | 2.5% | $7,300 |
| Columbus, OH | Second half of June | 3.3% | $10,400 |
| Indianapolis, IN | First half of July | 3.0% | $8,100 |
| Cleveland, OH | First half of July | 3.4% | $7,400 |
| San Jose, CA | First half of June | 5.5% | $88,400 |
The post Homes listed for sale in early June sell for $7,700 more appeared first on Zillow Research.
federal reserve pandemic home sales mortgage rates interest ratesGovernment
Survey Shows Declining Concerns Among Americans About COVID-19
Survey Shows Declining Concerns Among Americans About COVID-19
A new survey reveals that only 20% of Americans view covid-19 as "a major threat"…
Share this:


A new survey reveals that only 20% of Americans view covid-19 as "a major threat" to the health of the US population - a sharp decline from a high of 67% in July 2020.
What's more, the Pew Research Center survey conducted from Feb. 7 to Feb. 11 showed that just 10% of Americans are concerned that they will catch the disease and require hospitalization.
"This data represents a low ebb of public concern about the virus that reached its height in the summer and fall of 2020, when as many as two-thirds of Americans viewed COVID-19 as a major threat to public health," reads the report, which was published March 7.
According to the survey, half of the participants understand the significance of researchers and healthcare providers in understanding and treating long COVID - however 27% of participants consider this issue less important, while 22% of Americans are unaware of long COVID.
What's more, while Democrats were far more worried than Republicans in the past, that gap has narrowed significantly.
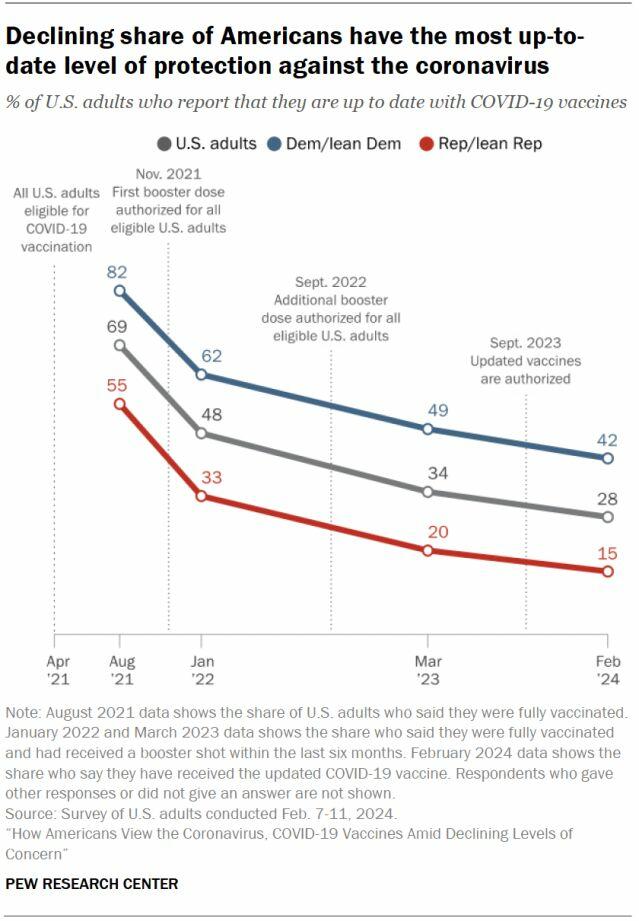
"In the pandemic’s first year, Democrats were routinely about 40 points more likely than Republicans to view the coronavirus as a major threat to the health of the U.S. population. This gap has waned as overall levels of concern have fallen," reads the report.
More via the Epoch Times;
The survey found that three in ten Democrats under 50 have received an updated COVID-19 vaccine, compared with 66 percent of Democrats ages 65 and older.
Moreover, 66 percent of Democrats ages 65 and older have received the updated COVID-19 vaccine, while only 24 percent of Republicans ages 65 and older have done so.
“This 42-point partisan gap is much wider now than at other points since the start of the outbreak. For instance, in August 2021, 93 percent of older Democrats and 78 percent of older Republicans said they had received all the shots needed to be fully vaccinated (a 15-point gap),” it noted.
COVID-19 No Longer an Emergency
The U.S. Centers for Disease Control and Prevention (CDC) recently issued its updated recommendations for the virus, which no longer require people to stay home for five days after testing positive for COVID-19.
The updated guidance recommends that people who contracted a respiratory virus stay home, and they can resume normal activities when their symptoms improve overall and their fever subsides for 24 hours without medication.
“We still must use the commonsense solutions we know work to protect ourselves and others from serious illness from respiratory viruses, this includes vaccination, treatment, and staying home when we get sick,” CDC director Dr. Mandy Cohen said in a statement.
The CDC said that while the virus remains a threat, it is now less likely to cause severe illness because of widespread immunity and improved tools to prevent and treat the disease.
“Importantly, states and countries that have already adjusted recommended isolation times have not seen increased hospitalizations or deaths related to COVID-19,” it stated.
The federal government suspended its free at-home COVID-19 test program on March 8, according to a website set up by the government, following a decrease in COVID-19-related hospitalizations.
According to the CDC, hospitalization rates for COVID-19 and influenza diseases remain “elevated” but are decreasing in some parts of the United States.
Government
Rand Paul Teases Senate GOP Leader Run – Musk Says “I Would Support”
Rand Paul Teases Senate GOP Leader Run – Musk Says "I Would Support"
Republican Kentucky Senator Rand Paul on Friday hinted that he may jump…
Share this:


Republican Kentucky Senator Rand Paul on Friday hinted that he may jump into the race to become the next Senate GOP leader, and Elon Musk was quick to support the idea. Republicans must find a successor for periodically malfunctioning Mitch McConnell, who recently announced he'll step down in November, though intending to keep his Senate seat until his term ends in January 2027, when he'd be within weeks of turning 86.
So far, the announced field consists of two quintessential establishment types: John Cornyn of Texas and John Thune of South Dakota. While John Barrasso's name had been thrown around as one of "The Three Johns" considered top contenders, the Wyoming senator on Tuesday said he'll instead seek the number two slot as party whip.
Paul used X to tease his potential bid for the position which -- if the GOP takes back the upper chamber in November -- could graduate from Minority Leader to Majority Leader. He started by telling his 5.1 million followers he'd had lots of people asking him about his interest in running...
Thousands of people have been asking if I'd run for Senate leadership...
— Rand Paul (@RandPaul) March 8, 2024
...then followed up with a poll in which he predictably annihilated Cornyn and Thune, taking a 96% share as of Friday night, with the other two below 2% each.
????????️VOTE NOW ????️ ???? Who would you like to be the next Senate leader?
— Rand Paul (@RandPaul) March 8, 2024
Elon Musk was quick to back the idea of Paul as GOP leader, while daring Cornyn and Thune to follow Paul's lead by throwing their names out for consideration by the Twitter-verse X-verse.
I would support Rand Paul and suspect that other candidates will not actually run polls out of concern for the results, but let’s see if they will!
— Elon Musk (@elonmusk) March 8, 2024
Paul has been a stalwart opponent of security-state mass surveillance, foreign interventionism -- to include shoveling billions of dollars into the proxy war in Ukraine -- and out-of-control spending in general. He demonstrated the latter passion on the Senate floor this week as he ridiculed the latest kick-the-can spending package:
This bill is an insult to the American people. The earmarks are all the wasteful spending that you could ever hope to see, and it should be defeated. Read more: https://t.co/Jt8K5iucA4 pic.twitter.com/I5okd4QgDg
— Senator Rand Paul (@SenRandPaul) March 8, 2024
In February, Paul used Senate rules to force his colleagues into a grueling Super Bowl weekend of votes, as he worked to derail a $95 billion foreign aid bill. "I think we should stay here as long as it takes,” said Paul. “If it takes a week or a month, I’ll force them to stay here to discuss why they think the border of Ukraine is more important than the US border.”
Don't expect a Majority Leader Paul to ditch the filibuster -- he's been a hardy user of the legislative delay tactic. In 2013, he spoke for 13 hours to fight the nomination of John Brennan as CIA director. In 2015, he orated for 10-and-a-half-hours to oppose extension of the Patriot Act.
Among the general public, Paul is probably best known as Capitol Hill's chief tormentor of Dr. Anthony Fauci, who was director of the National Institute of Allergy and Infectious Disease during the Covid-19 pandemic. Paul says the evidence indicates the virus emerged from China's Wuhan Institute of Virology. He's accused Fauci and other members of the US government public health apparatus of evading questions about their funding of the Chinese lab's "gain of function" research, which takes natural viruses and morphs them into something more dangerous. Paul has pointedly said that Fauci committed perjury in congressional hearings and that he belongs in jail "without question."
Musk is neither the only nor the first noteworthy figure to back Paul for party leader. Just hours after McConnell announced his upcoming step-down from leadership, independent 2024 presidential candidate Robert F. Kennedy, Jr voiced his support:
Mitch McConnell, who has served in the Senate for almost 40 years, announced he'll step down this November.
— Robert F. Kennedy Jr (@RobertKennedyJr) February 28, 2024
Part of public service is about knowing when to usher in a new generation. It’s time to promote leaders in Washington, DC who won’t kowtow to the military contractors or…
In a testament to the extent to which the establishment recoils at the libertarian-minded Paul, mainstream media outlets -- which have been quick to report on other developments in the majority leader race -- pretended not to notice that Paul had signaled his interest in the job. More than 24 hours after Paul's test-the-waters tweet-fest began, not a single major outlet had brought it to the attention of their audience.
That may be his strongest endorsement yet.


Veterans Affairs Kept COVID-19 Vaccine Mandate In Place Without Evidence


The Coming Of The Police State In America


Beloved mall retailer files Chapter 7 bankruptcy, will liquidate


‘I couldn’t stand the pain’: the Turkish holiday resort that’s become an emergency dental centre for Britons who can’t get treated at home


February Employment Situation


Rand Paul Teases Senate GOP Leader Run – Musk Says “I Would Support”


Low Iron Levels In Blood Could Trigger Long COVID: Study


Walmart has really good news for shoppers (and Joe Biden)


Another beloved brewery files Chapter 11 bankruptcy
Walmart joins Costco in sharing key pricing news
-

 Uncategorized3 weeks ago
All Of The Elements Are In Place For An Economic Crisis Of Staggering Proportions
-

 Uncategorized1 month ago
Cathie Wood sells a major tech stock (again)
-

 Uncategorized3 weeks ago
California Counties Could Be Forced To Pay $300 Million To Cover COVID-Era Program
-

 Uncategorized2 weeks ago
Apparel Retailer Express Moving Toward Bankruptcy
-

 Uncategorized4 weeks ago
Industrial Production Decreased 0.1% in January
-

 International3 days ago
Walmart launches clever answer to Target’s new membership program
-

 International3 days ago
EyePoint poaches medical chief from Apellis; Sandoz CFO, longtime BioNTech exec to retire
-

 Uncategorized3 weeks ago
RFK Jr: The Wuhan Cover-Up & The Rise Of The Biowarfare-Industrial Complex