Inflation and Hiring Challenges Force Small Businesses to React
The QuickBooks’ Small Business Insights report looks at the big issues facing U.S. small businesses today, starting with inflation, hiring, and the ongoing economic recovery from COVID.
Share this:

The QuickBooks' Small Business Insights report looks at the big issues facing U.S. small businesses today, starting with inflation, hiring, and the ongoing economic recovery from COVID.
Our latest Small Business Insights report looks at the big issues facing U.S. small businesses today, starting with inflation, hiring, and the ongoing economic recovery from COVID. Dive into the key findings below.
Inflation
Most small businesses (96%) are concerned about inflation. The top three cost pressures are materials, equipment, and labor. This may be why almost three out of five small businesses (57%) want to raise prices this fall.
Hiring
Most small business workforces continued to grow in August, but the overall rate of growth has slowed since June. Workforces are currently growing fastest in the information industry, which includes software development. Wages are currently rising fastest in public administration organizations that oversee government programs.
Recovery
The economic recovery from COVID became more widespread through June and July. Even some of the hardest-hit businesses — including restaurants, clothing stores, and hair salons — are bouncing back. But many travel and entertainment businesses are still struggling.
Risks
Despite high levels of optimism, small businesses still see the economy as their No. 1 threat today. Rising costs and low demand are creating cash flow problems for some.
Adaptation
Almost half of the small businesses (49%) have remote workers and the number looks set to grow. Almost four out of five (79%) say that investing in digital technology makes them more likely to succeed.
Growth
Almost two-thirds of small businesses (65%) predict their business will grow this fall. E-commerce businesses continue to be more upbeat than businesses that do not sell online.
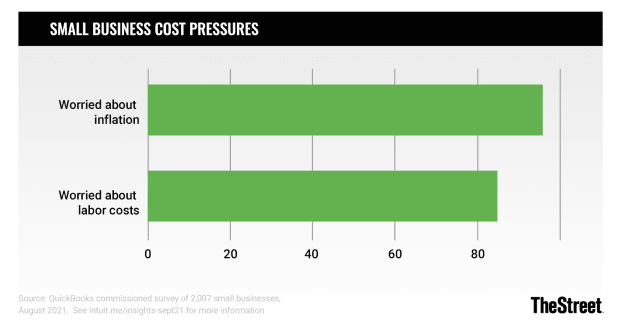
More than 9 out of 10 small businesses are concerned about inflation
New data from a recent survey commissioned by QuickBooks reveals the top three cost pressures small businesses face today are:
- Materials
- Equipment
- Labor
Overall, more than nine out of 10 small businesses (96%) are concerned about inflation. More than four out of five (85%) are concerned about the cost of labor. Despite this, many have recently increased wages2 to tackle skills shortages. Our research suggests this trend will continue. Read more about this in the Hiring section.
Almost three out of five small businesses plan to increase prices
Perhaps in response to rising costs, almost three out of five small businesses (57%) say they will “definitely” or “potentially” raise prices this fall. Just 1 in 3 (33%) have no plans to make any price increases. For some, higher input costs are already contributing to cash flow problems. Read more about this in the Risks section.

Revenues are returning to pre-pandemic levels
In the face of rising costs, there is good news. QuickBooks customer data3 reveals that nationally, small business monthly revenues consistently beat their pre-pandemic benchmarks every month from February to July 2021. Since May, the recovery has become more widespread. Read more about this in the Recovery section.
Most small business workforces continued to grow in August
QuickBooks Payroll data2 reveals that small business workforces grew from July to August 2021 in all but four industries (construction, finance and insurance, utilities, and public administration).
The three fastest-growing small business workforces from July to August 2021 were:
- Information, e.g. software development (+3%)
- Education, e.g. schools and training centers (+2%)
- Professional, scientific, and technical services, e.g. lawyers, accountants, engineers, and architects (+2%)
Overall, the trend for small business hiring has been positive since March 2021 — but the rate of growth did slow through the summer months, potentially due to the impact of the Delta variant of COVID-19. The biggest gains since March 2021 have been in arts and entertainment, agriculture, and accommodation, and food services.

Hourly pay rose fastest for real estate and public administration workers in August
Hourly pay went up in 10 industries from July to August 2021. The three industries that saw the biggest increases were:
- Public administration organizations that oversee government programs (+3% to $15.81/hour)
- Real estate, which includes rental and leasing as well as sales of property or equipment (+2% to $17.87/hour)
- Information, such as software developers (+2% to $18.00/hour)
If we look further back to see how hourly wages have changed over the past 12 months, we find that accommodation and food service workers have seen the largest pay increases. Between September 2020 and August 2021, median hourly pay increased by more than 8% — from $12 to $13. At the other end of the scale, median hourly pay has not changed at all over the past 12 months in the arts and agriculture industries.
Which workforces contracted most during the pandemic?
By comparing average employee numbers in August 2021 against their pre-pandemic benchmarks in August 2019, we find that just four industries currently have smaller workforces than they did before the pandemic:
- Public administration organizations that oversee government programs (-3% vs pre-pandemic benchmark)
- Transport and warehousing, which includes passenger transport as well as cargo (-2% vs pre-pandemic benchmark)
- Management companies, such as holding companies and companies which advice and own stocks in other businesses (-2% vs pre-pandemic benchmark)
- Other services, such as repair and personal services (-2% vs pre-pandemic benchmark)
The three industries with the most growth over that period are:
- Professional, scientific, and technical services, e.g. lawyers, accountants, engineers, and architects (+5% vs pre-pandemic benchmark)
- Construction (+4% vs pre-pandemic benchmark)
- Retail (+4% vs pre-pandemic benchmark)
August was the first month during the pandemic in which accommodation and food service workforces returned to their pre-pandemic levels. The low point was in April 2020, when the average small business workforce was 17% smaller than the pre-pandemic benchmark (in April 2019).
More than 1 in 2 small businesses face skills shortages
Returning to the data we collected in the survey we recently commissioned1, we see that more than half of small businesses (51%) say it’s getting harder to hire skilled workers. Similarly, more than two in five (42%) say it’s getting harder to retain skilled workers. To address this, they are doing more than simply raising pay:
- 29% are offering more benefits
- 27% are hiring younger workers than before
- 26% are relaxing experience requirements
Looking ahead, almost one in two (48%) small businesses say they will increase pay for their existing workers during the next pay review. Two in five (40%) will offer larger bonuses.

Small business recovery is taking hold
QuickBooks data3 reveals even some of the hardest-hit small businesses saw monthly revenues return to their pre-pandemic levels this summer. Nationally, monthly revenues were 25% higher in June than their pre-pandemic benchmark. In July, they were 6% higher. The drop may be due to the impact of the Delta variant of COVID-19.
Businesses that benefited most from the June uptick include:
- Bars and restaurants: monthly revenues were up 34% compared to their pre-pandemic benchmark, equivalent to an extra $14,000 per business. This almost put them in the top 10 best performing industries nationally for the month. Last year, in June 2020, they were in the bottom 10.
- Clothing and accessory stores: monthly revenues were up 34% compared to their pre-pandemic benchmark, equivalent to an extra $6,000 per business. As bars and restaurants, they were very close to being in the top 10 best performing industries nationally. That’s a huge turnaround from April 2020 when they were in the bottom 10.
- Hair studios: as previously reported, hair studios were among the hardest hit of all small businesses in April 2020, when the pandemic’s economic impact was most severe. But through both June and July 2021, monthly revenues were back to pre-pandemic levels. In June they were up by 19%, equivalent to an extra $3,000 per business.
Travel, tourism, and entertainment business still struggling
Some small businesses, however, have not seen their monthly revenues get anywhere close to their pre-pandemic levels yet. These include:
- Travel agencies: monthly revenues were 25% below their pre-pandemic benchmark in July 2021, equivalent to $3,000 less per business.
- Tour operators: monthly revenues were 24% below their pre-pandemic benchmark in July 2021, equivalent to $3,000 less per business.
- Theater producers: monthly revenues were 13% below their pre-pandemic benchmark in July 2021, equivalent to $1,000 less per business.
Finance, real estate, and construction businesses still going strong
The finance, real estate, and construction industries have been highly resilient during the COVID-19 pandemic. When we first looked at COVID’s impact on small business revenues back in April 2021 (read the original report here), we found that annual revenues for the finance and insurance business had gone up by 14% during the first 12 months of the pandemic — the largest increase of all. There was also clear evidence of an increase in demand for construction and home improvement projects.
The latest monthly revenue data, from July 2021, tells a similar story.
- Investment advisors: 25% increase in monthly revenue compared to their pre-pandemic benchmark, equivalent to an extra $7,000 per business.
- Mortgage bankers: 28% increase in monthly revenue compared to their pre-pandemic benchmark, equivalent to an extra $7,000 per business.
- Title abstract companies (property records): 29% increase in monthly revenue compared to their pre-pandemic benchmark, equivalent to $11,000 per business.
- Special trade contractors (e.g. home improvement): 14% increase in monthly revenue compared to their pre-pandemic benchmark, equivalent to $4,000 per business.
Small businesses say the economy remains their No.1 threat
Despite signs of a more widespread economic recovery from COVID (see Recovery section), in the recent survey we commissioned1 almost 1 in 2 small businesses (49%) said the economy is still a potential risk.
The top three threats they identified are:
- The economy (49% agree)
- Rising costs (40% agree)
- Low-price competitors (24% agree)

Rising costs cause cash flow problems and slower growth
Overall, almost three in five small businesses (58%) currently have a cash flow problem. They say this is limiting their ability to grow, take on new projects, and make capital investments. Some say it’s preventing them from hiring.
The top three causes of cash flow problems today are:
- Low customer demand (27% agree)
- Costs rising too fast (26% agree)
- Unpaid invoices (9% agree)
Low revenue businesses are under the most pressure. Almost a third (29%) of small businesses with less than $50,000 in annual revenue say cash flow is currently a major problem.
Low cash reserves are another risk factor
Almost three in five small businesses (57%) currently have less than six months of cash reserves. As with cash flow, the most vulnerable are again those with less than $50,000 in annual revenue. More than one of four of these businesses (26%) currently have less than one month of cash reserves to cover their costs in an emergency.

Small businesses are embracing remote work
The recent survey we commissioned1 reveals that almost half of small businesses (49%) now have remote workers. Of these, more than a third (36%) say the number will grow. Just one in ten (12%) predict a smaller remote workforce in future. Urban businesses that sell online are the most likely to have remote workers. Two-thirds (66%) of these businesses say they have a remote workforce compared to roughly a third (37%) of rural businesses.
Digital technology and accountants help small businesses to thrive
Almost four out of five small businesses (79%) agree they are more likely to succeed if they invest in digital technology. More than two in five (44%) want to make more use of digital technology in their business.
Accountants also help small businesses to succeed. According to our survey respondents, the top three benefits accountants are bringing to their business are:
- Better business decisions
- Saving money
- More likely to survive
Most small businesses want to protect the environment
Almost nine out of 10 small businesses (86%) agree that environmental sustainability is important to the future of the economy. More than 2 in 5 (44%) say it is “critically important.” Millennials, urban businesses, and younger businesses (established less than two years ago) expressed the most support for sustainability.
Two-thirds of small businesses (65%) want to minimize their environmental impact. More than 1 in 2 (52%) would do more if they had more help.
Small businesses are upbeat about growth and the economy
The survey we recently commissioned1 reveals that almost two-thirds of small businesses (65%) predict their business will grow this fall. Among businesses that sell online, this rises to 70%. But among businesses that do not currently sell online, this drops to 58%.
Similarly, three out of five (60%) small businesses are currently “somewhat” or “very” optimistic about the economy. But as we’ve seen elsewhere in this report (see Risks section), lower revenue businesses have different views. Those with less than $50,000 in annual revenue were far less optimistic than businesses with more than $1 million in annual revenue. Ecommerce businesses also expressed higher levels of optimism.
To boost growth, small businesses need more workers
Almost one in two small businesses (47%) need more workers. Many identify hiring as a top growth priority. One in ten (10%) want to significantly expand their workforce this fall. Urban businesses have the most appetite for hiring, with more than three out of five (58%) needing more workers right now.
Other growth priorities include:
- Improving marketing results (42% agree)
- Increasing online sales (42% agree)
- Developing new products/services (33% agree)

Many will continue raising pay to address hiring challenges
As we’ve seen (see Hiring section), one in two small businesses (51%) are finding it harder to hire skilled workers and more than two in five (42%) are struggling to retain skilled workers. QuickBooks Payroll data2 confirms that many have already increased pay. Based on our recent survey, this trend looks set to continue:
- More than two in five small businesses (44%) are raising wages for new hires.
- Almost 1 in 2 small businesses (48%) will use their next pay reviews to give more money to existing employees.
- Two in five small businesses (40%) will offer existing employees larger bonuses in their next pay reviews.
1. Survey data
QuickBooks commissioned Qualtrics to survey 2,007 small business owners and decision-makers throughout the U.S. in August 2021. Respondents’ businesses have up to 100 employees and more than $5,000 in annual revenue. Roughly a third (36%) are brick-and-mortar businesses. The remainder is omnichannel, multi-channel, or primarily online. Around one in five (18%) are located in rural areas while the remainder is in urban or suburban locations. Percentages have been rounded to the nearest decimal place. Respondents received remuneration.
2. QuickBooks Payroll data
This is not surveyed data but anonymized, aggregate data from 200,000 small businesses that use QuickBooks Online Payroll to manage their payroll. Businesses that have used QuickBooks Online Payroll for less than four months were excluded from the dataset. All hourly wages are expressed as median values. Contractors and salaried employees were excluded from hourly wage calculations. Contractors and salaried employees are included in average employee calculations.
Monthly workforce growth rates
Monthly workforce growth rates are calculated by comparing the average number of paid employees per business for the current month against the average number of paid employees per business for the previous month (e.g. August 2021 vs July 2021). For example, if the average number of employees goes up from 5 to 6 from one month to the next, the monthly increase is 20%. The data is not seasonally adjusted.
Pre-pandemic benchmarks
The pre-pandemic benchmarks used in this section of the report compare monthly payroll data during the pandemic against monthly payroll data from the corresponding month before the pandemic (e.g. July 2021 vs July 2019).
Industry classifications
For this analysis, businesses were grouped using the North American Industry Classification System (NAICS), which has 20 categories. See the U.S. Census Bureau website for more information.
3. QuickBooks Online data
This is not surveyed data but anonymized, aggregate data from around 1 million small businesses that use QuickBooks to manage their business. The exact number of businesses in the overall sample fluctuates overtime on a monthly basis from a low of 800,000 small businesses to a high of around 1.1 million because it excludes businesses that do not have corresponding monthly data year over year. The annual revenue analysis also excludes any businesses with less than 10 months of corresponding data available year over year. QuickBooks Online customers who have not connected their business bank accounts were also excluded from the analysis. Consequently, this report only includes businesses that had deposits in their accounts during the given timeframes. Median values are used throughout in place of mean (average) values to eliminate outliers that can skew the data.
Net bank deposits
The financial impact of COVID-19 is measured by comparing small businesses’ net bank deposits during the pandemic with the same data from the same businesses before the pandemic to reveal how things have changed for them year-over-year. Net bank deposits are incoming deposit transactions into small business bank accounts. This excludes non-operating deposits such as business loans and government assistance (for example, Paycheck Protection Program loans, also known as PPP). All of this data is anonymized and aggregated.
The net bank deposit data was used to calculate a monthly median year over year net deposit ratio (YOY revenue ratio) — referred to as “monthly revenue benchmarked to pre-pandemic monthly revenue” — which provides directional insights into small business revenues and recovery. The YOY revenue ratio is calculated as follows:
For each available business, calculate the YOY net deposit ratio by dividing the current month’s net deposit dollar amount by the corresponding month before the pandemic.
For each month, aggregate by taking the median YOY net deposit ratio among all available businesses for the relevant segment. For example, a YOY revenue ratio of 85% for a given month means that:
- 50% of companies’ net deposits are less than 85% of the corresponding month before the pandemic.
- 50% of companies’ net deposits are greater than 85% of the corresponding month before the pandemic.
- YOY revenue ratio was then overlaid with industry and geographic data to reveal the patterns of small business recovery between April 1, 2020, and March 31, 2021.
Industry classifications
For this analysis, businesses were grouped using SIC (Standard Industrial Classification) categories, with 10 sectors (agriculture; construction; finance/insurance; manufacturing; mining; public administration; retail; services; transportation, communication, energy, & sanitary; and wholesale), comprising smaller industry categories (known as SIC2) and sub-industry categories (known as SIC4).
Annual revenue data
As described above (see “Net bank deposits”), annual revenues are estimated from anonymized, aggregate net bank deposit data. Annual revenues during the pandemic are benchmarked against the corresponding 12 months before the pandemic. In other words, annual revenue data from April 1, 2020, to March 31, 2021, is compared against annual revenue data from April 1, 2019, to March 31, 2020, from the same group of businesses.
Monthly revenue data
As described above (see “Net bank deposits”), monthly revenues are estimated from anonymized, aggregate net bank deposit data. Monthly business performance during the pandemic is then benchmarked against data from the corresponding months before the pandemic (for example, July 2021 vs. July 2019) from the same group of businesses.
Data limitations and considerations
The calculation of year-over-year revenue change required that any business included in the analysis have bank data for 2021, 2020, and the same months in the pre-pandemic years. Businesses were excluded if they had only recently connected bank data to QuickBooks or lost their bank connection within the one-year period.
A consideration of survival bias caused by businesses who discontinued operation or/and disconnected bank accounts during COVID-19 is also necessary. For example, the percentage of businesses that lost bank connections in 2020 (8%) is close to that in 2019 (7%), which means COVID-19 didn’t significantly increase the number of disconnected bank accounts in our data sample. Thus, the data is still comparable year-over-year without significant bias.
Net deposit data is only a proxy for business revenue and may sometimes over-or underestimate the true business revenues because this may include non-revenue deposits, such as equity or loan transfers from other bank accounts not linked to QuickBooks. The majority of these were identified and removed by a transaction tagging algorithm. Another potential limitation is that businesses may have only connected one of their business bank accounts in QuickBooks, which would only provide partial insights into their net deposit activity.
This content is for information purposes only and should not be considered legal, accounting, or tax advice, or a substitute for obtaining such advice specific to your business. Additional information and exceptions may apply. Applicable laws may vary by state or locality. No assurance is given that the information is comprehensive in its coverage or that it is suitable in dealing with a customer’s particular situation. Intuit Inc. does not have any responsibility for updating or revising any information presented herein. Accordingly, the information provided should not be relied upon as a substitute for independent research. Intuit Inc. does not warrant that the material contained herein will continue to be accurate nor that it is completely free of errors when published. Readers should verify statements before relying on them.
We provide third-party links as a convenience and for informational purposes only. Intuit does not endorse or approve these products and services, or the opinions of these corporations or organizations, or individuals. Intuit accepts no responsibility for the accuracy, legality, or content on these sites.
economic recovery pandemic covid-19 stocks real estate recoverySpread & Containment
Vaccine-skeptical mothers say bad health care experiences made them distrust the medical system
Vaccine skepticism, and the broader medical mistrust and far-reaching anxieties it reflects, is not just a fringe position in the 21st century.
Share this:

Why would a mother reject safe, potentially lifesaving vaccines for her child?
Popular writing on vaccine skepticism often denigrates white and middle-class mothers who reject some or all recommended vaccines as hysterical, misinformed, zealous or ignorant. Mainstream media and medical providers increasingly dismiss vaccine refusal as a hallmark of American fringe ideology, far-right radicalization or anti-intellectualism.
But vaccine skepticism, and the broader medical mistrust and far-reaching anxieties it reflects, is not just a fringe position.
Pediatric vaccination rates had already fallen sharply before the COVID-19 pandemic, ushering in the return of measles, mumps and chickenpox to the U.S. in 2019. Four years after the pandemic’s onset, a growing number of Americans doubt the safety, efficacy and necessity of routine vaccines. Childhood vaccination rates have declined substantially across the U.S., which public health officials attribute to a “spillover” effect from pandemic-related vaccine skepticism and blame for the recent measles outbreak. Almost half of American mothers rated the risk of side effects from the MMR vaccine as medium or high in a 2023 survey by Pew Research.
Recommended vaccines go through rigorous testing and evaluation, and the most infamous charges of vaccine-induced injury have been thoroughly debunked. How do so many mothers – primary caregivers and health care decision-makers for their families – become wary of U.S. health care and one of its most proven preventive technologies?
I’m a cultural anthropologist who studies the ways feelings and beliefs circulate in American society. To investigate what’s behind mothers’ vaccine skepticism, I interviewed vaccine-skeptical mothers about their perceptions of existing and novel vaccines. What they told me complicates sweeping and overly simplified portrayals of their misgivings by pointing to the U.S. health care system itself. The medical system’s failures and harms against women gave rise to their pervasive vaccine skepticism and generalized medical mistrust.
The seeds of women’s skepticism
I conducted this ethnographic research in Oregon from 2020 to 2021 with predominantly white mothers between the ages of 25 and 60. My findings reveal new insights about the origins of vaccine skepticism among this demographic. These women traced their distrust of vaccines, and of U.S. health care more generally, to ongoing and repeated instances of medical harm they experienced from childhood through childbirth.

As young girls in medical offices, they were touched without consent, yelled at, disbelieved or threatened. One mother, Susan, recalled her pediatrician abruptly lying her down and performing a rectal exam without her consent at the age of 12. Another mother, Luna, shared how a pediatrician once threatened to have her institutionalized when she voiced anxiety at a routine physical.
As women giving birth, they often felt managed, pressured or discounted. One mother, Meryl, told me, “I felt like I was coerced under distress into Pitocin and induction” during labor. Another mother, Hallie, shared, “I really battled with my provider” throughout the childbirth experience.
Together with the convoluted bureaucracy of for-profit health care, experiences of medical harm contributed to “one million little touch points of information,” in one mother’s phrase, that underscored the untrustworthiness and harmful effects of U.S. health care writ large.
A system that doesn’t serve them
Many mothers I interviewed rejected the premise that public health entities such as the Centers for Disease Control and Prevention and the Food and Drug Administration had their children’s best interests at heart. Instead, they tied childhood vaccination and the more recent development of COVID-19 vaccines to a bloated pharmaceutical industry and for-profit health care model. As one mother explained, “The FDA is not looking out for our health. They’re looking out for their wealth.”
After ongoing negative medical encounters, the women I interviewed lost trust not only in providers but the medical system. Frustrating experiences prompted them to “do their own research” in the name of bodily autonomy. Such research often included books, articles and podcasts deeply critical of vaccines, public health care and drug companies.
These materials, which have proliferated since 2020, cast light on past vaccine trials gone awry, broader histories of medical harm and abuse, the rapid growth of the recommended vaccine schedule in the late 20th century and the massive profits reaped from drug development and for-profit health care. They confirmed and hardened women’s suspicions about U.S. health care.

The stories these women told me add nuance to existing academic research into vaccine skepticism. Most studies have considered vaccine skepticism among primarily white and middle-class parents to be an outgrowth of today’s neoliberal parenting and intensive mothering. Researchers have theorized vaccine skepticism among white and well-off mothers to be an outcome of consumer health care and its emphasis on individual choice and risk reduction. Other researchers highlight vaccine skepticism as a collective identity that can provide mothers with a sense of belonging.
Seeing medical care as a threat to health
The perceptions mothers shared are far from isolated or fringe, and they are not unreasonable. Rather, they represent a growing population of Americans who hold the pervasive belief that U.S. health care harms more than it helps.
Data suggests that the number of Americans harmed in the course of treatment remains high, with incidents of medical error in the U.S. outnumbering those in peer countries, despite more money being spent per capita on health care. One 2023 study found that diagnostic error, one kind of medical error, accounted for 371,000 deaths and 424,000 permanent disabilities among Americans every year.
Studies reveal particularly high rates of medical error in the treatment of vulnerable communities, including women, people of color, disabled, poor, LGBTQ+ and gender-nonconforming individuals and the elderly. The number of U.S. women who have died because of pregnancy-related causes has increased substantially in recent years, with maternal death rates doubling between 1999 and 2019.
The prevalence of medical harm points to the relevance of philosopher Ivan Illich’s manifesto against the “disease of medical progress.” In his 1982 book “Medical Nemesis,” he insisted that rather than being incidental, harm flows inevitably from the structure of institutionalized and for-profit health care itself. Illich wrote, “The medical establishment has become a major threat to health,” and has created its own “epidemic” of iatrogenic illness – that is, illness caused by a physician or the health care system itself.
Four decades later, medical mistrust among Americans remains alarmingly high. Only 23% of Americans express high confidence in the medical system. The United States ranks 24th out of 29 peer high-income countries for the level of public trust in medical providers.
For people like the mothers I interviewed, who have experienced real or perceived harm at the hands of medical providers; have felt belittled, dismissed or disbelieved in a doctor’s office; or spent countless hours fighting to pay for, understand or use health benefits, skepticism and distrust are rational responses to lived experience. These attitudes do not emerge solely from ignorance, conspiracy thinking, far-right extremism or hysteria, but rather the historical and ongoing harms endemic to the U.S. health care system itself.
Johanna Richlin does not work for, consult, own shares in or receive funding from any company or organization that would benefit from this article, and has disclosed no relevant affiliations beyond their academic appointment.
disease control extremism pandemic covid-19 vaccine treatment testing fda deathsGovernment
Is the National Guard a solution to school violence?
School board members in one Massachusetts district have called for the National Guard to address student misbehavior. Does their request have merit? A…
Share this:


Every now and then, an elected official will suggest bringing in the National Guard to deal with violence that seems out of control.
A city council member in Washington suggested doing so in 2023 to combat the city’s rising violence. So did a Pennsylvania representative concerned about violence in Philadelphia in 2022.
In February 2024, officials in Massachusetts requested the National Guard be deployed to a more unexpected location – to a high school.
Brockton High School has been struggling with student fights, drug use and disrespect toward staff. One school staffer said she was trampled by a crowd rushing to see a fight. Many teachers call in sick to work each day, leaving the school understaffed.
As a researcher who studies school discipline, I know Brockton’s situation is part of a national trend of principals and teachers who have been struggling to deal with perceived increases in student misbehavior since the pandemic.
A review of how the National Guard has been deployed to schools in the past shows the guard can provide service to schools in cases of exceptional need. Yet, doing so does not always end well.
How have schools used the National Guard before?
In 1957, the National Guard blocked nine Black students’ attempts to desegregate Central High School in Little Rock, Arkansas. While the governor claimed this was for safety, the National Guard effectively delayed desegregation of the school – as did the mobs of white individuals outside. Ironically, weeks later, the National Guard and the U.S. Army would enforce integration and the safety of the “Little Rock Nine” on orders from President Dwight Eisenhower.
One of the most tragic cases of the National Guard in an educational setting came in 1970 at Kent State University. The National Guard was brought to campus to respond to protests over American involvement in the Vietnam War. The guardsmen fatally shot four students.
In 2012, then-Sen. Barbara Boxer, a Democrat from California, proposed funding to use the National Guard to provide school security in the wake of the Sandy Hook school shooting. The bill was not passed.
More recently, the National Guard filled teacher shortages in New Mexico’s K-12 schools during the quarantines and sickness of the pandemic. While the idea did not catch on nationally, teachers and school personnel in New Mexico generally reported positive experiences.
Can the National Guard address school discipline?
The National Guard’s mission includes responding to domestic emergencies. Members of the guard are part-time service members who maintain civilian lives. Some are students themselves in colleges and universities. Does this mission and training position the National Guard to respond to incidents of student misbehavior and school violence?
On the one hand, New Mexico’s pandemic experience shows the National Guard could be a stopgap to staffing shortages in unusual circumstances. Similarly, the guards’ eventual role in ensuring student safety during school desegregation in Arkansas demonstrates their potential to address exceptional cases in schools, such as racially motivated mob violence. And, of course, many schools have had military personnel teaching and mentoring through Junior ROTC programs for years.
Those seeking to bring the National Guard to Brockton High School have made similar arguments. They note that staffing shortages have contributed to behavior problems.
One school board member stated: “I know that the first thought that comes to mind when you hear ‘National Guard’ is uniform and arms, and that’s not the case. They’re people like us. They’re educated. They’re trained, and we just need their assistance right now. … We need more staff to support our staff and help the students learn (and) have a safe environment.”
Yet, there are reasons to question whether calls for the National Guard are the best way to address school misconduct and behavior. First, the National Guard is a temporary measure that does little to address the underlying causes of student misbehavior and school violence.
Research has shown that students benefit from effective teaching, meaningful and sustained relationships with school personnel and positive school environments. Such educative and supportive environments have been linked to safer schools. National Guard members are not trained as educators or counselors and, as a temporary measure, would not remain in the school to establish durable relationships with students.
What is more, a military presence – particularly if uniformed or armed – may make students feel less welcome at school or escalate situations.
Schools have already seen an increase in militarization. For example, school police departments have gone so far as to acquire grenade launchers and mine-resistant armored vehicles.
Research has found that school police make students more likely to be suspended and to be arrested. Similarly, while a National Guard presence may address misbehavior temporarily, their presence could similarly result in students experiencing punitive or exclusionary responses to behavior.
Students deserve a solution other than the guard
School violence and disruptions are serious problems that can harm students. Unfortunately, schools and educators have increasingly viewed student misbehavior as a problem to be dealt with through suspensions and police involvement.
A number of people – from the NAACP to the local mayor and other members of the school board – have criticized Brockton’s request for the National Guard. Governor Maura Healey has said she will not deploy the guard to the school.
However, the case of Brockton High School points to real needs. Educators there, like in other schools nationally, are facing a tough situation and perceive a lack of support and resources.
Many schools need more teachers and staff. Students need access to mentors and counselors. With these resources, schools can better ensure educators are able to do their jobs without military intervention.
F. Chris Curran has received funding from the US Department of Justice, the Bureau of Justice Assistance, and the American Civil Liberties Union for work on school safety and discipline.
army governor pandemic mexicoGovernment
Chinese migration to US is nothing new – but the reasons for recent surge at Southern border are
A gloomier economic outlook in China and tightening state control have combined with the influence of social media in encouraging migration.
Share this:


The brief closure of the Darien Gap – a perilous 66-mile jungle journey linking South American and Central America – in February 2024 temporarily halted one of the Western Hemisphere’s busiest migration routes. It also highlighted its importance to a small but growing group of people that depend on that pass to make it to the U.S.: Chinese migrants.
While a record 2.5 million migrants were detained at the United States’ southwestern land border in 2023, only about 37,000 were from China.
I’m a scholar of migration and China. What I find most remarkable in these figures is the speed with which the number of Chinese migrants is growing. Nearly 10 times as many Chinese migrants crossed the southern border in 2023 as in 2022. In December 2023 alone, U.S. Border Patrol officials reported encounters with about 6,000 Chinese migrants, in contrast to the 900 they reported a year earlier in December 2022.
The dramatic uptick is the result of a confluence of factors that range from a slowing Chinese economy and tightening political control by President Xi Jinping to the easy access to online information on Chinese social media about how to make the trip.
Middle-class migrants
Journalists reporting from the border have generalized that Chinese migrants come largely from the self-employed middle class. They are not rich enough to use education or work opportunities as a means of entry, but they can afford to fly across the world.
According to a report from Reuters, in many cases those attempting to make the crossing are small-business owners who saw irreparable damage to their primary or sole source of income due to China’s “zero COVID” policies. The migrants are women, men and, in some cases, children accompanying parents from all over China.
Chinese nationals have long made the journey to the United States seeking economic opportunity or political freedom. Based on recent media interviews with migrants coming by way of South America and the U.S.’s southern border, the increase in numbers seems driven by two factors.
First, the most common path for immigration for Chinese nationals is through a student visa or H1-B visa for skilled workers. But travel restrictions during the early months of the pandemic temporarily stalled migration from China. Immigrant visas are out of reach for many Chinese nationals without family or vocation-based preferences, and tourist visas require a personal interview with a U.S. consulate to gauge the likelihood of the traveler returning to China.
Social media tutorials
Second, with the legal routes for immigration difficult to follow, social media accounts have outlined alternatives for Chinese who feel an urgent need to emigrate. Accounts on Douyin, the TikTok clone available in mainland China, document locations open for visa-free travel by Chinese passport holders. On TikTok itself, migrants could find information on where to cross the border, as well as information about transportation and smugglers, commonly known as “snakeheads,” who are experienced with bringing migrants on the journey north.
With virtual private networks, immigrants can also gather information from U.S. apps such as X, YouTube, Facebook and other sites that are otherwise blocked by Chinese censors.
Inspired by social media posts that both offer practical guides and celebrate the journey, thousands of Chinese migrants have been flying to Ecuador, which allows visa-free travel for Chinese citizens, and then making their way over land to the U.S.-Mexican border.
This journey involves trekking through the Darien Gap, which despite its notoriety as a dangerous crossing has become an increasingly common route for migrants from Venezuela, Colombia and all over the world.
In addition to information about crossing the Darien Gap, these social media posts highlight the best places to cross the border. This has led to a large share of Chinese asylum seekers following the same path to Mexico’s Baja California to cross the border near San Diego.
Chinese migration to US is nothing new
The rapid increase in numbers and the ease of accessing information via social media on their smartphones are new innovations. But there is a longer history of Chinese migration to the U.S. over the southern border – and at the hands of smugglers.
From 1882 to 1943, the United States banned all immigration by male Chinese laborers and most Chinese women. A combination of economic competition and racist concerns about Chinese culture and assimilability ensured that the Chinese would be the first ethnic group to enter the United States illegally.
With legal options for arrival eliminated, some Chinese migrants took advantage of the relative ease of movement between the U.S. and Mexico during those years. While some migrants adopted Mexican names and spoke enough Spanish to pass as migrant workers, others used borrowed identities or paperwork from Chinese people with a right of entry, like U.S.-born citizens. Similarly to what we are seeing today, it was middle- and working-class Chinese who more frequently turned to illegal means. Those with money and education were able to circumvent the law by arriving as students or members of the merchant class, both exceptions to the exclusion law.
Though these Chinese exclusion laws officially ended in 1943, restrictions on migration from Asia continued until Congress revised U.S. immigration law in the Hart-Celler Act in 1965. New priorities for immigrant visas that stressed vocational skills as well as family reunification, alongside then Chinese leader Deng Xiaoping’s policies of “reform and opening,” helped many Chinese migrants make their way legally to the U.S. in the 1980s and 1990s.
Even after the restrictive immigration laws ended, Chinese migrants without the education or family connections often needed for U.S. visas continued to take dangerous routes with the help of “snakeheads.”
One notorious incident occurred in 1993, when a ship called the Golden Venture ran aground near New York, resulting in the drowning deaths of 10 Chinese migrants and the arrest and conviction of the snakeheads attempting to smuggle hundreds of Chinese migrants into the United States.
Existing tensions
Though there is plenty of precedent for Chinese migrants arriving without documentation, Chinese asylum seekers have better odds of success than many of the other migrants making the dangerous journey north.
An estimated 55% of Chinese asylum seekers are successful in making their claims, often citing political oppression and lack of religious freedom in China as motivations. By contrast, only 29% of Venezuelans seeking asylum in the U.S. have their claim granted, and the number is even lower for Colombians, at 19%.
The new halt on the migratory highway from the south has affected thousands of new migrants seeking refuge in the U.S. But the mix of push factors from their home country and encouragement on social media means that Chinese migrants will continue to seek routes to America.
And with both migration and the perceived threat from China likely to be features of the upcoming U.S. election, there is a risk that increased Chinese migration could become politicized, leaning further into existing tensions between Washington and Beijing.
Meredith Oyen does not work for, consult, own shares in or receive funding from any company or organization that would benefit from this article, and has disclosed no relevant affiliations beyond their academic appointment.
congress pandemic deaths south america mexico china

Veterans Affairs Kept COVID-19 Vaccine Mandate In Place Without Evidence


The Coming Of The Police State In America


‘I couldn’t stand the pain’: the Turkish holiday resort that’s become an emergency dental centre for Britons who can’t get treated at home


Beloved mall retailer files Chapter 7 bankruptcy, will liquidate


February Employment Situation


Low Iron Levels In Blood Could Trigger Long COVID: Study


Is the National Guard a solution to school violence?


Rand Paul Teases Senate GOP Leader Run – Musk Says “I Would Support”


Vaccine-skeptical mothers say bad health care experiences made them distrust the medical system


Are Voters Recoiling Against Disorder?
-

 Uncategorized3 weeks ago
All Of The Elements Are In Place For An Economic Crisis Of Staggering Proportions
-

 Uncategorized1 month ago
Cathie Wood sells a major tech stock (again)
-

 Uncategorized3 weeks ago
California Counties Could Be Forced To Pay $300 Million To Cover COVID-Era Program
-

 Uncategorized2 weeks ago
Apparel Retailer Express Moving Toward Bankruptcy
-

 Uncategorized4 weeks ago
Industrial Production Decreased 0.1% in January
-

 International3 days ago
Walmart launches clever answer to Target’s new membership program
-

 International3 days ago
EyePoint poaches medical chief from Apellis; Sandoz CFO, longtime BioNTech exec to retire
-

 Uncategorized3 weeks ago
RFK Jr: The Wuhan Cover-Up & The Rise Of The Biowarfare-Industrial Complex