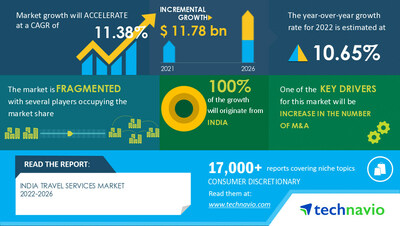
NEW YORK, Jan. 16, 2023 /PRNewswire/ -- The India travel services market size is estimated to increase by USD 11.78 billion from 2021 to 2026. The market's growth momentum will accelerate at a CAGR of 11.38% during the forecast period, according to Technavio - Request a sample report
Travel services market in India – Vendor analysis
Vendor offerings -
- Airbnb Inc. - The company offers travel services such as business travel with places to stay and explore.
- Cox and Kings Ltd. - The company offers travel services such as Indian Splendor and Boutique Rajasthan.
- Fairfax Financial Holdings Ltd. - The company offers travel services such as flights, hotels, and insurance under the subsidiary Thomas Cook.
- Indian Railway Catering and Tourism Corp. Ltd. - The company offers travel services such as flights, hotels, bus tickets, and tour packages.
- For details on vendors and their offerings – Buy the report!
Vendor landscape –
The travel services market in India is fragmented, with the presence of several global as well as regional vendors. A few prominent vendors that offer travel services in India in the market are Airbnb Inc., ANI Technologies Private Ltd., Cox and Kings Ltd., Expedia Group Inc., Fairfax Financial Holdings Ltd., Indian Railway Catering and Tourism Corp. Ltd., Kesari Tours Pvt. Ltd., Mahindra Holidays and Resorts India Ltd., MakeMyTrip Ltd., Meru Mobility Tech Private Ltd., One97 Communications Ltd., Oravel Stays Ltd., Radiant Info Systems Ltd., Treebo Hotels, TripAdvisor LLC, Uber Technologies Inc., Walmart Inc., Yatra Online Inc., and ITC Ltd. and others.
Vendors invest significantly to procure good quality products and deliver services to their customers. They focus on building brand and brand equity to differentiate themselves from competing brands. They differentiate themselves based on quality, regulatory compliance, and innovation and offer products with different features. Price differentiation among vendors is moderate due to high competition. The factors of differentiation are expected to drive the growth of the market during the forecast period.
Travel services market in India - Customer landscape
To help companies evaluate and develop growth strategies, the report outlines –
- Key purchase criteria
- Adoption rates
- Adoption lifecycle
- Drivers of price sensitivity
Travel services market in India - Segmentation assessment
Segment overview
Technavio has segmented the market based on service (domestic flight services, hotel accommodation services, rail ticket services, cab services, and others).
- The online segment will grow at a significant rate during the forecast period. Consumers prefer online platforms for booking travel services as they are convenient. This is propelling sales generated through this segment. This shift is led by the wide penetration and geographical reach of online travel service providers such as MakeMyTrip, TripAdvisor, IRCTC, and Yatra. Hence, sales through the online travel services segment are expected to grow at a rapid pace during the forecast period.
Download a sample report
Travel services market in India – Market dynamics
Leading drivers - The increase in the number of M&A, partnerships, and strategic alliances is driving the growth of this segment. M&A activities, partnerships, and strategic alliances help players in increasing their market shares, improving their services, and expanding their geographic reach and service portfolios. Many vendors are collaborating with other companies to expand their customer reach and services across the country. In addition, the market is witnessing partnerships between vendors and government agencies. Thus, The increasing number of M&A activities, partnerships, and strategic alliances is fueling market growth in India.
Key trends - The introduction of low-cost airlines is a key trend in the market. Airlines are the most preferred mode of travel, as they offer comfort and a short travel duration. The introduction of low-cost airlines has reduced the extra cost burden on travelers and encouraged the population to avail of travel services. Moreover, various companies from the SME business sector opt for air travel for business trips. In addition, the availability of low-cost air tickets has impacted the tourism industry positively. These factors will support the growth of the market during the forecast period.
Major challenges - The high competition among players leading to a price war will challenge the travel services market in India during the forecast period. The market is dominated by major global vendors that face stiff competition from other global, regional, and local vendors. Vendors invest heavily in R&D to provide advanced and innovative service offerings suitable for different types of occasions and end-users, such as holiday packages. Regional and local vendors compete among themselves to market and sell unique services. The intense competition triggers price wars among vendors, which adversely affects their profit margins. These factors will hinder the market growth during the forecast period.
Drivers, trends, and challenges have an impact on market dynamics, which can impact businesses. Find more insights in a sample report!
What are the key data covered in this India travel services market report?
- CAGR of the market during the forecast period
- Detailed information on factors that will drive the growth of the travel services market in India between 2022 and 2026
- Precise estimation of the size of the travel services market in India and its contribution to the parent market
- Accurate predictions about upcoming trends and changes in consumer behavior
- A thorough analysis of the market's competitive landscape and detailed information about vendors
- Comprehensive analysis of factors that will challenge the growth of India travel services market vendors
Gain instant access to 17,000+ market research reports.
Technavio's SUBSCRIPTION platform
Related Reports:
The travel market size is expected to increase by USD 451.19 billion from 2021 to 2026, and the market's growth momentum will accelerate at a CAGR of 13.86%. This market research report extensively covers segmentation by sector (airline, hotel, travel activities, and others) and geography (APAC, Europe, North America, South America, and MEA).
The luxury travel market is estimated to grow at a CAGR of 11.5% between 2022 and 2027. The size of the market is forecasted to increase by USD 703.14 billion. This report extensively covers market segmentation by type (adventure, personalized, cruising and yachting, culinary, and others) and geography (Europe, North America, APAC, Middle East and Africa, and South America).
India Travel Services Market Scope
|
Report Coverage
| Details
|
Page number
| 122
|
Base year
| 2021
|
Forecast period
| 2022-2026
|
Growth momentum & CAGR
| Accelerate at a CAGR of 11.38%
|
Market growth 2022-2026
| USD 11.78 billion
|
Market structure
| Fragmented
|
YoY growth 2021-2022 (%)
| 10.65
|
Competitive landscape
| Leading vendors, market positioning of vendors, competitive strategies, and industry risks
|
Key companies profiled
| Airbnb Inc., ANI Technologies Private Ltd., Cox and Kings Ltd., Expedia Group Inc., Fairfax Financial Holdings Ltd., Indian Railway Catering and Tourism Corp. Ltd., Kesari Tours Pvt. Ltd., Mahindra Holidays and Resorts India Ltd., MakeMyTrip Ltd., Meru Mobility Tech Private Ltd., One97 Communications Ltd., Oravel Stays Ltd., Radiant Info Systems Ltd., Treebo Hotels, TripAdvisor LLC, Uber Technologies Inc., Walmart Inc., Yatra Online Inc., and ITC Ltd.
|
Market dynamics
| Parent market analysis, market growth inducers and obstacles, fast-growing and slow-growing segment analysis, COVID-19 impact and recovery analysis and future consumer dynamics, and market condition analysis for the forecast period.
|
Customization purview
| If our report has not included the data that you are looking for, you can reach out to our analysts and get segments customized.
|
Customization purview
| If our report has not included the data that you are looking for, you can reach out to our analysts and get segments customized.
|
Browse for Technavio's consumer discretionary market reports
Table of contents
1 Executive Summary
- 1.1 Market overview
- Exhibit 01: Executive Summary – Chart on Market Overview
- Exhibit 02: Executive Summary – Data Table on Market Overview
- Exhibit 03: Executive Summary – Chart on Country Market Characteristics
- Exhibit 04: Executive Summary – Chart on Market Segmentation by Mode of Booking
- Exhibit 05: Executive Summary – Chart on Market Segmentation by Service
- Exhibit 06: Executive Summary – Chart on Vendor Market Positioning
2 Market Landscape
- 2.1 Market ecosystem
- Exhibit 07: Parent market
- Exhibit 08: Market Characteristics
3 Market Sizing
- 3.1 Market definition
- Exhibit 09: Offerings of vendors included in the market definition
- 3.2 Market segment analysis
- Exhibit 10: Market segments
- 3.4 Market outlook: Forecast for 2021-2026
- Exhibit 11: Chart on India - Market size and forecast 2021-2026 ($ million)
- Exhibit 12: Data Table on India - Market size and forecast 2021-2026 ($ million)
- Exhibit 13: Chart on India: Year-over-year growth 2021-2026 (%)
- Exhibit 14: Data Table on India: Year-over-year growth 2021-2026 (%)
4 Five Forces Analysis
- 4.1 Five forces summary
- Exhibit 15: Five forces analysis - Comparison between 2021 and 2026
- 4.2 Bargaining power of buyers
- Exhibit 16: Chart on Bargaining power of buyers – Impact of key factors 2021 and 2026
- 4.3 Bargaining power of suppliers
- Exhibit 17: Bargaining power of suppliers – Impact of key factors in 2021 and 2026
- 4.4 Threat of new entrants
- Exhibit 18: Threat of new entrants – Impact of key factors in 2021 and 2026
- 4.5 Threat of substitutes
- Exhibit 19: Threat of substitutes – Impact of key factors in 2021 and 2026
- 4.6 Threat of rivalry
- Exhibit 20: Threat of rivalry – Impact of key factors in 2021 and 2026
- 4.7 Market condition
- Exhibit 21: Chart on Market condition - Five forces 2021 and 2026
5 Market Segmentation by Mode of Booking
- 5.1 Market segments
- Exhibit 22: Chart on Mode of Booking - Market share 2021-2026 (%)
- Exhibit 23: Data Table on Mode of Booking - Market share 2021-2026 (%)
- 5.2 Comparison by Mode of Booking
- Exhibit 24: Chart on Comparison by Mode of Booking
- Exhibit 25: Data Table on Comparison by Mode of Booking
- 5.3 Online - Market size and forecast 2021-2026
- Exhibit 26: Chart on Online - Market size and forecast 2021-2026 ($ million)
- Exhibit 27: Data Table on Online - Market size and forecast 2021-2026 ($ million)
- Exhibit 28: Chart on Online - Year-over-year growth 2021-2026 (%)
- Exhibit 29: Data Table on Online - Year-over-year growth 2021-2026 (%)
- 5.4 Offline - Market size and forecast 2021-2026
- Exhibit 30: Chart on Offline - Market size and forecast 2021-2026 ($ million)
- Exhibit 31: Data Table on Offline - Market size and forecast 2021-2026 ($ million)
- Exhibit 32: Chart on Offline - Year-over-year growth 2021-2026 (%)
- Exhibit 33: Data Table on Offline - Year-over-year growth 2021-2026 (%)
- 5.5 Market opportunity by Mode of Booking
- Exhibit 34: Market opportunity by Mode of Booking ($ million)
6 Market Segmentation by Service
- 6.1 Market segments
- Exhibit 35: Chart on Service - Market share 2021-2026 (%)
- Exhibit 36: Data Table on Service - Market share 2021-2026 (%)
- 6.2 Comparison by Service
- Exhibit 37: Chart on Comparison by Service
- Exhibit 38: Data Table on Comparison by Service
- 6.3 Domestic flight services - Market size and forecast 2021-2026
- Exhibit 39: Chart on Domestic flight services - Market size and forecast 2021-2026 ($ million)
- Exhibit 40: Data Table on Domestic flight services - Market size and forecast 2021-2026 ($ million)
- Exhibit 41: Chart on Domestic flight services - Year-over-year growth 2021-2026 (%)
- Exhibit 42: Data Table on Domestic flight services - Year-over-year growth 2021-2026 (%)
- 6.4 Hotel accommodation services - Market size and forecast 2021-2026
- Exhibit 43: Chart on Hotel accommodation services - Market size and forecast 2021-2026 ($ million)
- Exhibit 44: Data Table on Hotel accommodation services - Market size and forecast 2021-2026 ($ million)
- Exhibit 45: Chart on Hotel accommodation services - Year-over-year growth 2021-2026 (%)
- Exhibit 46: Data Table on Hotel accommodation services - Year-over-year growth 2021-2026 (%)
- 6.5 Rail ticket services - Market size and forecast 2021-2026
- Exhibit 47: Chart on Rail ticket services - Market size and forecast 2021-2026 ($ million)
- Exhibit 48: Data Table on Rail ticket services - Market size and forecast 2021-2026 ($ million)
- Exhibit 49: Chart on Rail ticket services - Year-over-year growth 2021-2026 (%)
- Exhibit 50: Data Table on Rail ticket services - Year-over-year growth 2021-2026 (%)
- 6.6 Cab services - Market size and forecast 2021-2026
- Exhibit 51: Chart on Cab services - Market size and forecast 2021-2026 ($ million)
- Exhibit 52: Data Table on Cab services - Market size and forecast 2021-2026 ($ million)
- Exhibit 53: Chart on Cab services - Year-over-year growth 2021-2026 (%)
- Exhibit 54: Data Table on Cab services - Year-over-year growth 2021-2026 (%)
- 6.7 Others - Market size and forecast 2021-2026
- Exhibit 55: Chart on Others - Market size and forecast 2021-2026 ($ million)
- Exhibit 56: Data Table on Others - Market size and forecast 2021-2026 ($ million)
- Exhibit 57: Chart on Others - Year-over-year growth 2021-2026 (%)
- Exhibit 58: Data Table on Others - Year-over-year growth 2021-2026 (%)
- 6.8 Market opportunity by Service
- Exhibit 59: Market opportunity by Service ($ million)
7 Customer Landscape
- 7.1 Customer landscape overview
- Exhibit 60: Analysis of price sensitivity, lifecycle, customer purchase basket, adoption rates, and purchase criteria
8 Drivers, Challenges, and Trends
- 8.3 Impact of drivers and challenges
- Exhibit 61: Impact of drivers and challenges in 2021 and 2026
9 Vendor Landscape
- 9.2 Vendor landscape
- Exhibit 62: Overview on Criticality of inputs and Factors of differentiation
- 9.3 Landscape disruption
- Exhibit 63: Overview on factors of disruption
- 9.4 Industry risks
- Exhibit 64: Impact of key risks on business
10 Vendor Analysis
- 10.1 Vendors covered
- Exhibit 65: Vendors covered
- 10.2 Market positioning of vendors
- Exhibit 66: Matrix on vendor position and classification
- 10.3 Airbnb Inc.
- Exhibit 67: Airbnb Inc. - Overview
- Exhibit 68: Airbnb Inc. - Product / Service
- Exhibit 69: Airbnb Inc. - Key offerings
- 10.4 Cox and Kings Ltd.
- Exhibit 70: Cox and Kings Ltd. - Overview
- Exhibit 71: Cox and Kings Ltd. - Product / Service
- Exhibit 72: Cox and Kings Ltd. - Key offerings
- 10.5 Fairfax Financial Holdings Ltd.
- Exhibit 73: Fairfax Financial Holdings Ltd. - Overview
- Exhibit 74: Fairfax Financial Holdings Ltd. - Business segments
- Exhibit 75: Fairfax Financial Holdings Ltd. - Key offerings
- Exhibit 76: Fairfax Financial Holdings Ltd. - Segment focus
- 10.6 Indian Railway Catering and Tourism Corp. Ltd.
- Exhibit 77: Indian Railway Catering and Tourism Corp. Ltd. - Overview
- Exhibit 78: Indian Railway Catering and Tourism Corp. Ltd. - Business segments
- Exhibit 79: Indian Railway Catering and Tourism Corp. Ltd. - Key offerings
- Exhibit 80: Indian Railway Catering and Tourism Corp. Ltd. - Segment focus
- 10.7 ITC Ltd.
- Exhibit 81: ITC Ltd. - Overview
- Exhibit 82: ITC Ltd. - Business segments
- Exhibit 83: ITC Ltd. - Key offerings
- Exhibit 84: ITC Ltd. - Segment focus
- 10.8 MakeMyTrip Ltd.
- Exhibit 85: MakeMyTrip Ltd. - Overview
- Exhibit 86: MakeMyTrip Ltd. - Business segments
- Exhibit 87: MakeMyTrip Ltd. - Key offerings
- Exhibit 88: MakeMyTrip Ltd. - Segment focus
- 10.9 Oravel Stays Ltd.
- Exhibit 89: Oravel Stays Ltd. - Overview
- Exhibit 90: Oravel Stays Ltd. - Product / Service
- Exhibit 91: Oravel Stays Ltd. - Key offerings
- 10.10 TripAdvisor LLC
- Exhibit 92: TripAdvisor LLC - Overview
- Exhibit 93: TripAdvisor LLC - Business segments
- Exhibit 94: TripAdvisor LLC - Key offerings
- Exhibit 95: TripAdvisor LLC - Segment focus
- 10.11 Walmart Inc.
- Exhibit 96: Walmart Inc. - Overview
- Exhibit 97: Walmart Inc. - Business segments
- Exhibit 98: Walmart Inc. - Key news
- Exhibit 99: Walmart Inc. - Key offerings
- Exhibit 100: Walmart Inc. - Segment focus
- 10.12 Yatra Online Inc.
- Exhibit 101: Yatra Online Inc. - Overview
- Exhibit 102: Yatra Online Inc. - Business segments
- Exhibit 103: Yatra Online Inc. - Key offerings
- Exhibit 104: Yatra Online Inc. - Segment focus
11 Appendix
- 11.2 Inclusions and exclusions checklist
- Exhibit 105: Inclusions checklist
- Exhibit 106: Exclusions checklist
- 11.3 Currency conversion rates for US$
- Exhibit 107: Currency conversion rates for US$
- 11.4 Research methodology
- Exhibit 108: Research methodology
- Exhibit 109: Validation techniques employed for market sizing
- Exhibit 110: Information sources
- 11.5 List of abbreviations
- Exhibit 111: List of abbreviations
About Us
Technavio is a leading global technology research and advisory company. Their research and analysis focus on emerging market trends and provide actionable insights to help businesses identify market opportunities and develop effective strategies to optimize their market positions. With over 500 specialized analysts, Technavio's report library consists of more than 17,000 reports and counting, covering 800 technologies, spanning across 50 countries. Their client base consists of enterprises of all sizes, including more than 100 Fortune 500 companies. This growing client base relies on Technavio's comprehensive coverage, extensive research, and actionable market insights to identify opportunities in existing and potential markets and assess their competitive positions within changing market scenarios.
Contact
Technavio Research
Jesse Maida
Media & Marketing Executive
US: +1 844 364 1100
UK: +44 203 893 3200
Email: media@technavio.com
Website: www.technavio.com/
View original content to download multimedia:https://www.prnewswire.com/news-releases/india-travel-services-market-size-to-grow-by-usd-11-78-billion-from-2021-to-2026-a-descriptive-analysis-of-customer-landscape-vendor-assessment-and-market-dynamics---technavio-301720073.html
SOURCE Technavio

")