Uncategorized
Here’s Why Housing Is Unaffordable For The Bottom 90%
Here’s Why Housing Is Unaffordable For The Bottom 90%
Authored by Charles Hugh Smith via OfTwoMinds blog,
This is the direct consequence…
Share this:

Authored by Charles Hugh Smith via OfTwoMinds blog,
This is the direct consequence of the Federal Reserve's decades of unprecedented stimulus: extremes of wealth and income inequality that gave the wealthiest households the means to bid up housing to the point it's no longer affordable to the bottom 90%.
The superficial conclusion that the reason why housing is unaffordable is a scarcity of housing misses a key dynamic in supply and demand: who has too much money and where do they park it??
The reality is obvious but conventional analysts don't see it, largely because it doesn't fit the approved narratives. Here's why housing is unaffordable to the bottom 90%:
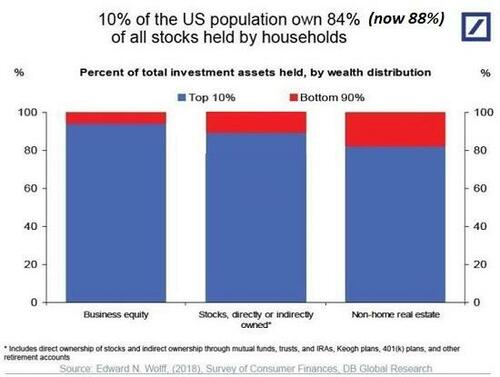
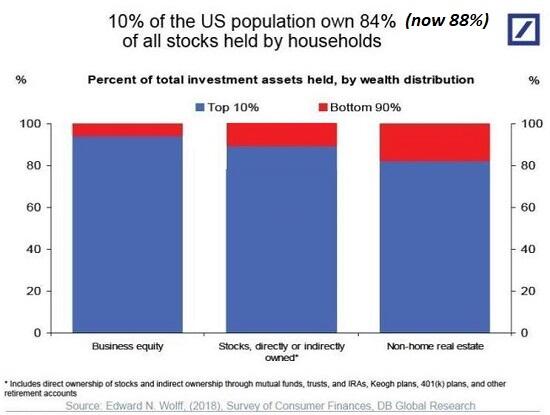
1. The U.S. economy is a bubble economy that funnels the vast majority of gains into the top 10% who own 90% of all income producing assets. Bubbles create astounding sums of unearned wealth and distribute it very asymmetrically: the already-wealthy who inherited assets or acquired them when they were cheap reap most of the gains.
Please examine the first two charts below to see how this works. The first chart shows that the top 10% own between 85% and 95% of all income producing assets: business equity, stocks, bonds and other securities, and non-home real estate, i.e. second homes and income-generating properties.
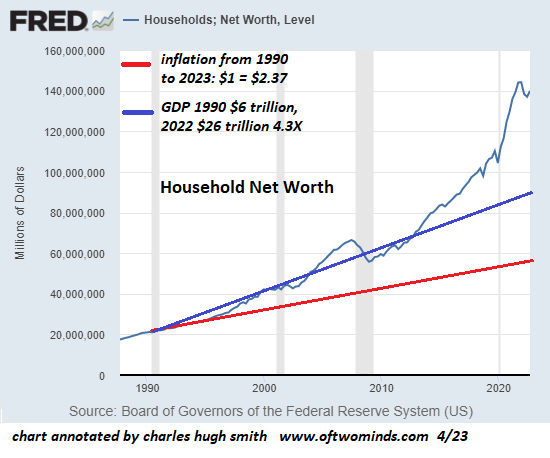
The second chart shows that Household Net Worth--concentrated in the top 10%--soared far above GDP in the Bubble Economy, in effect creating $55 trillion out of thin air and handing 90% of it to the wealthy. Recall that net worth is assets minus liabilities such as debt, so this is what's left after subtracting liabilities/debts. The less wealthy tend to have fewer assets and more debts, so someone may hold title to a $1 million home, but if their mortgage is $900,000, their net worth is only $100,000.
Also note that the family home doesn't generate income, other than for the owner of the mortgage; to the homeowner, it is an expense, not an income source.
Turning to the second chart, we see that if Household Net Worth had tracked the general economy's expansion, i.e. Gross Domestic Product (GDP), it would be less than $90 trillion. Thanks to the Bubble Economy, it's $145.9 trillion, according the Federal Reserve's database. That $55 trillion above the real-world economy's actual expansion is an artifact of the Bubble Economy, an artificial construct of the Federal Reserve's decades of unprecedented manipulation of interest rates and monetary stimulus.
Note that in the previous housing and stock market bubble circa 2006-08, Household Net Worth only exceeded GDP by $5 trillion. A nice chunk of change, to be sure, but an order of magnitude smaller than the gargantuan $55 trillion in "bubble wealth" created in the current central bank Everything Bubble.
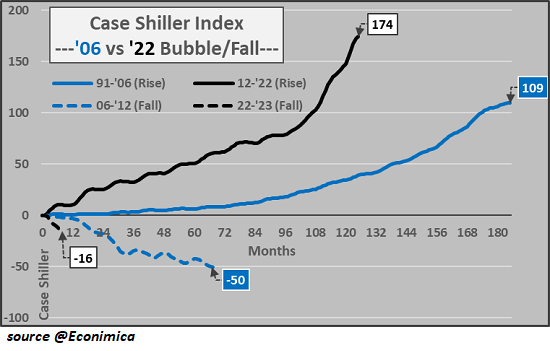
2. As the chart below of housing bubbles #1 and #2 shows, the Fed's unprecedented stimulus inflated Housing Bubbles # and #2. The stock market bubble took off around 1995 (with the introduction of the Netscape browser), and housing's ascent lagged a few years, beginning in the late 1990s. (The chart is the Case-Shiller National Home Price Index.)
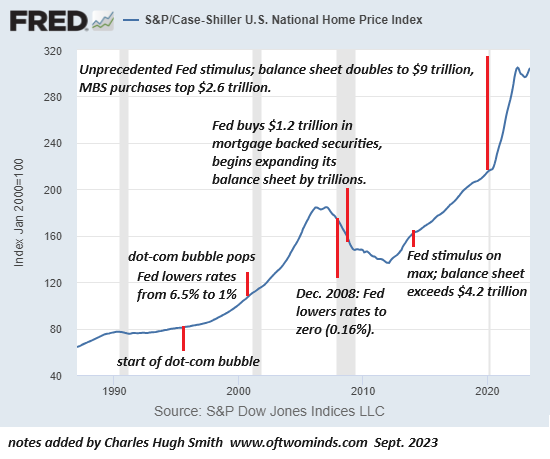
But Housing Bubble #1 really only took off after the dot-com stock market bubble popped, and the Fed aggressively lowered interest rates: the Fed Funds Rate fell from 6.5% in summer 2000 to 1% in the summer of 2003.
It remained at a historically low 3% well into 2005, when the housing bubble entered its rocket booster phase of euphoria. The Fed eventually normalized rates, returning to 5% by mid-2007, but as the housing bubble began popping, the Fed quickly started cutting rates again, dropping the Fed Funds Rate to near-zero by December 2008 (0.16%).
3. The wealth created by the Fed's stock and bond bubbles flowed into housing. It is not a coincidence that the Housing Bubble #1 expanded rapidly from 2000 onward. As the stock market bubble deflated, those who had reaped the gains sought a new place to park their excess wealth, and with interest rates falling due to the Fed, housing was the place to put that bubble-generated capital to work: mortgage rates hit historic lows, and the resulting bubble was self-reinforcing: simply securing the purchase rights to an as-yet unbuilt house with a small down payment could generate astounding gains in a few months.
Financial fraud--oops, I mean "innovations"--added icing to the Fed's bubble cake: liar loans, zero down payment mortgages, adjustable rate mortgages, deceptive packaging of toxic mortgages into highly rated mortgage backed securities, etc., fueled the bubble's final blow-off top.
Massive, sustained Fed stimulus inflated Housing Bubble #2, a bubble that went ballistic in 2020 as the Fed engaged in unprecedented stimulus, doubling its balance sheet to $9 trillion, dropping the Fed Funds Rate from a meager 2.4% back to zero, and boosting its portfolio of mortgage-backed securities to $2.6 trillion.
Fed stimulus also inflated bubbles in stocks and bonds: as interest rate fell to near-zero, bonds soared in value, and the S&P 500 index of stocks rocketed from 666 in early 2009 to 3,380 in early 2020--a five-fold increase.
4. The vast majority of these massive gains accrued to the top 10%, roughly 13 million households. (There are 131 million households in the U.S.) The top 10% includes the Financial Nobility (billionaires and those worth hundreds of millions, the top 0.01%); the Financial Aristocracy (households worth tens of millions, the top 0.5%), the wealthy (net worth in the many millions, the top 1%), and the upper middle-class (the bottom 9% of the top 10%).
Historically speaking, the upper-middle class has often owned more than one property: a vacation cabin on the lake or beach, raw land held for investment, or a rental property. With interest rates locked by the Fed at unprecedented lows, the 12 million households in this class who had seen their stock, bond and property portfolios zoom to staggering heights, tapped their new-found wealth and ample credit to go on a housing / real estate buying spree.
Recall that housing was still affordable in the mid to late 1990s. Mechanics and librarians could still buy a modest home in a good neighborhood in the San Francisco Bay Area and many other now-unaffordable metro areas. When the Housing Bubble #1 finally popped, housing was very briefly affordable circa 2012.
5. Many frugal, investment-savvy upper-middle class households acquired properties when they were still affordable. It's not at all uncommon for families to own multiple income properties in addition to the family home. Vacation homes bought decades ago at low prices were converted to short-term vacation rentals for part of the year, generating income when the family wasn't using the home. Nearby cabins were snapped up for investment rentals.
The upper-middle class also inherited properties and other assets. Assets--for example, houses--bought decades ago for $30,000 or $40,000 have soared to $1 million valuations in many metro areas--or even $2 million in desirable neighborhoods. Selling a home for $1+ million leaves more than enough capital to buy multiple properties in less pricey regions.
6. Unfortunately for the upper-middle class, the Financial Aristocracy and the wealthy already own the most desirable properties in the most desirable areas. So the upper-middle class lowered their sights to what was still affordable, and this has driven gentrification: as those with excess capital and credit seek a place to park that wealth that will rise in value, neighborhoods that were once affordable quickly become unaffordable to the bottom 90% as the top 10% bid prices to the moon.
7. The immense wealth created by the Bubble Economy hasn't just enriched a few billionaires; it's created an entire class of wealthy numbering in the millions. When 10 million households have the wealth and credit to buy houses beyond the family home they live in, that's a very large pool of buyers--buyers who have seen their initial purchases soaring in value, incentivizing additional purchases of housing.
8. Housing is priced on the margins, so a relative handful of purchases can push the valuations of an entire neighborhood to the moon. Compared to stocks and bonds, housing is illiquid; transactions are few and take months to settle. The last five sales will adjust the valuation (via appraisals seeking nearby comparables) of the surrounding 100 homes.
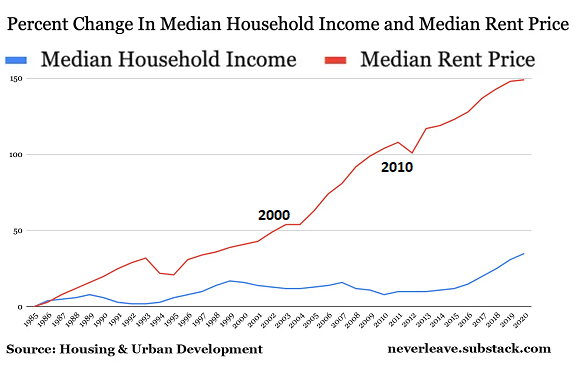
Corporations and the super-wealthy have also been on massive buying sprees, snapping up hundreds or thousands of houses as rental properties. The $55 trillion in excess "bubble wealth" is always seeking a higher return, and as rents have soared (see chart below), rental housing has been seen as a safe and profitable haven for the trillions of dollars floating around seeking a low-risk high return.
As the last chart shows, the current housing bubble is far more extreme than Housing Bubble #1. It took a much shorter period of time to reach far higher heights of overvaluation.
This is why the bottom 90% can't afford a house: the Bubble Economy created $55 trillion out of thin air and 90% of that went to the top 10%, a class historically attuned to owning real estate for income and investment. The bottom 90% skimmed a few bucks in the past 25 years of the Bubble Economy, but nowhere near enough to compete with corporations, the Financial Aristocracy or the upper-middle class.
This is the direct consequence of the Federal Reserve's decades of unprecedented stimulus: extremes of wealth and income inequality that gave the wealthiest households the means to bid up housing to the point it's no longer affordable to the bottom 90%.
* * *
My new book is now available at a 10% discount ($8.95 ebook, $18 print): Self-Reliance in the 21st Century. Read the first chapter for free (PDF)
Uncategorized
Fast-food chain closes restaurants after Chapter 11 bankruptcy
Several major fast-food chains recently have struggled to keep restaurants open.
Share this:


Competition in the fast-food space has been brutal as operators deal with inflation, consumers who are worried about the economy and their jobs and, in recent months, the falling cost of eating at home.
Add in that many fast-food chains took on more debt during the covid pandemic and that labor costs are rising, and you have a perfect storm of problems.
It's a situation where Restaurant Brands International (QSR) has suffered as much as any company.
Related: Wendy's menu drops a fan favorite item, adds something new
Three major Burger King franchise operators filed for bankruptcy in 2023, and the chain saw hundreds of stores close. It also saw multiple Popeyes franchisees move into bankruptcy, with dozens of locations closing.
RBI also stepped in and purchased one of its key franchisees.
"Carrols is the largest Burger King franchisee in the United States today, operating 1,022 Burger King restaurants in 23 states that generated approximately $1.8 billion of system sales during the 12 months ended Sept. 30, 2023," RBI said in a news release. Carrols also owns and operates 60 Popeyes restaurants in six states."
The multichain company made the move after two of its large franchisees, Premier Kings and Meridian, saw multiple locations not purchased when they reached auction after Chapter 11 bankruptcy filings. In that case, RBI bought select locations but allowed others to close.
Image source: Chen Jianli/Xinhua via Getty
Another fast-food chain faces bankruptcy problems
Bojangles may not be as big a name as Burger King or Popeye's, but it's a popular chain with more than 800 restaurants in eight states.
"Bojangles is a Carolina-born restaurant chain specializing in craveable Southern chicken, biscuits and tea made fresh daily from real recipes, and with a friendly smile," the chain says on its website. "Founded in 1977 as a single location in Charlotte, our beloved brand continues to grow nationwide."
Like RBI, Bojangles uses a franchise model, which makes it dependent on the financial health of its operators. The company ultimately saw all its Maryland locations close due to the financial situation of one of its franchisees.
Unlike. RBI, Bojangles is not public — it was taken private by Durational Capital Management LP and Jordan Co. in 2018 — which means the company does not disclose its financial information to the public.
That makes it hard to know whether overall softness for the brand contributed to the chain seeing its five Maryland locations after a Chapter 11 bankruptcy filing.
Bojangles has a messy bankruptcy situation
Even though the locations still appear on the Bojangles website, they have been shuttered since late 2023. The locations were operated by Salim Kakakhail and Yavir Akbar Durranni. The partners operated under a variety of LLCs, including ABS Network, according to local news channel WUSA9.
The station reported that the owners face a state investigation over complaints of wage theft and fraudulent W2s. In November Durranni and ABS Network filed for bankruptcy in New Jersey, WUSA9 reported.
"Not only do former employees say these men owe them money, WUSA9 learned the former owners owe the state, too, and have over $69,000 in back property taxes."
Former employees also say that the restaurant would regularly purchase fried chicken from Popeyes and Safeway when it ran out in their stores, the station reported.
Bojangles sent the station a comment on the situation.
"The franchisee is no longer in the Bojangles system," the company said. "However, it is important to note in your coverage that franchisees are independent business owners who are licensed to operate a brand but have autonomy over many aspects of their business, including hiring employees and payroll responsibilities."
Kakakhail and Durranni did not respond to multiple requests for comment from WUSA9.
bankruptcy pandemicUncategorized
Industrial Production Increased 0.1% in February
From the Fed: Industrial Production and Capacity Utilization
Industrial production edged up 0.1 percent in February after declining 0.5 percent in January. In February, the output of manufacturing rose 0.8 percent and the index for mining climbed 2.2 p…
Share this:


Industrial production edged up 0.1 percent in February after declining 0.5 percent in January. In February, the output of manufacturing rose 0.8 percent and the index for mining climbed 2.2 percent. Both gains partly reflected recoveries from weather-related declines in January. The index for utilities fell 7.5 percent in February because of warmer-than-typical temperatures. At 102.3 percent of its 2017 average, total industrial production in February was 0.2 percent below its year-earlier level. Capacity utilization for the industrial sector remained at 78.3 percent in February, a rate that is 1.3 percentage points below its long-run (1972–2023) average.Click on graph for larger image.
emphasis added
This graph shows Capacity Utilization. This series is up from the record low set in April 2020, and above the level in February 2020 (pre-pandemic).
Capacity utilization at 78.3% is 1.3% below the average from 1972 to 2022. This was below consensus expectations.
Note: y-axis doesn't start at zero to better show the change.
 The second graph shows industrial production since 1967.
Industrial production increased to 102.3. This is above the pre-pandemic level.
Industrial production was above consensus expectations.
Uncategorized
Southwest and United Airlines have bad news for passengers
Both airlines are facing the same problem, one that could lead to higher airfares and fewer flight options.
Share this:

Airlines operate in a market that's dictated by supply and demand: If more people want to fly a specific route than there are available seats, then tickets on those flights cost more.
That makes scheduling and predicting demand a huge part of maximizing revenue for airlines. There are, however, numerous factors that go into how airlines decide which flights to put on the schedule.
Related: Major airline faces Chapter 11 bankruptcy concerns
Every airport has only a certain number of gates, flight slots and runway capacity, limiting carriers' flexibility. That's why during times of high demand — like flights to Las Vegas during Super Bowl week — do not usually translate to airlines sending more planes to and from that destination.
Airlines generally do try to add capacity every year. That's become challenging as Boeing has struggled to keep up with demand for new airplanes. If you can't add airplanes, you can't grow your business. That's caused problems for the entire industry.
Every airline retires planes each year. In general, those get replaced by newer, better models that offer more efficiency and, in most cases, better passenger amenities.
If an airline can't get the planes it had hoped to add to its fleet in a given year, it can face capacity problems. And it's a problem that both Southwest Airlines (LUV) and United Airlines have addressed in a way that's inevitable but bad for passengers.
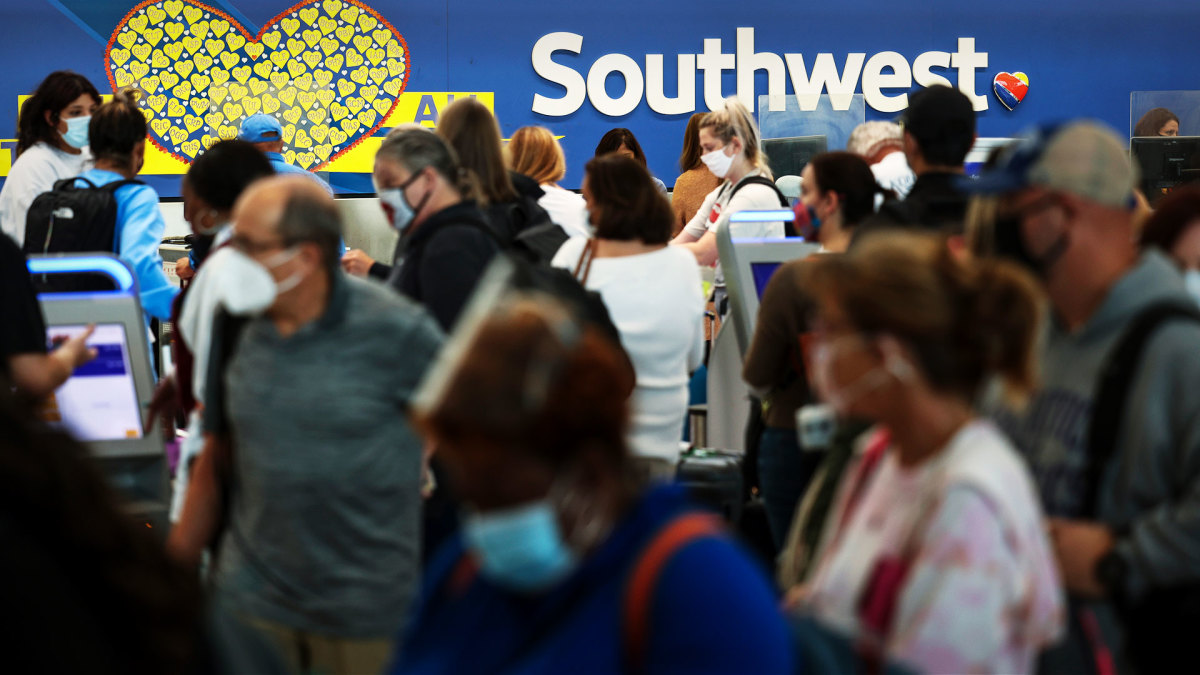
Image source: Kevin Dietsch/Getty Images
Southwest slows down its pilot hiring
In 2023, Southwest made a huge push to hire pilots. The airline lost thousands of pilots to retirement during the covid pandemic and it needed to replace them in order to build back to its 2019 capacity.
The airline successfully did that but will not continue that trend in 2024.
"Southwest plans to hire approximately 350 pilots this year, and no new-hire classes are scheduled after this month," Travel Weekly reported. "Last year, Southwest hired 1,916 pilots, according to pilot recruitment advisory firm Future & Active Pilot Advisors. The airline hired 1,140 pilots in 2022."
The slowdown in hiring directly relates to the airline expecting to grow capacity only in the low-single-digits percent in 2024.
"Moving into 2024, there is continued uncertainty around the timing of expected Boeing deliveries and the certification of the Max 7 aircraft. Our fleet plans remain nimble and currently differs from our contractual order book with Boeing," Southwest Airlines Chief Financial Officer Tammy Romo said during the airline's fourth-quarter-earnings call.
"We are planning for 79 aircraft deliveries this year and expect to retire roughly 45 700 and 4 800, resulting in a net expected increase of 30 aircraft this year."
That's very modest growth, which should not be enough of an increase in capacity to lower prices in any significant way.
United Airlines pauses pilot hiring
Boeing's (BA) struggles have had wide impact across the industry. United Airlines has also said it was going to pause hiring new pilots through the end of May.
United (UAL) Fight Operations Vice President Marc Champion explained the situation in a memo to the airline's staff.
"As you know, United has hundreds of new planes on order, and while we remain on path to be the fastest-growing airline in the industry, we just won't grow as fast as we thought we would in 2024 due to continued delays at Boeing," he said.
"For example, we had contractual deliveries for 80 Max 10s this year alone, but those aircraft aren't even certified yet, and it's impossible to know when they will arrive."
That's another blow to consumers hoping that multiple major carriers would grow capacity, putting pressure on fares. Until Boeing can get back on track, it's unlikely that competition between the large airlines will lead to lower fares.
In fact, it's possible that consumer demand will grow more than airline capacity which could push prices higher.
Related: Veteran fund manager picks favorite stocks for 2024
bankruptcy pandemic stocks

Key shipping company files for Chapter 11 bankruptcy


Pharma industry reputation remains steady at a ‘new normal’ after Covid, Harris Poll finds


These Cities Have The Highest (And Lowest) Share Of Unaffordable Neighborhoods In 2024


The Question You Should Ask Whenever You’re Wrong


Tight inventory and frustrated buyers challenge agents in Virginia


Part 1: Current State of the Housing Market; Overview for mid-March 2024


Walmart and Target make key self-checkout changes to fight theft


Industrial Production Increased 0.1% in February


Your financial plan may be riskier without bitcoin
Key shipping company files Chapter 11 bankruptcy
-

 Uncategorized3 weeks ago
All Of The Elements Are In Place For An Economic Crisis Of Staggering Proportions
-

 International1 week ago
EyePoint poaches medical chief from Apellis; Sandoz CFO, longtime BioNTech exec to retire
-

 Uncategorized4 weeks ago
California Counties Could Be Forced To Pay $300 Million To Cover COVID-Era Program
-

 Uncategorized3 weeks ago
Apparel Retailer Express Moving Toward Bankruptcy
-

 Uncategorized4 weeks ago
Industrial Production Decreased 0.1% in January
-

 International1 week ago
Walmart launches clever answer to Target’s new membership program
-

 Spread & Containment2 days ago
IFM’s Hat Trick and Reflections On Option-To-Buy M&A
-

 Uncategorized4 weeks ago
RFK Jr: The Wuhan Cover-Up & The Rise Of The Biowarfare-Industrial Complex