Connect with us

Hemp-based Foods Market Size to Grow by USD 3.54 Bn, Hemp Seed-based Foods to be Key Revenue-generating Product Segment – Technavio

Hemp-based Foods Market Size to Grow by USD 3.54 Bn, Hemp Seed-based Foods to be Key Revenue-generating Product Segment – Technavio
PR Newswire
NEW YORK, Sept. 30, 2022

NEW YORK, Sept. 30, 2022 /PRNewswire/ — According to the report “Hemp-based Fo…

Published

on

Hemp-based Foods Market Size to Grow by USD 3.54 Bn, Hemp Seed-based Foods to be Key Revenue-generating Product Segment - Technavio

PR Newswire

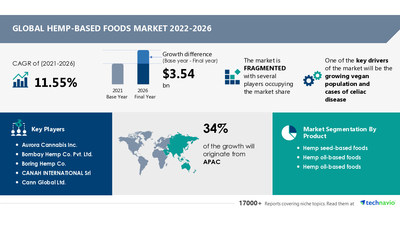
NEW YORK, Sept. 30, 2022 /PRNewswire/ -- According to the report "Hemp-based Foods Market by Product and Geography - Forecast and Analysis 2022-2026", the market will witness a YOY growth of 10.6% in 2022 and a CAGR of 11.55% during the forecast period. The market has been segmented by product (hemp seed-based foods, hemp oil-based foods, and hemp oil-based foods) and geography (North America, Europe, APAC, South America, and the Middle East and Africa).

Technavio provides a comprehensive report summary describing the market size and forecast along with research methodology. The FREE sample report is available in PDF format

Key Segment Analysis

By product, the hemp seed-based foods segment will be the largest contributor to market growth during the forecast period. Hemp seeds are a blend of protein and essential fats. Hence, they are ideal for vegans and vegetarians. These seeds are often eaten raw or added to cereals, smoothies, and other recipes.

To learn about additional highlights and key points on various market segments and their impact in coming years, View our FREE PDF Sample Report

Geographical Market Analysis 

APAC will provide maximum growth opportunities in the hemp-based foods market during the forecast period. According to our research, the region will contribute 34% of the global market during the forecast period. China and Australia are the two major markets for hemp-based foods in the region. The growth of this region is attributed to factors such as rapid urbanization.

Vendor Insights 

The hemp-based foods market is fragmented, and the vendors are deploying organic and inorganic growth strategies to compete in the market. The report analyzes the market's competitive landscape and offers information on several market vendors, including:

  • Aurora Cannabis Inc.
  • Bombay Hemp Co. Pvt. Ltd.
  • Boring Hemp Co.
  • CANAH INTERNATIONAL Srl
  • Cann Global Ltd.
  • Canopy Growth Corp.
  • GFR Ingredients Ltd.
  • Hemp Juice Company BV
  • HempFlax Group BV
  • Hudson River Foods
  • Isodiol International Inc.
  • Liaoning Qiaopai Biotech Co. Ltd.
  • Naturally Hemps LLC
  • Navitas LLC
  • North American Hemp and Grain Co.
  • Nutiva Inc.
  • Parkland Industrial Hemp Growers Co op. Ltd.
  • The Hemp Corp. Pty Ltd.
  • Tilray Inc.
  • Yunnan Hua Fang Industrial Hemp Co. Ltd.

View our FREE PDF Sample Report to find additional highlights on the growth strategies adopted by vendors and their product offerings

 Key Market Drivers and Challenges

The growing vegan population and cases of celiac disease are driving the hemp-based foods market growth. Hemp seeds are good sources of protein. Several manufacturers are adding vegan labels on the packaging of hemp products to cater to the vegan consumer base. The prevalence of the celiac disease is rising across the world. Gluten-free food products such as hemp can help avoid this disease. Hence, the demand for hemp-based food ingredients is growing significantly.

The impact of natural disasters and adverse weather conditions is challenging the hemp-based foods market growth. Uncertain weather conditions can negatively impact the production of crops. Natural disasters such as earthquakes, floods, and droughts can also affect hemp plantations. These factors are challenging the growth of the market during the forecast period.

Technavio has identified key trends, drivers, and challenges in the market, which will help vendors improve their strategies to stay ahead of their competitors. View our FREE PDF Sample Report

Customize Your Report 

Don't miss out on the opportunity to speak to our analyst and find more insights about this market report. Technavio can also help you customize this report according to your needs. Our analysts and industry experts will work directly with you to understand your requirements and provide you with customized data in a short amount of time. 

Related Reports

CBD Oil Market by Product and Geography - Forecast and Analysis 2022-2026: The CBD oil market share is expected to increase by USD 3.97 billion from 2020 to 2025.

Protein Ingredients Market by Source and Geography - Forecast and Analysis 2022-2026: The protein ingredients market share is expected to increase by USD 25.76 billion from 2021 to 2026.

Hemp-based Foods Market Scope

Report Coverage

Details

Page number

120

Base year

2021

Forecast period

2022-2026

Growth momentum & CAGR

Accelerate at a CAGR of 11.55%

Market growth 2022-2026

USD 3.54 billion

Market structure

Fragmented

YoY growth (%)

10.6

Regional analysis

North America, Europe, APAC, South America, and Middle East and Africa

Performing market contribution

APAC at 34%

Key consumer countries

US, Canada, China, Australia, Germany, and France

Competitive landscape

Leading companies, competitive strategies, consumer engagement scope

Key companies profiled

Aurora Cannabis Inc., Bombay Hemp Co. Pvt. Ltd., Boring Hemp Co., CANAH INTERNATIONAL Srl, Cann Global Ltd., Canopy Growth Corp., GFR Ingredients Ltd., Hemp Juice Company BV, HempFlax Group BV, Hudson River Foods, Isodiol International Inc., Liaoning Qiaopai Biotech Co. Ltd., Naturally Hemps LLC, Navitas LLC, North American Hemp and Grain Co., Nutiva Inc., Parkland Industrial Hemp Growers Co op. Ltd., The Hemp Corp. Pty Ltd., Tilray Inc., and Yunnan Hua Fang Industrial Hemp Co. Ltd.

Market dynamics

Parent market analysis, market growth inducers and obstacles, fast-growing and slow-growing segment analysis, COVID-19 impact and recovery analysis and future consumer dynamics, and market condition analysis for the forecast period.

Customization purview

If our report has not included the data that you are looking for, you can reach out to our analysts and get segments customized.

Browse Consumer Staples Market Reports

Table of Contents

1 Executive Summary

  • 1.1 Market overview 
    • Exhibit 01: Executive Summary – Chart on Market Overview
    • Exhibit 02: Executive Summary – Data Table on Market Overview
    • Exhibit 03: Executive Summary – Chart on Global Market Characteristics
    • Exhibit 04: Executive Summary – Chart on Market by Geography
    • Exhibit 05: Executive Summary – Chart on Market Segmentation by Product
    • Exhibit 06: Executive Summary – Chart on Incremental Growth
    • Exhibit 07: Executive Summary – Data Table on Incremental Growth
    • Exhibit 08: Executive Summary – Chart on Vendor Market Positioning

2 Market Landscape

  • 2.1 Market ecosystem 
    • Exhibit 09: Parent market
    • Exhibit 10: Market Characteristics

3 Market Sizing

  • 3.1 Market definition 
    • Exhibit 11: Offerings of vendors included in the market definition
  • 3.2 Market segment analysis 
    • Exhibit 12: Market segments
  • 3.3 Market size 2021
  • 3.4 Market outlook: Forecast for 2021-2026 
    • Exhibit 13: Chart on Global - Market size and forecast 2021-2026 ($ million)
    • Exhibit 14: Data Table on Global - Market size and forecast 2021-2026 ($ million)
    • Exhibit 15: Chart on Global Market: Year-over-year growth 2021-2026 (%)
    • Exhibit 16: Data Table on Global Market: Year-over-year growth 2021-2026 (%)

4 Five Forces Analysis

  • 4.1 Five forces summary 
    • Exhibit 17: Five forces analysis - Comparison between 2021 and 2026
  • 4.2 Bargaining power of buyers 
    • Exhibit 18: Chart on Bargaining power of buyers – Impact of key factors 2021 and 2026
  • 4.3 Bargaining power of suppliers 
    • Exhibit 19: Bargaining power of suppliers – Impact of key factors in 2021 and 2026
  • 4.4 Threat of new entrants 
    • Exhibit 20: Threat of new entrants – Impact of key factors in 2021 and 2026
  • 4.5 Threat of substitutes 
    • Exhibit 21: Threat of substitutes – Impact of key factors in 2021 and 2026
  • 4.6 Threat of rivalry 
    • Exhibit 22: Threat of rivalry – Impact of key factors in 2021 and 2026
  • 4.7 Market condition 
    • Exhibit 23: Chart on Market condition - Five forces 2021 and 2026

5 Market Segmentation by Product

  • 5.1 Market segments 
    • Exhibit 24: Chart on Product - Market share 2021-2026 (%)
    • Exhibit 25: Data Table on Product - Market share 2021-2026 (%)
  • 5.2 Comparison by Product 
    • Exhibit 26: Chart on Comparison by Product
    • Exhibit 27: Data Table on Comparison by Product
  • 5.3 Hemp seed-based foods - Market size and forecast 2021-2026 
    • Exhibit 28: Chart on Hemp seed-based foods - Market size and forecast 2021-2026 ($ million)
    • Exhibit 29: Data Table on Hemp seed-based foods - Market size and forecast 2021-2026 ($ million)
    • Exhibit 30: Chart on Hemp seed-based foods - Year-over-year growth 2021-2026 (%)
    • Exhibit 31: Data Table on Hemp seed-based foods - Year-over-year growth 2021-2026 (%)
  • 5.4 Hemp protein-based foods - Market size and forecast 2021-2026 
    • Exhibit 32: Chart on Hemp protein-based foods - Market size and forecast 2021-2026 ($ million)
    • Exhibit 33: Data Table on Hemp protein-based foods - Market size and forecast 2021-2026 ($ million)
    • Exhibit 34: Chart on Hemp protein-based foods - Year-over-year growth 2021-2026 (%)
    • Exhibit 35: Data Table on Hemp protein-based foods - Year-over-year growth 2021-2026 (%)
  • 5.5 Hemp oil-based foods - Market size and forecast 2021-2026
    • Exhibit 36: Chart on Hemp oil-based foods - Market size and forecast 2021-2026 ($ million)
    • Exhibit 37: Data Table on Hemp oil-based foods - Market size and forecast 2021-2026 ($ million)
    • Exhibit 38: Chart on Hemp oil-based foods - Year-over-year growth 2021-2026 (%)
    • Exhibit 39: Data Table on Hemp oil-based foods - Year-over-year growth 2021-2026 (%)
  • 5.6 Market opportunity by Product 
    • Exhibit 40: Market opportunity by Product ($ million)

6 Customer Landscape

  • 6.1 Customer landscape overview 
    • Exhibit 41: Analysis of price sensitivity, lifecycle, customer purchase basket, adoption rates, and purchase criteria

7 Geographic Landscape

  • 7.1 Geographic segmentation 
    • Exhibit 42: Chart on Market share by geography 2021-2026 (%)
    • Exhibit 43: Data Table on Market share by geography 2021-2026 (%)
  • 7.2 Geographic comparison 
    • Exhibit 44: Chart on Geographic comparison
    • Exhibit 45: Data Table on Geographic comparison
  • 7.3 North America - Market size and forecast 2021-2026
    • Exhibit 46: Chart on North America - Market size and forecast 2021-2026 ($ million)
    • Exhibit 47: Data Table on North America - Market size and forecast 2021-2026 ($ million)
    • Exhibit 48: Chart on North America - Year-over-year growth 2021-2026 (%)
    • Exhibit 49: Data Table on North America - Year-over-year growth 2021-2026 (%)
  • 7.4 Europe - Market size and forecast 2021-2026
    • Exhibit 50: Chart on Europe - Market size and forecast 2021-2026 ($ million)
    • Exhibit 51: Data Table on Europe - Market size and forecast 2021-2026 ($ million)
    • Exhibit 52: Chart on Europe - Year-over-year growth 2021-2026 (%)
    • Exhibit 53: Data Table on Europe - Year-over-year growth 2021-2026 (%)
  • 7.5 APAC - Market size and forecast 2021-2026
    • Exhibit 54: Chart on APAC - Market size and forecast 2021-2026 ($ million)
    • Exhibit 55: Data Table on APAC - Market size and forecast 2021-2026 ($ million)
    • Exhibit 56: Chart on APAC - Year-over-year growth 2021-2026 (%)
    • Exhibit 57: Data Table on APAC - Year-over-year growth 2021-2026 (%)
  • 7.6 South America - Market size and forecast 2021-2026
    • Exhibit 58: Chart on South America - Market size and forecast 2021-2026 ($ million)
    • Exhibit 59: Data Table on South America - Market size and forecast 2021-2026 ($ million)
    • Exhibit 60: Chart on South America - Year-over-year growth 2021-2026 (%)
    • Exhibit 61: Data Table on South America - Year-over-year growth 2021-2026 (%)
  • 7.7 Middle East and Africa - Market size and forecast 2021-2026 
    • Exhibit 62: Chart on Middle East and Africa - Market size and forecast 2021-2026 ($ million)
    • Exhibit 63: Data Table on Middle East and Africa - Market size and forecast 2021-2026 ($ million)
    • Exhibit 64: Chart on Middle East and Africa - Year-over-year growth 2021-2026 (%)
    • Exhibit 65: Data Table on Middle East and Africa - Year-over-year growth 2021-2026 (%)
  • 7.8 US - Market size and forecast 2021-2026
    • Exhibit 66: Chart on US - Market size and forecast 2021-2026 ($ million)
    • Exhibit 67: Data Table on US - Market size and forecast 2021-2026 ($ million)
    • Exhibit 68: Chart on US - Year-over-year growth 2021-2026 (%)
    • Exhibit 69: Data Table on US - Year-over-year growth 2021-2026 (%)
  • 7.9 China - Market size and forecast 2021-2026
    • Exhibit 70: Chart on China - Market size and forecast 2021-2026 ($ million)
    • Exhibit 71: Data Table on China - Market size and forecast 2021-2026 ($ million)
    • Exhibit 72: Chart on China - Year-over-year growth 2021-2026 (%)
    • Exhibit 73: Data Table on China - Year-over-year growth 2021-2026 (%)
  • 7.10 Germany - Market size and forecast 2021-2026
    • Exhibit 74: Chart on Germany - Market size and forecast 2021-2026 ($ million)
    • Exhibit 75: Data Table on Germany - Market size and forecast 2021-2026 ($ million)
    • Exhibit 76: Chart on Germany - Year-over-year growth 2021-2026 (%)
    • Exhibit 77: Data Table on Germany - Year-over-year growth 2021-2026 (%)
  • 7.11 Canada - Market size and forecast 2021-2026
    • Exhibit 78: Chart on Canada - Market size and forecast 2021-2026 ($ million)
    • Exhibit 79: Data Table on Canada - Market size and forecast 2021-2026 ($ million)
    • Exhibit 80: Chart on Canada - Year-over-year growth 2021-2026 (%)
    • Exhibit 81: Data Table on Canada - Year-over-year growth 2021-2026 (%)
  • 7.12 France - Market size and forecast 2021-2026
    • Exhibit 82: Chart on France - Market size and forecast 2021-2026 ($ million)
    • Exhibit 83: Data Table on France - Market size and forecast 2021-2026 ($ million)
    • Exhibit 84: Chart on France - Year-over-year growth 2021-2026 (%)
    • Exhibit 85: Data Table on France - Year-over-year growth 2021-2026 (%)
  • 7.13 Australia - Market size and forecast 2021-2026
    • Exhibit 86: Chart on Australia - Market size and forecast 2021-2026 ($ million)
    • Exhibit 87: Data Table on Australia - Market size and forecast 2021-2026 ($ million)
    • Exhibit 88: Chart on Australia - Year-over-year growth 2021-2026 (%)
    • Exhibit 89: Data Table on Australia - Year-over-year growth 2021-2026 (%)
  • 7.14 Market opportunity by geography 
    • Exhibit 90: Market opportunity by geography ($ million)

8 Drivers, Challenges, and Trends

  • 8.1 Market drivers
  • 8.2 Market challenges
  • 8.3 Impact of drivers and challenges 
    • Exhibit 91: Impact of drivers and challenges in 2021 and 2026
  • 8.4 Market trends

9 Vendor Landscape

  • 9.1 Overview
  • 9.2 Vendor landscape 
    • Exhibit 92: Overview on Criticality of inputs and Factors of differentiation
  • 9.3 Landscape disruption 
    • Exhibit 93: Overview on factors of disruption
  • 9.4 Industry risks 
    • Exhibit 94: Impact of key risks on business

10 Vendor Analysis

  • 10.1 Vendors covered 
    • Exhibit 95: Vendors covered
  • 10.2 Market positioning of vendors 
    • Exhibit 96: Matrix on vendor position and classification
  • 10.3 Aurora Cannabis Inc. 
    • Exhibit 97: Aurora Cannabis Inc. - Overview
    • Exhibit 98: Aurora Cannabis Inc. - Business segments
    • Exhibit 99: Aurora Cannabis Inc. - Key offerings
    • Exhibit 100: Aurora Cannabis Inc. - Segment focus
  • 10.4 Bombay Hemp Co. Pvt. Ltd. 
    • Exhibit 101: Bombay Hemp Co. Pvt. Ltd. - Overview
    • Exhibit 102: Bombay Hemp Co. Pvt. Ltd. - Product / Service
    • Exhibit 103: Bombay Hemp Co. Pvt. Ltd. - Key offerings
  • 10.5 Boring Hemp Co. 
    • Exhibit 104: Boring Hemp Co. - Overview
    • Exhibit 105: Boring Hemp Co. - Product / Service
    • Exhibit 106: Boring Hemp Co. - Key offerings
  • 10.6 CANAH INTERNATIONAL Srl 
    • Exhibit 107: CANAH INTERNATIONAL Srl - Overview
    • Exhibit 108: CANAH INTERNATIONAL Srl - Product / Service
    • Exhibit 109: CANAH INTERNATIONAL Srl - Key offerings
  • 10.7 Canopy Growth Corp. 
    • Exhibit 110: Canopy Growth Corp. - Overview
    • Exhibit 111: Canopy Growth Corp. - Business segments
    • Exhibit 112: Canopy Growth Corp. - Key news
    • Exhibit 113: Canopy Growth Corp. - Key offerings
    • Exhibit 114: Canopy Growth Corp. - Segment focus
  • 10.8 Hemp Juice Company BV 
    • Exhibit 115: Hemp Juice Company BV - Overview
    • Exhibit 116: Hemp Juice Company BV - Product / Service
    • Exhibit 117: Hemp Juice Company BV - Key offerings
  • 10.9 HempFlax Group BV 
    • Exhibit 118: HempFlax Group BV - Overview
    • Exhibit 119: HempFlax Group BV - Product / Service
    • Exhibit 120: HempFlax Group BV - Key offerings
  • 10.10 Hudson River Foods 
    • Exhibit 121: Hudson River Foods - Overview
    • Exhibit 122: Hudson River Foods - Product / Service
    • Exhibit 123: Hudson River Foods - Key offerings
  • 10.11 North American Hemp and Grain Co. 
    • Exhibit 124: North American Hemp and Grain Co. - Overview
    • Exhibit 125: North American Hemp and Grain Co. - Product / Service
    • Exhibit 126: North American Hemp and Grain Co. - Key offerings
  • 10.12 Nutiva Inc. 
    • Exhibit 127: Nutiva Inc. - Overview
    • Exhibit 128: Nutiva Inc. - Product / Service
    • Exhibit 129: Nutiva Inc. - Key offerings

11 Appendix

  • 11.1 Scope of the report
  • 11.2 Inclusions and exclusions checklist 
    • Exhibit 130: Inclusions checklist
    • Exhibit 131: Exclusions checklist
  • 11.3 Currency conversion rates for US$ 
    • Exhibit 132: Currency conversion rates for US$
  • 11.4 Research methodology 
    • Exhibit 133: Research methodology
    • Exhibit 134: Validation techniques employed for market sizing
    • Exhibit 135: Information sources
  • 11.5 List of abbreviations 
    • Exhibit 136: List of abbreviations
About Us

Technavio is a leading global technology research and advisory company. Their research and analysis focus on emerging market trends and provide actionable insights to help businesses identify market opportunities and develop effective strategies to optimize their market positions. With over 500 specialized analysts, Technavio's report library consists of more than 17,000 reports and counting, covering 800 technologies, spanning across 50 countries. Their client base consists of enterprises of all sizes, including more than 100 Fortune 500 companies. This growing client base relies on Technavio's comprehensive coverage, extensive research, and actionable market insights to identify opportunities in existing and potential markets and assess their competitive positions within changing market scenarios. 

Contact 
Technavio Research 
Jesse Maida 
Media & Marketing Executive 
US: +1 844 364 1100 
UK: +44 203 893 3200 
Email: media@technavio.com 
Website: www.technavio.com/ 

View original content to download multimedia:https://www.prnewswire.com/news-releases/hemp-based-foods-market-size-to-grow-by-usd-3-54-bn-hemp-seed-based-foods-to-be-key-revenue-generating-product-segment---technavio-301636513.html

SOURCE Technavio

Read More

Continue Reading

International

IVI starts technology transfer to Biological E. Limited to manufacture oral cholera vaccine for India and global markets

  Credit: IVI IVI will complete the technology transfer by 2025 Oral Cholera Vaccine to be manufactured by Biological E. Limited for India and international…

Published

on


Credit: IVI

  • IVI will complete the technology transfer by 2025
  • Oral Cholera Vaccine to be manufactured by Biological E. Limited for India and international markets


March 20, 2024, SEOUL, Republic of Korea and HYDERABAD, India — The International Vaccine Institute (IVI), an international organization with a mission to discover, develop, and deliver safe, effective, and affordable vaccines for global health, today announced that it has commenced a technology transfer of simplified Oral Cholera Vaccine (OCV-S) to Biological E. Limited (BE), a leading India-based Vaccines and Pharmaceutical Company.


Following the signing of a technology license agreement in November last year, IVI has begun providing the technical information, know-how, and materials to produce OCV-S at BE facilities and will continue to support necessary clinical development and regulatory approvals. IVI and BE entered this partnership during an unprecedented surge of cholera outbreaks worldwide and aim to increase the volume of low-cost cholera vaccine in India as well as the global public market.


IVI will complete the technology transfer by 2025 and the oral cholera vaccine will be manufactured for India and international markets by Biological E. Limited.


Dr. Jerome Kim, Director General of IVI, said: “In an era of heightened risk of poverty-associated infectious diseases such as cholera, the world needs a sustainable source of high-quality, affordable vaccines and committed manufacturers to supply them. We are pleased to partner with Biological E., a company with a proven history of making life-saving vaccines accessible globally, to address this supply gap and protect communities from this deadly, though preventable, disease.”


Ms. Mahima Datla, Managing Director, Biological E. Limited, said: “We are glad to be in collaboration with IVI for the manufacture of simplified Oral Cholera Vaccine. Our efforts are aimed to not only combat the disease but to also be part of a sustained legacy of innovation, collaboration, and health stewardship. Together with IVI, we are happy to be shaping a healthier and more resilient future by making this vaccine accessible globally.”


This technology transfer and licensing agreement is the sixth of its kind for IVI, transferring such technology to manufacturers in India, the Republic of Korea, Bangladesh, and South Africa. All these partnerships have led to or seek to achieve, pre-qualification (PQ) from the World Health Organization, a designation that enables global agencies such as UNICEF to procure the vaccine for the global market. BE already has 9 vaccines with WHO PQ in its portfolio, and IVI and BE will pursue WHO PQ for OCV-S as well, following national licensure in India.


Dr. Julia Lynch, Director of IVI’s Cholera Program, said: “The cholera situation is dire, and the availability and use of oral cholera vaccine is an essential part of a multifaceted approach to cholera control and prevention, especially as outbreaks increase and the global vaccine supply remains strained. With more manufacturers like BE entering the market, the future supply situation looks strong. IVI remains committed to ensuring the availability of the oral cholera vaccine and to developing new and improved vaccines that are equally safe, effective, and affordable and made around the world, for the world.”


OCV-S is a simplified formulation of OCV with the potential to lower production costs while increasing production capacity for current and aspiring OCV manufacturers. IVI’s development of OCV-S and ongoing technology transfers are part of an institutional strategy to confront cholera with 3 main goals: 1) Ensure supply of OCV 2) Improve cholera vaccines 3) Support OCV use and introduction. The Bill & Melinda Gates Foundation has been supporting IVI’s cholera program since 2000 and is funding this latest technology transfer to BE.


###


About the International Vaccine Institute (IVI)

The International Vaccine Institute (IVI) is a non-profit international organization established in 1997 at the initiative of the United Nations Development Programme with a mission to discover, develop, and deliver safe, effective, and affordable vaccines for global health.

IVI’s current portfolio includes vaccines at all stages of pre-clinical and clinical development for infectious diseases that disproportionately affect low- and middle-income countries, such as cholera, typhoid, chikungunya, shigella, salmonella, schistosomiasis, hepatitis E, HPV, COVID-19, and more. IVI developed the world’s first low-cost oral cholera vaccine, pre-qualified by the World Health Organization (WHO), and developed a new-generation typhoid conjugate vaccine that also achieved WHO prequalification in early 2024.

IVI is headquartered in Seoul, Republic of Korea with a Europe Regional Office in Sweden, an Africa Regional Office in Rwanda, a Country Office in Austria, and a Country and Project Office in Kenya. IVI additionally co-founded the Hong Kong Jockey Club Global Health Institute in Hong Kong and hosts Collaborating Centers in Ghana, Ethiopia, and Madagascar. 39 countries and the WHO are members of IVI, and the governments of the Republic of Korea, Sweden, India, Finland, and Thailand provide state funding. For more information, please visit https://www.ivi.int.


About Biological E. Limited

Biological E. Limited (BE), a Hyderabad-based Pharmaceuticals & Biologics Company founded in 1953, is the first private sector biological products company in India and the first pharmaceutical company in Southern India. BE develops, manufactures and supplies vaccines and therapeutics. BE supplies its vaccines to more than 130 countries and its therapeutic products are sold in India, the USA and Europe. BE currently has 8 WHO-prequalified vaccines and 10 USFDA approved Generic Injectables in its portfolio. Recently, BE has received Emergency Use Listing (EUL) from the WHO for CORBEVAX®, the COVID-19 vaccine. Recently, DCGI has approved BE’S 14-Valent Pneumococcal Conjugate vaccine.

In recent years, BE has embarked on new initiatives for organizational expansion such as developing specialty injectable products for global markets as a means to manufacture APIs sustainably and developing novel vaccines for the global market.

Please follow us on Facebook, LinkedIn and Twitter


MEDIA CONTACTS

IVI

Aerie Em, Global Communications & Advocacy Manager
+82 2 881 1386 | aerie.em@ivi.int


Biological E. Limited

K. Vijay Amruth Raj
Email: Vijay.Kammari@biologicale.com
www.biologicale.com/news


Read More

Continue Reading

Uncategorized

Apartment permits are back to recession lows. Will mortgage rates follow?

If housing leads us into a recession in the near future, that means mortgage rates have stayed too high for too long.

Published

on

In Tuesday’s report, the 5-unit housing permits data hit the same levels we saw in the COVID-19 recession. Once the backlog of apartments is finished, those jobs will be at risk, which traditionally means mortgage rates would fall soon after, as they have in previous economic cycles.

However, this is happening while single-family permits are still rising as the rate of builder buy-downs and the backlog of single-family homes push single-family permits and starts higher. It is a tale of two markets — something I brought up on CNBC earlier this year to explain why this trend matters with housing starts data because the two marketplaces are heading in opposite directions.

The question is: Will the uptick in single-family permits keep mortgage rates higher than usual? As long as jobless claims stay low, the falling 5-unit apartment permit data might not lead to lower mortgage rates as it has in previous cycles.

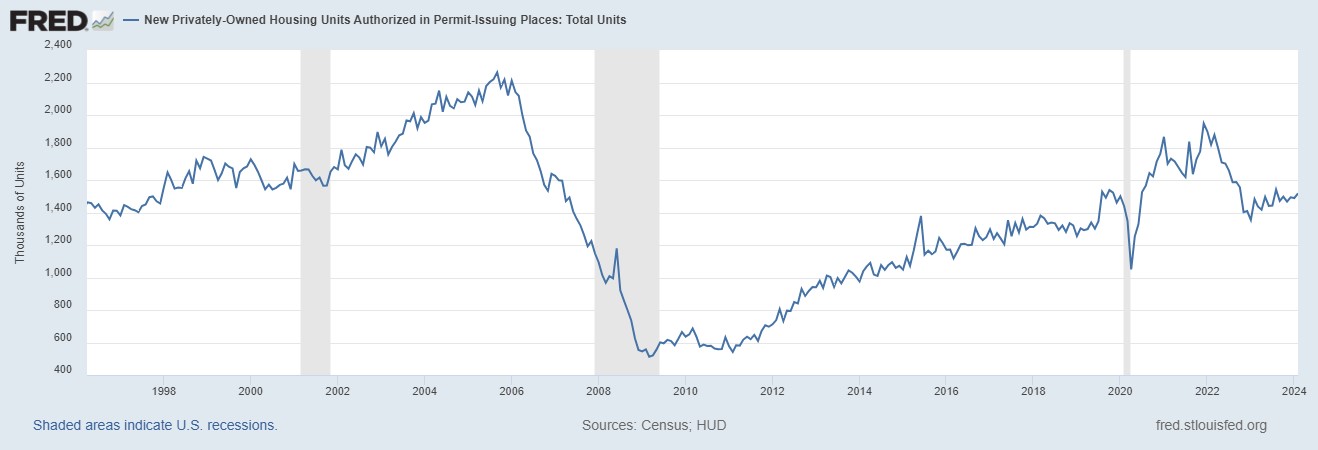
From Census: Building Permits: Privately‐owned housing units authorized by building permits in February were at a seasonally adjusted annual rate of 1,518,000. This is 1.9 percent above the revised January rate of 1,489,000 and 2.4 percent above the February 2023 rate of 1,482,000.

When people say housing leads us in and out of a recession, it is a valid premise and that is why people carefully track housing permits. However, this housing cycle has been unique. Unfortunately, many people who have tracked this housing cycle are still stuck on 2008, believing that what happened during COVID-19 was rampant demand speculation that would lead to a massive supply of homes once home sales crashed. This would mean the builders couldn’t sell more new homes or have housing permits rise.

Housing permits, starts and new home sales were falling for a while, and in 2022, the data looked recessionary. However, new home sales were never near the 2005 peak, and the builders found a workable bottom in sales by paying down mortgage rates to boost demand. The first level of job loss recessionary data has been averted for now. Below is the chart of the building permits.


On the other hand, the apartment boom and bust has already happened. Permits are already back to the levels of the COVID-19 recession and have legs to move lower. Traditionally, when this data line gets this negative, a recession isn’t far off. But, as you can see in the chart below, there’s a big gap between the housing permit data for single-family and five units. Looking at this chart, the recession would only happen after single-family and 5-unit permits fall together, not when we have a gap like we see today.

From Census: Housing completions: Privately‐owned housing completions in February were at a seasonally adjusted annual rate of 1,729,000.

As we can see in the chart below, we had a solid month of housing completions. This was driven by 5-unit completions, which have been in the works for a while now. Also, this month’s report show a weather impact as progress in building was held up due to bad weather. However, the good news is that more supply of rental units will mean the fight against rent inflation will be positive as more supply is the best way to deal with inflation. In time, that is also good news for mortgage rates.


Housing Starts: Privately‐owned housing starts in February were at a seasonally adjusted annual rate of 1,521,000. This is 10.7 percent (±14.2 percent)* above the revised January estimate of 1,374,000 and is 5.9 percent (±10.0 percent)* above the February 2023 rate of 1,436,000.

Housing starts data beat to the upside, but the real story is that the marketplace has diverged into two different directions. The apartment boom is over and permits are heading below the COVID-19 recession, but as long as the builders can keep rates low enough to sell more new homes, single-family permits and starts can slowly move forward.

If we lose the single-family marketplace, expect the chart below to look like it always does before a recession — meaning residential construction workers lose their jobs. For now, the apartment construction workers are at the most risk once they finish the backlog of apartments under construction.

Overall, the housing starts beat to the upside. Still, the report’s internals show a marketplace with early recessionary data lines, which traditionally mean mortgage rates should go lower soon. If housing leads us into a recession in the near future, that means mortgage rates have stayed too high for too long and restrictive policy by the Fed created a recession as we have seen in previous economic cycles.

The builders have been paying down rates to keep construction workers employed, but if rates go higher, it will get more and more challenging to do this because not all builders have the capacity to buy down rates. Last year, we saw what 8% mortgage rates did to new home sales; they dropped before rates fell. So, this is something to keep track of, especially with a critical Federal Reserve meeting this week.

Read More

Continue Reading

Government

Young People Aren’t Nearly Angry Enough About Government Debt

Young People Aren’t Nearly Angry Enough About Government Debt

Authored by The American Institute for Economic Research,

Young people sometimes…

Published

on

Young People Aren't Nearly Angry Enough About Government Debt

Authored by The American Institute for Economic Research,

Young people sometimes seem to wake up in the morning in search of something to be outraged about. We are among the wealthiest and most educated humans in history. But we’re increasingly convinced that we’re worse off than our parents were, that the planet is in crisis, and that it’s probably not worth having kids.

I’ll generalize here about my own cohort (people born after 1981 but before 2010), commonly referred to as Millennials and Gen Z, as that shorthand corresponds to survey and demographic data. Millennials and Gen Z have valid economic complaints, and the conditions of our young adulthood perceptibly weakened traditional bridges to economic independence. We graduated with record amounts of student debt after President Obama nationalized that lending. Housing prices doubled during our household formation years due to zoning impediments and chronic underbuilding. Young Americans say economic issues are important to us, and candidates are courting our votes by promising student debt relief and cheaper housing (which they will never be able to deliver).

Young people, in our idealism and our rational ignorance of the actual appropriations process, typically support more government intervention, more spending programs, and more of every other burden that has landed us in such untenable economic circumstances to begin with. Perhaps not coincidentally, young people who’ve spent the most years in the increasingly partisan bubble of higher education are also the most likely to favor expanded government programs as a “solution” to those complaints.

It’s Your Debt, Boomer 

What most young people don’t yet understand is that we are sacrificing our young adulthood and our financial security to pay for debts run up by Baby Boomers. Part of every Millennial and Gen-Z paycheck is payable to people the same age as the members of Congress currently milking this system and miring us further in debt.

Our government spends more than it can extract from taxpayers. Social Security, which represents 20 percent of government spending, has run an annual deficit for 15 years. Last year Social Security alone overspent by $22.1 billion. To keep sending out checks to retirees, Social Security goes begging to the Treasury Department, and the Treasury borrows from the public by issuing bonds. Bonds allow investors (who are often also taxpayers) to pay for some retirees’ benefits now, and be paid back later. But investors only volunteer to lend Social Security the money it needs to cover its bills because the (younger) taxpayers will eventually repay the debt — with interest.

In other words, both Social Security and Medicare, along with various smaller federal entitlement programs, together comprising almost half of the federal budget, have been operating for a decade on the principle of “give us the money now, and stick the next generation with the check.” We saddle future generations with debt for present-day consumption.

The second largest item in the budget after Social Security is interest on the national debt — largely on Social Security and other entitlements that have already been spent. These mandatory benefits now consume three quarters of the federal budget: even Congress is not answerable for these programs. We never had the chance for our votes to impact that spending (not that older generations were much better represented) and it’s unclear if we ever will.

Young Americans probably don’t think much about the budget deficit (each year’s overspending) or the national debt (many years’ deficits put together, plus interest) much at all. And why should we? For our entire political memory, the federal government, as well as most of our state governments, have been steadily piling “public” debt upon our individual and collective heads. That’s just how it is. We are the frogs trying to make our way in the watery world as the temperature ticks imperceptibly higher. We have been swimming in debt forever, unaware that we’re being economically boiled alive.

Millennials have somewhat modest non-mortgage debt of around $27,000 (some self-reports say twice that much), including car notes, student loans, and credit cards. But we each owe more than $100,000 as a share of the national debt. And we don’t even know it.

When Millennials finally do have babies (and we are!) that infant born in 2024 will enter the world with a newly minted Social Security Number and $78,089 credit card bill for Granddad’s heart surgery and the interest on a benefit check that was mailed when her parents were in middle school. 

Headlines and comments sections love to sneer at “snowflakes” who’ve just hit the “real world,” and can’t figure out how to make ends meet, but the kids are onto something. A full 15 percent of our earnings are confiscated to pay into retirement and healthcare programs that will be insolvent by the time we’re old enough to enjoy them. The Federal Reserve and government debt are eating the economy. The same interest rates that are pushing mortgages out of reach are driving up the cost of interest to maintain the debt going forward. As we learn to save and invest, our dollars are slowly devalued. We’re right to feel trapped.  

Sure, if we’re alive and own a smartphone, we’re among the one percent of the wealthiest humans who’ve ever lived. Older generations could argue (persuasively!) that we have no idea what “poverty” is anymore. But with the state of government spending and debt…we are likely to find out. 

Despite being richer than Rockefeller, Millennials are right to say that the previous ways of building income security have been pushed out of reach. Our earning years are subsidizing not our own economic coming-of-age, but bank bailouts, wars abroad, and retirement and medical benefits for people who navigated a less-challenging wealth-building landscape. 

Redistribution goes both ways. Boomers are expected to pass on tens of trillions in unprecedented wealth to their children (if it isn’t eaten up by medical costs, despite heavy federal subsidies) and older generations’ financial support of the younger has had palpable lifting effects. Half of college costs are paid by families, and the trope of young people moving back home is only possible if mom and dad have the spare room and groceries to make that feasible.

Government “help” during COVID-19 resulted in the worst inflation in 40 years, as the federal government spent $42,000 per citizen on “stimulus” efforts, right around a Millennial’s average salary at that time. An absurd amount of fraud was perpetrated in the stimulus to save an economy from the lockdown that nearly ruined itTrillions in earmarked goodies were rubber stamped, carelessly added to young people’s growing bill. Government lenders deliberately removed fraud controls, fearing they couldn’t hand out $800 billion in young people’s future wages away fast enough. Important lessons were taught by those programs. The importance of self-sufficiency and the dignity of hard work weren’t top of the list.

Boomer Benefits are Stagnating Hiring, Wages, and Investment for Young People

Even if our workplace engagement suffered under government distortions, Millennials continue to work more hours than other generations and invest in side hustles and self employment at higher rates. Working hard and winning higher wages almost doesn’t matter, though, when our purchasing power is eaten from the other side. Buying power has dropped 20 percent in just five years. Life is $11,400/year more expensive than it was two years ago and deficit spending is the reason why

We’re having trouble getting hired for what we’re worth, because it costs employers 30 percent more than just our wages to employ us. The federal tax code both requires and incentivizes our employers to transfer a bunch of what we earned directly to insurance companies and those same Boomer-busted federal benefits, via tax-deductible benefits and payroll taxes. And the regulatory compliance costs of ravenous bureaucratic state. The price paid by each employer to keep each employee continues to rise — but Congress says your boss has to give most of the increase to someone other than you. 

Federal spending programs that many people consider good government, including Social Security, Medicare, Medicaid, and health insurance for children (CHIP) aren’t a small amount of the federal budget. Government spends on these programs because people support and demand them, and because cutting those benefits would be a re-election death sentence. That’s why they call cutting Social Security the “third rail of politics.” If you touch those benefits, you die. Congress is held hostage by Baby Boomers who are running up the bill with no sign of slowing down. 

Young people generally support Social Security and the public health insurance programs, even though a 2021 poll by Nationwide Financial found 47 percent of Millennials agree with the statement “I will not get a dime of the Social Security benefits I have earned.”

In the same survey, Millennials were the most likely of any generation to believe that Social Security benefits should be enough to live on as a sole income, and guessed the retirement age was 52 (it’s 67 for anyone born after 1959 — and that’s likely to rise). Young people are the most likely to see government guarantees as a valid way to live — even though we seem to understand that those promises aren’t guarantees at all.

Healthcare costs tied to an aging population and wonderful-but-expensive growth in medical technologies and medications will balloon over the next few years, and so will the deficits in Boomer benefit programs. Newly developed obesity drugs alone are expected to add $13.6 billion to Medicare spending. By 2030, every single Baby Boomer will be 65, eligible for publicly funded healthcare.

The first Millennial will be eligible to claim Medicare (assuming the program exists and the qualifying age is still 65, both of which are improbable) in 2046. As it happens, that’s also the year that the Boomer benefits programs (which will then be bloated with Gen Xers) and the interest payments we’re incurring to provide those benefits now, are projected to consume 100 percent of federal tax revenue.

Government spending is being transferred to bureaucrats and then to the beneficiaries of government spending who are, in some sense, your diabetic grandma who needs a Medicare-paid dialysis treatment, but in a much more immediate sense, are the insurance companiespharma giants, and hospital corporations who wrote the healthcare legislation. Some percentage of every college graduate’s paycheck buys bullets that get fired at nothing and inflating the private investment portfolios of government contractors, with dubious, wasteful outcomes from the prison-industrial complex to the perpetual war machine.

No bank or nation in the world can lend the kind of money the American government needs to borrow to fulfill its obligations to citizens. Someone will have to bite the bullet. Even some of the co-authors of the current disaster are wrestling with the truth. 

Forget avocado toast and streaming subscriptions. We’re already sensing it, but we haven’t yet seen it. Young people are not well-informed, and often actively misled, about what’s rotten in this economic system. But we are seeing the consequences on store shelves and mortgage contracts and we can sense disaster is coming. We’re about to get stuck with the bill.

Tyler Durden Tue, 03/19/2024 - 20:20

Read More

Continue Reading

Trending