The report presents the analysis of Branded Hotels Market for the historical period of 2018-2021 and the forecast period of 2023-2028.
Global Branded Hotels market is projected to display notable growth represented by a CAGR of 8.6% during 2023-2028. The global Branded Hotels market was valued at USD 197.61 Billion in the year 2021 with the Americas region leading the regional market share.
The Global Branded Hotels Market is driven by an increasing Tourism and Hospitality sector across the world. Additionally, the increasing Gross National income among the growing population in several developing countries is anticipated to propel the growth of the Global Branded Hotels market.
In the Price segment, the premium branded hotels are expected to grow with a significant CAGR and also it is anticipated to hold a major share in the overall branded hotels market as business and corporate travel are increasing and boosting the market.
The COVID- 19 pandemic had a huge impact on the Global Branded Hotels Market By affecting the revenue of branded hotel chains dramatically which led to hindrances in the sales of branded hotel rooms worldwide. During the pandemic period, the Tourism sector and Hospitality sector was completely shut down which made a huge impact directly on the branded hotels market.
By Capacity Segment, the large-sized branded hotels hold the largest share in the market as the globally established companies are acquiring the small players around the world to increase their market share and revenue and expanding their respective properties across the world in countries like the USA, China, Russia and in GCC.
Scope of the Report
The Factbook analyses the Branded Hotels Market for 24 countries including the United States, Canada, Mexico, Brazil, Germany, U.K, France, Spain, Italy, Russia, Turkey, China, India, Japan, South Korea, Australia, Thailand, Malaysia, Indonesia, Israel, GCC, North Africa and South Africa.
The report analyses the Branded Hotels Market by Volume (Million Units) and Value (USD Billion).
The report analyses the Branded Hotels Market by Price Type (Luxury, Premium/Upscale, Midscale, Economy).
The report analyses the Branded Hotels Market by Capacity Type (Mega, Large, Medium, Small).
The Global Branded Hotels Market has been analysed By Region (Americas, Europe, Asia Pacific, MEA).
The key insights of the report have been presented through the leading company shares. Also, the attractiveness of the market has been presented by region, Price, and Capacity.
Also, the major opportunities, trends, drivers, opportunities and challenges of the industry have been analysed in the report.
The report tracks competitive developments, strategies, and recent developments.
The companies analysed in the report include:
Accor
Marriott International
Hilton Worldwide
Hyatt Hotels Corporation
IHCL
Huazhu Group
Choice Hotels International
IHG Hotels and Resorts
Minor International
Radisson
Key Topics Covered:
1. Introduction 1.1 Branded Hotels Overview 1.2 Scope of Research
5. Value Chain Analysis 5.1 Raw material Suppliers 5.2 Manufacturers 5.3 Distributors 5.4 End Use Industry
6. Covid-19 Impact Assessment 6.1 Assessment of Degree of Impact of Covid-19 on Branded Hotels Market 6.2 Region-Wise Quarterly Covid Impact Analysis
7. Porter Five Force Analysis
8. Macro-Economic Indicator Outlook 8.1 Global, Region wise GDP Growth 8.2 Population Growth 8.3 Gross National Income, PPP 8.4 Tourism 8.5 Global Construction Spending
9. Average Selling Price Analysis 9.1 Average Selling Price, By Region 9.2 Average Selling Price, By Price Type
11. Volumetric Analysis, Million Units, 2018-2028 11.1 Global Branded Hotels Market, 2018-2028 (Million Units), CAGR (%) 11.1.1 Global Luxury Branded Hotels Market, 2018-2028 (Million Units), CAGR (%) 11.1.2 Global Premium/Upscale Branded Hotels Market, 2018-2028 (Million Units), CAGR (%) 11.1.3 Global Midscale Branded Hotels Market, 2018-2028 (Million Units), CAGR (%) 11.1.4 Global Economy Branded Hotels, 2018-2028 (Million Units), CAGR (%)
12. Global Branded Hotels Market Trends and Forecast Analysis, 2018-2028, USD Billion & CAGR 12.1 Macro Economic Factor Impact Index 12.2 Global Branded Hotels Market: Dashboard 12.3 Global Branded Hotels Market Size, By Value, 2018-2021(USD Billion) 12.4 Global Branded Hotels Market Size, By Value, 2022-2028 (USD Billion) 12.5 Global Branded Hotels Market: Summary
13. Global Branded Hotels Market Trend And Forecast Analysis, 2018-2028, By Price Type 13.1 Global Branded Hotels Market Trend And Forecast Analysis, By Price Type: Snapshot 13.2 Luxury 13.3 Premium/Upscale 13.4 Midscale 13.5 Economy
14. Global Branded Hotels Market Trend And Forecast Analysis, 2018-2028, By Capacity Type 14.1 Global Branded Hotels Market Trend And Forecast Analysis, By Capacity Type: Snapshot 14.2 Mega 14.2 Large 14.2 Medium 14.2 Small
15. Global Branded Hotels Market Trend And Forecast Analysis, 2018-2028, By Region
About ResearchAndMarkets.com ResearchAndMarkets.com is the world's leading source for international market research reports and market data. We provide you with the latest data on international and regional markets, key industries, the top companies, new products and the latest trends.
ARPA-H appoints Etta Pisano to lead its Advancing Clinical Trials Readiness Initiative
The Advanced Research Projects Agency for Health (ARPA-H) has appointed Etta D. Pisano, MD, FACR, senior portfolio lead, to build the agency’s clinical…
The Advanced Research Projects Agency for Health (ARPA-H) has appointed Etta D. Pisano, MD, FACR, senior portfolio lead, to build the agency’s clinical trial portfolio and lead the ARPA-H Advancing Clinical Trials Readiness Initiative under ARPA-H Resilient Systems Mission Office Director Jennifer Roberts.
Credit: N/A
The Advanced Research Projects Agency for Health (ARPA-H) has appointed Etta D. Pisano, MD, FACR, senior portfolio lead, to build the agency’s clinical trial portfolio and lead the ARPA-H Advancing Clinical Trials Readiness Initiative under ARPA-H Resilient Systems Mission Office Director Jennifer Roberts.
The first radiologist to be appointed to such a role, Dr. Pisano is an internationally recognized expert in women’s health, breast cancer research, and the use of artificial intelligence in medical imaging applications.
“I am honored to be working for ARPA-H to identify and promote research that can improve healthcare quality, efficacy and delivery, and to improve patient care and access to clinical trials for all Americans, including women, rural residents, and the underserved,” said Dr. Pisano.
Dr. Pisano will continue to serve as study chair of the large-scale Tomosynthesis Mammographic Imaging Screening Trial (TMIST) for the ECOG-ACRIN Cancer Research Group (ECOG-ACRIN). TMIST is led by ECOG-ACRIN with funding from the National Cancer Institute, part of the National Institutes of Health. She will also continue to serve as the American College of Radiology® (ACR®) Chief Research Officer (CRO). Dr. Pisano previously served as the principal investigator of the landmark Digital Mammographic Imaging Screening Trial (DMIST).
The TMIST breast cancer screening study is among the fastest growing National Cancer Institute (NCI) trials of the COVID-19 era. Under Dr. Pisano’s leadership, TMIST is assembling one of the most diverse cancer screening trial populations ever. Approximately 21% of TMIST U.S. participants are Black—more than double the average rate for Black participation in NCI-funded clinical trials (9%).
With ARPA-H, Dr. Pisano will work to build underserved and minority participation in clinical trials—including identifying and onboarding rural facilities and those outside of large academic medical centers—such as emerging retail healthcare sites.
These duties are also very consistent with the missions of ECOG-ACRIN and ACR, which include promoting the exploration and identification of next-generation technologies that can benefit patients and providers.
“This is a great opportunity for Etta, and I’m excited about the impact she will make on our approach to clinical trials,” said Mitchell D. Schnall, MD, PhD, group co-chair of ECOG-ACRIN.
About ECOG-ACRIN
The ECOG-ACRIN Cancer Research Group (ECOG-ACRIN) is an expansive membership-based scientific organization that designs and conducts cancer research involving adults who have or are at risk of developing cancer. The Group comprises nearly 1400 member institutions and 21,000 research professionals in the United States and around the world. ECOG-ACRIN is known for advancing precision medicine and biomarker research through its leadership of major national clinical trials integrating cutting-edge genomic approaches. Member researchers and advocates collaborate across more than 40 scientific committees to design studies spanning the cancer care spectrum, from early detection to management of advanced disease. ECOG-ACRIN is funded primarily by the National Cancer Institute, part of the National Institutes of Health. Visit ecog-acrin.org, and follow us on X @eaonc, Facebook, LinkedIn, and Instagram.
Media Contact: Diane Dragaud, Director of Communications, communications@ecog-acrin.org.
Random Access Markets: The Free Market Of Information
Information is one of the most valuable commodities in the world, Bitcoin is information transmuted into money. If you want information to be free, give…
Data is the most liquid commodity market in the world. In the smartphone era, unless extreme precautions are taken, everywhere you go, everything you say, and everything you consume is quantifiable among the infinite spectrum of the information goods markets. Information goods, being inherently nonphysical bits of data, can be conceptualized, crafted, produced, or manufactured, disseminated, and consumed exclusively as digital entities. The internet, along with other digital technologies for computation and communication, serves as a comprehensive e-commerce infrastructure, facilitating the entire life cycle of designing, producing, distributing, and consuming a wide array of information goods. The seamless transition of existing information goods from traditional formats to digital formats is easily achievable, not to mention the collection of media formats completely infeasible in the analog world.
A preliminary examination of products within the information goods industry reveals that, while they all exist as pure information products and are uniformly impacted by technological advancements, their respective markets undergo distinct economic transformation processes. These variations in market evolution are inherently tied to differences in product characteristics, production methods, distribution channels, and consumption patterns. Notably, the separation of value creation and revenue processes introduces opportunistic scenarios, potentially leaving established market players with unprofitable customer bases and costly yet diminishing value-creation processes.
Simultaneously, novel organizational architectures may emerge in response to evolving technological conditions, effectively creating and destroying traditional information good markets overnight. The value chains, originally conceived under the assumptions of the traditional information goods economy, undergo radical redesigns as new strategies and tooling materialize in response to the transformative influence of digital production, distribution, and consumption on conventional value propositions for data. For example, mass surveillance was never practical when creating even a single photo meant hours of labor within a specialized photo development room with specific chemical and lightning conditions. Now that there is a camera on every corner, a microphone in every pocket, a ledger entry for every financial transaction, and the means to transmit said data essentially for free across the planet, the market conditions for mass surveillance have unsurprisingly given rise to mass surveillance as a service.
An entirely new industry of “location firms” has grown, with The Markup having demarcated nearly 50 companies selling location data as a service in a 2021 article titled “There’s a Multibillion-Dollar Market for Your Phone’s Location Data” by Keegan and Ng. One such firm, Near, is self-described as curating “one of the world’s largest sources of intelligence on People and Places”, having gathered data representing nearly two billion people across 44 countries. According to a Grand View Research report titled “Location Intelligence Market Size And Share Report, 2030”, the global location intelligence data market cap was worth an estimated “$16.09 billion in 2022 and is projected to grow at a compound annual growth rate (CAGR) of 15.6% from 2023 to 2030”. The market cap of this new information goods industry is mainly “driven by the growing penetration of smart devices and increasing investments in IoT [internet of things] and network services as it facilitates smarter applications and better network connectivity”, giving credence to the idea that technological advancement front-runs network growth which front-runs entirely new forms of e-commerce markets. This, of course, was accelerated by the COVID-19 pandemic, in which government policies resulted in “the increased adoption of location intelligence solutions to manage the changing business scenario as it helps businesses to analyze, map, and share data in terms of the location of their customers”, under the guise of user and societal health.
Within any information goods market, there are only two possible outcomes for market participants: distributing the acquired data or keeping it for yourself.
Click the image above to subscribe!
The Modern Information Goods Market
In the fall of 2021, China launched the Shanghai Data Exchange (SDE) in an attempt to create a state-owned monopoly on a novel speculative commodities market for data scraped from one of the most digitally surveilled populations on the planet. The SDE offered 20 data products at launch, including customer flight information from China Eastern Airlines, as well as data from telecommunications network operators such as China Unicom, China Telecom, and China Mobile. Notably, one of the first known trades made at the SDE was the Commercial Bank of China purchasing data from the state-owned Shanghai Municipal Electric Power Company under the guise of improving their financial services and product offerings.
Shortly before the founding of this data exchange, Huang Qifan, the former mayor of Chongqing, was quoted saying that “the state should monopolize the rights to regulate data and run data exchanges”, while also suggesting that the CCP should be highly selective in setting up data exchanges. “Like stock exchanges, Beijing, Shanghai and Shenzhen can have one, but a general provincial capital city or a municipal city should not have it.”
While the current information goods market has led to such innovations such as speculation on the purchasing of troves of user data, the modern data market was started in earnest at the end of the 1970s, exemplified in the formation of Oracle Corporation in 1977, named after the CIA’s “Project Oracle”, which featured eventual Oracle Corporation co-founders Larry Ellison, Robert Miner, and Ed Oates. The CIA was their first customer, and in 2002, nearly $2.5 billion worth of contracts came from selling software to federal, state, and local governments, accounting for nearly a quarter of their total revenue. Only a few months after September 11, 2001, Ellison penned an op-ed for TheNew York Times titled “A Single National Security Database” in which the opening paragraph reads “The single greatest step we Americans could take to make life tougher for terrorists would be to ensure that all the information in myriad government databases was copied into a single, comprehensive national security database”. Ellison was quoted in Jeffrey Rosen’s book The Naked Crowd as saying “The Oracle database is used to keep track of basically everything. The information about your banks, your checking balance, your savings balance, is stored in an Oracle database. Your airline reservation is stored in an Oracle database. What books you bought on Amazon is stored in an Oracle database. Your profile on Yahoo! is stored in an Oracle database”. Rosen made note of a discussion with David Carney, a former top-three employee at the CIA, who, after 32 years of service at the agency, left to join Oracle just two months after 9/11 to lead its Information Assurance Center:
"How do you say this without sounding callous?" [Carney] asked. "In some ways, 9/11 made business a bit easier. Previous to 9/11 you pretty much had to hype the threat and the problem." Carney said that the summer before the attacks, leaders in the public and private sectors wouldn't sit still for a briefing. Then his face brightened. "Now they clamor for it!"
This relationship has continued for 20 years, and in November 2022, the CIA awarded its Commercial Cloud Enterprise contract to five American companies — Amazon Web Services, Microsoft, Google, IBM, and Oracle. While the CIA did not disclose the exact value of the contract, documents released in 2019 suggested it could be “tens of billions” of dollars over the next 15 years. Unfortunately, this is far from the only data market integration of the private sector, government agencies, and the intelligence community, perhaps best exemplified by data broker LexisNexis.
LexisNexis was founded in 1970, and is, as of 2006, the world’s largest electronic database for legal and public-records-related information. According to their own website, LexisNexis describes themselves as delivering “a comprehensive suite of solutions to arm government agencies with superior data, technology and analytics to support mission success”. LexisNexis consists of nine board members: CEO Haywood Talcove; Dr. Richard Tubb, the longest serving White House physician in U.S. history; Stacia Hylton, former Deputy Director of the U.S. Marshal Service; Brian Stafford, former Director of the U.S. Secret Service; Lee Rivas, CEO for the public sector and health care business units of LexisNexis Risk Solutions; Howard Safir, former NYPD Commissioner and Associate Director of Operations for the U.S. Marshals Service; Floyd Clarke, former Director of the FBI; Henry Udow, Chief Legal Officer and Company Secretary for the RELX Group; and lastly Alan Wade, retired Chief Information Officer for the CIA.
While Wade was still employed by the CIA, he founded Chiliad with Christine Maxwell, sister of Ghislaine Maxwell, and daughter of Robert Maxwell. Christine Maxwell is considered “an early internet pioneer”, having founded Magellan in 1993, one of the premier search engines on the internet. After selling Magellan to Excite, she reinvested her substantial windfall into another big data search technology company: the aforementioned Chiliad. According to a 2020 report by OYE.NEWS, Chiliad made use of “on-demand, massively scalable, intelligent mining of structured and unstructured data through the use of natural language search technologies”, with the firm’s proprietary software being “behind the data search technology used by the FBI’s counterterrorism data warehouse”.
As recently as November 2023, the Wade-connected LexisNexis was given a $16-million, five-year contract with the U.S. Customs and Border Protection “for access to a powerful suite of surveillance tools”, according to available public records, providing access to “social media monitoring, web data such as email addresses and IP address locations, real-time jail booking data, facial recognition services, and cell phone geolocation data analysis tools”. Unfortunately, this is far from the only government agency to utilize LexisNexis’ data brokerage with the aims of circumnavigating constitutional law and civil liberties in regards to surveillance.
In the fall of 2020, LexisNexis was forced to settle for over $5 million after a class action lawsuit alleged the broker sold Department of Motor Vehicle data to U.S. law firms, who were then free to use it for their own business purposes. "Defendants websites allow the purchase of crash reports by report date, location, or driver name and payment by credit card, prepaid bulk accounts or monthly accounts”, the complaint reads. "Purchasers are not required to establish any permissible use provided in the DPPA to obtain access to Plaintiffs' and Class Members' MVRs”. In the summer of 2022, a Freedom of Information Act request revealed a $22 million contract between Immigration and Customs Enforcement and LexisNexis. Sejal Zota, a director at Just Futures Law and a practicing attorney working on the lawsuit, made note that LexisNexis makes it possible for ICE to "instantly access sensitive personal data — all without warrants, subpoenas, any privacy safeguards or any show of reasonableness”.
In the aforementioned complaint from 2022, the use of LexisNexis’ Accurint product allows "law enforcement officers [to] surveil and track people based on information these officers would not, in many cases, otherwise be able to obtain without a subpoena, court order, or other legal process…enabling a massive surveillance state with files on almost every adult U.S. consumer”.
A Series Of Tubes
In 2013, it came to the public’s attention that the National Security Agency had covertly breached the primary communication links connecting Yahoo and Google data centers worldwide. This information was based on documents published by WikiLeaks, originally obtained from former NSA contractor Edward Snowden, and corroborated by interviews of government officials.
As per a classified report dated January 9, 2013, the NSA transmits millions of records daily from internal Yahoo and Google networks to data repositories at the agency's Fort Meade, Maryland headquarters. In the preceding month, field collectors processed and returned 181,280,466 new records, encompassing "metadata" revealing details about the senders and recipients of emails, along with time stamps, as well as the actual content, including text, audio, and video data.
The primary tool employed by the NSA to exploit these data links is a project named MUSCULAR, carried out in collaboration with the British Government Communications Headquarters (GCHQ). Operating from undisclosed interception points, the NSA and GCHQ copy entire data streams through fiber-optic cables connecting the data centers of major Silicon Valley corporations.
This becomes particularly perplexing when considering that, as revealed by a classified document acquired by The Washington Post in 2013, both the NSA and the FBI were already actively tapping into the central servers of nine prominent U.S. internet companies. This covert operation involved extracting audio and video chats, photographs, emails, documents, and connection logs, providing analysts with the means to monitor foreign targets. The method of extraction, as outlined in the document, involves direct collection from the servers of major U.S. service providers: Microsoft, Yahoo, Google, Facebook, PalTalk, AOL, Skype, YouTube, and Apple.
During the same period, the newspaper The Guardian reported that GCHQ — the British counterpart to the NSA — was clandestinely gathering intelligence from these internet companies through a collaborative effort with the NSA. According to documents obtained by The Guardian, the PRISM program seemingly allows GCHQ to bypass the formal legal procedures required in Britain to request personal materials such as emails, photos, and videos, from internet companies based outside the country.
PRISM emerged in 2007 as a successor to President George W. Bush's secret program of warrantless domestic surveillance, following revelations from the news media, lawsuits, and interventions by the Foreign Intelligence Surveillance Court. Congress responded with the Protect America Act in 2007 and the FISA Amendments Act of 2008, providing legal immunity to private companies cooperating voluntarily with U.S. intelligence collection. Microsoft became PRISM's inaugural partner, marking the beginning of years of extensive data collection beneath the surface of a heated national discourse on surveillance and privacy.
In a June 2013 statement, then-Director of National Intelligence James R. Clapper said “information collected under this program is among the most important and valuable foreign intelligence information we collect, and is used to protect our nation from a wide variety of threats. The unauthorized disclosure of information about this important and entirely legal program is reprehensible and risks important protections for the security of Americans”.
So why the need for collection directly from fiber optic cables if these private companies themselves are already providing data to the national intelligence community? Upon further inquiry into the aforementioned data brokers to the NSA and CIA, it would appear that a vast majority of the new submarine fiber optic cables — essential infrastructure to the actualization of the internet as a global data market — are being built out by these same private companies. These inconspicuous cables weave across the global ocean floor, transporting 95-99% of international data through bundles of fiber-optic strands scarcely thicker than a standard garden hose. In total, the active network comprises over 1,100,000 kilometers of submarine cables.
Traditionally, these cables have been owned by a consortium of private companies, primarily telecom providers. However, a notable shift has emerged. In 2016, a significant surge in submarine cable development began, and notably, this time, the purchasers are content providers — particularly the data brokers Meta/Facebook, Google, Microsoft, and Amazon. Of note is Google, having acquired over 100,000 kilometers of submarine cables. With the completion of the Curie Cable in 2019, Google's ownership of submarine cables globally stands at 1.4%, as measured by length. When factoring in cables with shared ownership, Google's overall share increases to approximately 8.5%. Facebook is shortly behind with 92,000 kilometers, with Amazon at 30,000, and Microsoft with around 6,500 kilometers from the partially owned MAREA cable.
There is a notable revival in the undersea cable sector, primarily fueled by investments from Facebook and Google, accounting for around 80% of 2018-2020 investments in transatlantic connections — a significant increase from the less than 20% they accounted for in the preceding three years through 2017, as reported by TeleGeography. This wave of digital giants has fundamentally transformed the dynamics of the industry. Unlike traditional practices where phone companies established dedicated ventures for cable construction, often connecting England to the U.S. for voice calls and limited data traffic, these internet companies now wield considerable influence. They can dictate the cable landing locations, strategically placing them near their data centers, and have the flexibility to modify the line structures — typically costing around $200 million for a transatlantic link — without waiting for partner approvals. These technology behemoths aim to capitalize on the increasing demand for rapid data transfers essential for various applications, including streaming movies, social messaging, and even telemedicine.
The last time we saw such an explosion of activity in building out essential internet infrastructure was during the dot-com boom of the 1990s, in which phone companies spent over $20 billion to install fiber-optic lines beneath the oceans, immediately before the massive proliferation of personal computers, home internet modems, and peer-to-peer data networks.
Data Laundering
The birthing of new compression technologies in the form of digital media formats itself would not have given rise to the panopticon we currently operate under without the ability to obfuscate mass uploading and downloading of this newly created data via the ISP rails of both public and private sector infrastructure companies. There is likely no accident that the creation of these tools, networks, and algorithms were created under the influence of national intelligence agencies right before the turn of the millennium, the rise of broadband internet, and the sweeping unconstitutional spying on citizens made legal via the Patriot Act in the aftermath of the events on September 11, 2001.
Only 15 years old, Sean Parker, the eventual founder of Napster and first president of Facebook — a former DARPA project titled LifeLog — caught the gaze of the FBI for his hacking exploits, ending in state-appointed community service. One year later, Parker was recruited by the CIA after winning a Virginia state computer science fair by developing an early internet crawling application. Instead of continuing his studies, he interned for a D.C. startup, FreeLoader, and eventually UUNet, an internet service provider. “I wasn’t going to school,” Parker told Forbes. “I was technically in a co-op program but in truth was just going to work.” Parker made nearly six figures his senior year of high school, eventually starting the peer-to-peer music-sharing site that became Napster in 1999. While working on Napster, Parker met investor Ron Conway, who has backed every Parker product since, having also previously backed PayPal, Google, and Twitter, among others. Napster has been credited as one of the fastest-growing businesses of all time, and its influence on information goods and data markets in the internet age cannot be overstated.
In a study conducted between April 2000 and November 2001 by Sandvine titled “Peer-to-peer File Sharing: The Impact of File Sharing on Service Provider Networks”, network measurements revealed a notable shift in bandwidth consumption patterns due to the launch of new peer-to-peer tooling, as well as new compression algorithms such as .MP3. Specifically, the percentage of network bandwidth attributed to Napster traffic saw an increase from 23% to 30%, whereas web-related traffic experienced a slight decrease from 20% to 19%. By 2002, observations indicated that file-sharing traffic was consuming a substantial portion, up to 60%, of internet service providers' bandwidth. The creation of new information good markets comes downstream of new technological capabilities, with implications on the scope and scale of current data stream proliferation, clearly noticeable within the domination of internet user activity belonging to peer-to-peer network communications.
Of course, peer-to-peer technology did not cease to advance after Napster, and the invention of “swarms”, a style of downloading and uploading essential to the development of Bram Cohen’s BitTorrent, were invented for eDonkey2000 by Jed McCaleb — the eventual founder of Mt.Gox, Ripple Labs, and the Stellar Foundation. The proliferation of advanced packet exchange over the internet has led to entirely new types of information good markets, essentially boiling down to three main axioms; public and permanent data, selectively private data, and coveted but difficult-to-obtain data.
Click the image above to download a PDF of the article.
Bitcoin-native Data Markets
Parent/Child Recursive Inscriptions
While publishing directly to Bitcoin is hardly a new phenomenon, the popularization of Ord — released by Bitcoin developer Casey Rodarmor in 2022 — has led to a massive increase in interest and activity in Bitcoin-native publishing. While certainly some of this can be attributed to a newly formed artistic culture siphoning away activity and value from Ethereum — and other alternative businesses making erroneous claims of blockchain-native publishing — the majority of this volume comes downstream from the construction of these inscription transactions that use the SegWit discount via specially authored Taproot script, and the awareness of the immutability, durability, and availability of data offered solely by the Bitcoin blockchain. The SegWit discount was specifically created to incentivize the consolidation of unspent transaction outputs and limit the creation of excessive change in the UTXO set, but as for its implications on Bitcoin-native publishing, it has essentially created a substantial 75% markdown on the cost of bits within a block that are stuffed with arbitrary data within an inscription. This is far from a non-factor in the creation of a sustainable information goods market.
Taking this one step further, the implementation of a self-referential inscription mechanism allows users to string data publishing across multiple Bitcoin blocks, limiting the costs from fitting a file into a single block auction. This implies both the ability to inscribe files beyond 4 MB, as well as the utility to reference previously inscribed material, such as executable software, code for generative art, or the image assets themselves. In the case of the recent Project Spartacus, recursive inscriptions that use what is known as a parent inscription were used in order to allow essentially a crowdfunding mechanism in order to publicly source the satoshis needed to publish the Afghan War logs onto the Bitcoin blockchain forever. This solves for the need of public and permanent publishing of known and available data by a pseudonymous set of users, but requires certain data availability during the minting process itself, which opens the door to centralized pressure points and potential censoring of inscription transactions within a public mint by nefarious mining pools.
Precursive Inscriptions
With the advent of Bitcoin-native inscriptions, the possibility of immutable, durable, and censorship-reduced publishing has come to fruition. The current iteration of inscription technology allows for users to post their data via a permanent but publicly propagated Bitcoin transaction. However, this reality has led to yet-to-be confirmed inscription transactions and their associated data being noticed while within the mempool itself. This issue can be mitigated by introducing encryption within the inscription process, leaving encrypted but otherwise innocuous data to be propagated by Bitcoin nodes and eventually published by Bitcoin miners, but with no ability to be censored due to content. This also removes the ability for inscriptions meant for speculation to be front-run by malicious collectors who pull inscription data from the mempool and rebroadcast it at an increased fee rate in order to be confirmed sooner.
Precursive inscriptions aim to create the private, encrypted publishing of data spread out over multiple Bitcoin blocks that can be published at a whim via a recursive publishing transaction containing the private key to decrypt the previously inscribed data. For instance, a collective of whistleblowers could discreetly upload data to the Bitcoin blockchain, unbeknownst to miners or node runners, while deferring its publication until a preferred moment. Since the data will be encrypted during its initial inscribing phase, and since the data will be seemingly uncorrelated until it is recursively associated by the publishing transaction, a user can continually resign and propagate the time-locked parent inscription for extended durations of time. If the user cannot sign a further time-locked publishing transaction due to incarceration, the propagated publishing transaction will be confirmed after the time-lock period ends, thus giving the publisher a dead man’s switch mechanism.
The specially authored precursive inscription process presented in this article offers a novel approach to secure and censorship-resistant data publishing within the Bitcoin blockchain. By leveraging the inherent characteristics of the Bitcoin network, such as its decentralized and immutable nature, the method described here addresses several key challenges in the field of information goods, data inscription, and dissemination. The primary objective of precursive inscriptions is to enhance the security and privacy of data stored on the Bitcoin blockchain, while also mitigating the risk of premature disclosure. One of the most significant advantages of this approach is its ability to ensure that the content remains concealed until the user decides to reveal it. This process not only provides data security but also maintains data integrity and permanence within the Bitcoin blockchain.
This leads us to the third and final fork of the information good data markets needed for the modern age; setting the price for wanted but currently unobtained bits.
ReQuest
ReQuest aims to create a novel data market allowing users to issue bounties for coveted data, seeking the secure and immutable storage of specific information on the Bitcoin blockchain. The primary bounty serves a dual role by covering publishing costs and rewarding those who successfully fulfill the request. Additionally, the protocol allows for the increase of bounties through contributions from other users, increasing the chances of successful fulfillment. Following an inscription submission, users who initiated the bounty can participate in a social validation process to verify the accuracy of the inscribed data.
Implementing this concept involves a combination of social vetting to ensure data accuracy, evaluating contributions to the bounty, and adhering to specific contractual parameters measured in byte size. The bounty fulfillment process requires eligible fulfillers to submit their inscription transaction hash or a live magnet link for consideration. In cases where the desired data is available but not natively published on Bitcoin — or widely known but currently unavailable, such as a renowned .STL file or a software client update — the protocol offers an alternative method to social consensus for fulfillment, involving hashing the file and verifying the resulting SHA-256 output, which provides a foolproof means of meeting the bounty's requirements. The collaborative nature of these bounties, coupled with their ability to encompass various data types, ensures that ReQuest's model can effectively address a broad spectrum of information needs in the market.
For ReQuest bounties involving large file sizes unsuitable for direct inscription on the Bitcoin blockchain, an alternative architecture known as Durabit has been proposed, in which a BitTorrent magnet link is inscribed and its seeding is maintained through a Bitcoin-native, time-locked incentive structure.
Durabit
Durabit aims to incentivize durable, large data distribution in the information age. Through time-locked Bitcoin transactions and the use of magnet links published directly within Bitcoin blocks, Durabit encourages active long-term seeding while even helping to offset initial operational costs. As the bounty escalates, it becomes increasingly attractive for users to participate, creating a self-sustaining incentive structure for content distribution. The Durabit protocol escalates the bounty payouts to provide a sustained incentive for data seeding. This is done not by increasing rewards in satoshi terms, but rather by increasing the epoch length between payouts exponentially, leveraging the assumed long-term price increase due to deflationary economic policy in order to keep initial distribution costs low. Durabit has the potential to architect a specific type of information goods market via monetized file sharing and further integrate Bitcoin into the decades-long, peer-to-peer revolution.
These novel information good markets actualized by new Bitcon-native tooling can potentially reframe the fight for publishing, finding, and upholding data as the public square continues to erode.
Increasing The Cost Of Conspiracy
The information war is fought on two fronts; the architecture that incentivizes durable and immutable public data publishing, and the disincentivization of the large-scale gathering of personal data — often sold back to us in the form of specialized commercial content or surveilled by intelligence to aid in targeted propaganda, psychological operations, and the restriction of dissident narratives and publishers. The conveniences offered by walled garden apps and the private-sector-in-name-only networks are presented in order to access troves of metadata from real users. While user metrics can be inflated, the data gleaned from these bots are completely useless to data harvesting commercial applications such as Language Learning Models (LLMs) and current applicable AI interfaces.
There are two axioms in which these algorithms necessitate verifiable data; the authenticity of the model’s code itself, and the selected input it inevitably parses. As for the protocol itself, in order to ensure replicability of desired features and mitigate any harmful adversarial functionality, techniques such as hashing previously audited code upon publishing state updates could be utilized. Dealing with the input of these LLMs’ learning fodder is seemingly also two-pronged; cryptographic sovereignty over that data which is actually valuable to the open market, and the active jamming of signal fidelity with data-chaff. It is perhaps not realistic to expect your everyday person to run noise-generating APIs that constantly feed the farmed, public datasets with heaps of lossy data, causing a data-driven feedback on these self-learning algorithms. But by creating alternative data structures and markets, built to the qualities of the specific “information good”, we can perhaps incentivize — at least subsidize — the perceived economic cost of everyday people giving up their convenience. The trend of deflation of publishing costs via digital and the interconnectivity of the internet has made it all the more essential for everyday people to at least take back control of their own metadata.
It is not simply data that is the new commodity of the digital age, but your data: where you have been, what you have purchased, who you talk to, and the many manipulated whys that can be triangulated from the aforementioned wheres, whats, and whos. By mitigating the access to this data via obfuscation methods such as using VPNs, transacting with private payment tools, and choosing hardware powered by certain open source software, users can meaningfully increase the cost needed for data harvesting by the intelligence community and its private sector compatriots. The information age requires engaged participants, incentivized by the structures upholding and distributing the world’s data — their data — on the last remaining alcoves of the public square, as well as encouraged and active retention of our own information.
Most of the time, a random, large number represented in bits is of little value to a prospective buyer. And yet Bitcoin’s store-of-value property is derived entirely from users being able to publicly and immutably publish a signature to the blockchain, possible only from the successful keeping of a private key secret. A baselayer Bitcoin transaction fee is priced not by the amount of value transferred, but by how many bytes of space is required in a specific block to articulate all its spend restrictions, represented in sat/vbyte. Bitcoin is a database that manages to incentivize users replicating its ledger, communicating its state updates, and utilizing large swaths of energy to randomize its consensus model.
Every ten minutes, on average, another 4 MB auction.
If you want information to be free, give it a free market.
This article is featured in Bitcoin Magazine’s“The Inscription Issue”. Click here to get your Annual Bitcoin Magazine Subscription.
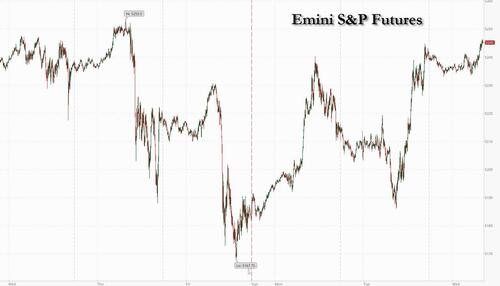
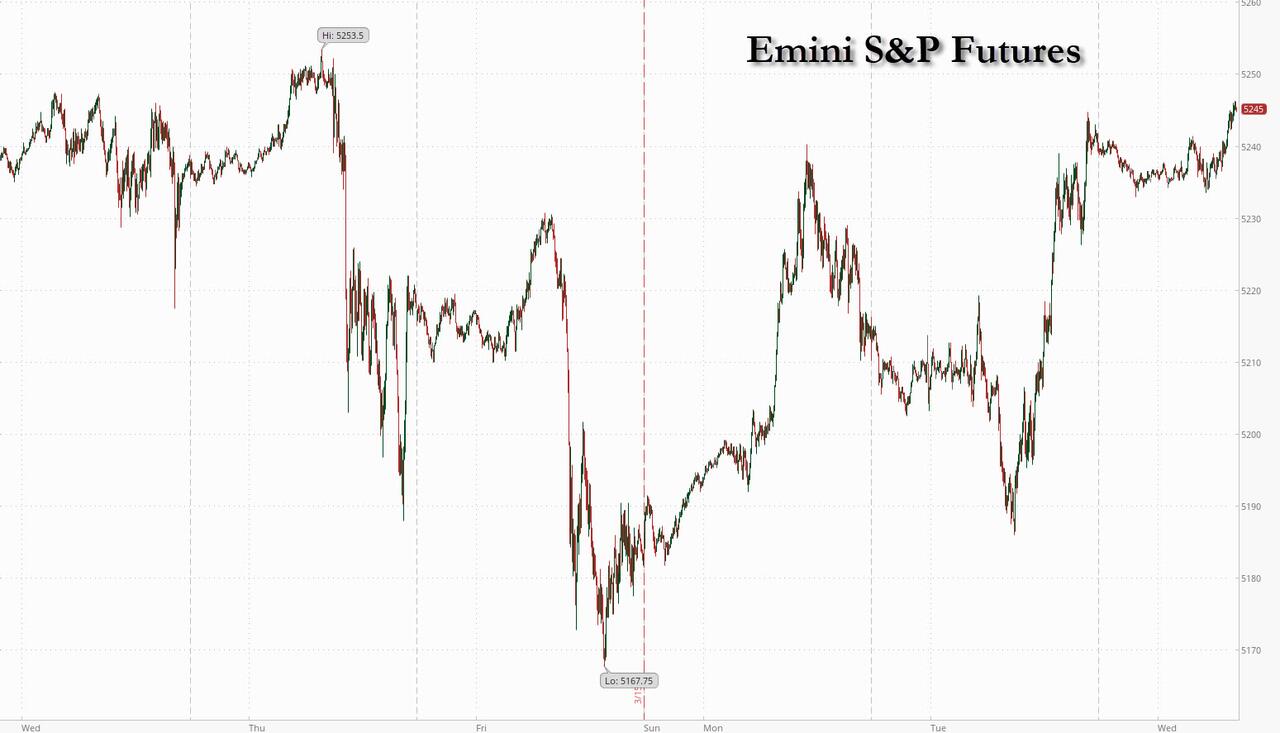
US futures are flat after Tuesday’s record-high cash close, having rebounded from overnight session lows ahead of the Fed meeting where nobody expects any rate change and where some (but not consensus) expect a hawkish move in the dots to signal 2 rate cuts instead of 3 (Goldman and most big banks still expect 3 cuts) as well as gleaning some insight on what the Fed's QT tapering will look like. As of 8:00am, S&P futures were up 0.1%, reversing an earlier loss of 0.3%, while Nasdaq futures gained 0.3%.
In Europe, most markets are lower with Germany/Italy in the green and the France the biggest laggard as Kering’s Gucci APAC profits fall ~20%, dragging all China-related names down. UK inflation prints dovish to expectations. Intel shares jumped after the chipmaker won almost $20 billion in chips incentives to expand US plants. Meanwhile, the Biden administration is also considering blacklisting a number of Chinese semiconductor firms linked to Huawei after the telecom giant notched a significant technological breakthrough last year. Bond yields are down 1bps as USD strength and yen weakness continues after the cartoonish BOJ's first rate hike in 17 years paradoxically sent the USDJPY above 151.50, its highest level this decade. Commodities were sold across the board including Ags, Energy, and Metals.
In premarket trading, Mag7 names are mixed and Intel was the standout in Semis space after it won almost $20 billion in federal grants and loans to help fund an expansion of its semiconductor factories on American soil thanks to the Chips Act. Here are some other notable premarket movers:
Amcor ADRs drop 3.3% after the packaging company announces CEO Ron Delia’s retirement.
Cannabis stocks rise, with Canopy Growth leading gains in the sector as the company is set to extend gains for a fourth straight session.
Gildan Activewear ADRs advance 2.1%, with the Canadian clothing manufacturer set to extend gains for a second session. The company confirmed on Tuesday it had received an expression of interest and was reviewing the proposal. Bloomberg reported private equity firm Sycamore Partners was exploring an offer.
International Paper shares gain 1.1% after appointing KKR’s Andrew Silvernail as CEO to succeed Mark Sutton, who has served in the post since 2014.
Mobileye shares rise 4.7% after the firm deepened its partnership with Volkswagen to accelerate development of automated driving functions, targeting premium offerings for the Audi, Bentley, Lamborghini and Porsche brands.
Riot Platforms shares gain 2.9% as JPMorgan raised to overweight from neutral, saying the stock offers the best relative upside among Marathon and CleanSpark — the three largest and most liquid US-listed mining stocks.
Taysha Gene Therapies shares soar 27% after providing preliminary results for two patients who received its experimental gene therapy.
Tesla shares tick 0.8% higher after the EV maker announced plans to raise the starting price of its locally-made Model Y sport utility vehicles in China by 5,000 yuan ($700) from April 1.
The focus today is firmly on the FOMC decision and the path for US interest rates (full preview here). While the central bank is expected to hold, investors will be parsing commentary to assess how quickly it might start to ease. The decision and economic forecasts will be released at 2 p.m. in Washington. Chair Jerome Powell will hold a press conference 30 minutes later. The Fed’s dot plot of rates projections will be in focus as investors gauge how many cuts policymakers are expecting this year.
“The risk of those dots shifting has grown and if we do see that median move higher, then obviously you’d expect a knee jerk rally in the dollar and a knee jerk move lower in Treasuries and equities,” said Michael Brown, senior research strategist at Pepperstone Group Limited. “With that risk on the horizon, no one has particularly much conviction to do anything much this morning.”
Europe's Stoxx 600 dropped 0.1% having earlier fallen as much as 0.4%, while the CAC 40 loses 0.6%, led lower by luxury shares after Kering warned that sales at Gucci have fallen about 20% in the first quarter in Asia-Pacific, fueling worries about high-end consumer spending in China. Kering was one of the biggest drops in the Stoxx 600 Index, with LVMH, Burberry Group Plc and Christian Dior SE also seeing losses. Here are some of the biggest European movers Wednesday:
Johnson Matthey rises as much as 9.7% after the British conglomerate agrees to sell its Medical Device Components business to Montagu Private Equity for £550m
BASF gains as much as 2.1% as Berenberg upgrades to buy, saying “there can hardly be a more compelling reason” to turn positive than at start of a recovery from a recent slump
Terna gains as much as 5.5% after the Italian utility presented its strategic plan through 2028, with Goldman upgrading its rating to neutral and highlighting a “positive surprise”
Lonza rises as much as 5.2% on its purchase of the Genentech biologics manufacturing site in California from Roche for $1.2 billion
Eutelsat rises as much as 5.7% after the satellite operator announced a partnership deal with Intelsat worth up to $500 million over seven years
Idorsia soars as much as 18% following FDA approval of its hypertension drug, also known as aprocitentan, which should unlock its next deal, according to Jefferies
Beneteau rises as much as 6.9%, hitting highest since Sept. 2023, as Oddo says the French sailboat manufacturer’s results are “excellent”
Bureau Veritas rises as much as 6.6% after the French testing, inspection and certification company outlined its growth ambitions for the coming years
Kering plunges as much as 15% after the company warned of a steep drop in sales at its Gucci brand, notably in Asia-Pacific, pulling peers in the European luxury sector lower
FDM Group slumps as much as 12% following the professional services provider’s 2023 results. Numis says challenging conditions remain in place
Trustpilot falls as much as 9.4% after an offering of 15.5m shares by holder Vitruvian Partners priced at 200p apiece, representing 3.9% discount to Tuesday’s close
Earlier in the session, Asian stocks inched higher as Korean shares rose and Chinese stocks shook off earlier losses. The MSCI Asia Pacific Index gained less than 0.1% with Tencent and Samsung Electronics rising, while SK Hynix and AIA Group declined. Stocks rebounded in Korea after Tuesday’s selloff led by strong gains in some technology and financial services companies. Stocks were closed in Japan for a public holiday. Chinese stocks moved higher after banks left five-year and one-year prime lending rate as expected. Traders are looking for fresh catalysts to extend a rally that is now into its sixth week. Investors await the earnings from Tencent Holdings for further cues on the nation’s corporate earnings trajectory.
“We have seen a base forming” in China markets because of government action, Audrey Goh, head of asset allocation at Standard Chartered Wealth Management, told Bloomberg TV. “Overall the backdrop for Chinese equities still remains quite lackluster. We need a bit more in terms of policy support from the government to entice investors back to the market.”
In FX, the Bloomberg Dollar Index was up for a fifth day for the first time since early January; the pound whipsawed after Britain’s inflation rate fell more sharply than expected. The Bank of England meets on rates on Thursday, but a move is unlikely as policymakers say they need further evidence that price pressures will fall back sustainably. The yen is again one of the weakest of the G-10 currencies for a second day, falling 0.6% versus the greenback, and about to hit a decade low against the greenback.
In rates, Treasury yields are lower across the curve, led by gilts after benign UK CPI data drove a dovish re-pricing in Bank of England rate-cut expectations. Yields are down 1bp-2bp across the curve with 10-year yields falling 1bp to 4.275% after reaching weekly low. Gilts are ~3.5bp richer vs USTs in 10-year sector, after UK inflation slowed more than expected in February. For Fed communications, focus is on potential for changes to policy members’ median projections for fed funds through 2026 and longer run, with traders broadly holding a hawkish set-up to the meeting. Treasury auctions resume Thursday with $16b 10-year TIPS reopening.
In commodities, oil dipped after a two-day gain as an industry group flagged a fall in US crude stockpiles, while gold traded in a narrow band ahead of the Fed.
Bitcoin reversed an overnight loss to trade flat around $64,000.
Today's US economic data calendar is empty before the Fed rate decision and economic projections at 2pm New York time and Powell’s new conference at 2:30pm
Market Snapshot
S&P 500 futures little changed at 5,238.25
MXAP down 0.1% to 174.88
MXAPJ little changed at 530.06
Nikkei up 0.7% to 40,003.60
Topix up 1.1% to 2,750.97
Hang Seng Index little changed at 16,543.07
Shanghai Composite up 0.6% to 3,079.69
Sensex up 0.2% to 72,176.27
Australia S&P/ASX 200 little changed at 7,695.76
Kospi up 1.3% to 2,690.14
STOXX Europe 600 down 0.3% to 503.71
German 10Y yield little changed at 2.41%
Euro little changed at $1.0856
Brent Futures down 0.8% to $86.67/bbl
Gold spot down 0.0% to $2,156.68
US Dollar Index up 0.16% to 103.99
Top Overnight News
As tensions rise with China, Taiwan’s defense minister has hinted that U.S. troops have been training the Taiwanese military on outlying islands that would be on the front lines of a conflict with its neighbor. WSJ
The Biden administration is considering blacklisting a number of Chinese semiconductor firms linked to Huawei Technologies Co. after the telecom giant notched a significant technological breakthrough last year. BBG
Benjamin Netanyahu insisted Israel would launch a ground assault on Rafah, despite pressure from the US not to carry out a large operation in the Gazan city where hundreds of thousands of people are sheltering. FT
UK inflation cools by more than anticipated in Feb, with headline coming in at +3.4% (down from +4% in Jan and below the Street’s +3.5% forecast) while core dipped to +4.5% (down from +5.1% in Jan and below the Street’s +4.6% forecast), although the services CPI ran a bit warmer at +6.1% (down from +6.5% in Jan, but above the Street’s +6% forecast). RTRS
ECB’s Lagarde says price/wage disinflation progress is occurring, but more time is needed for the central bank to assess the situation, which means the first cut probably won’t come until June at the earliest (“we will know a bit more by April and a lot more by June”). ECB
FOMC: We suspect that the Fed leadership is still targeting a first cut in June, and this combined with a default pace of one cut per quarter implies that the most natural outcome for the median dot is to remain unchanged at 3 cuts or 4.625% for 2024. We expect the median dots to remain unchanged at 3.625% for 2025 and 2.875% for 2026 as well. We expect the longer run dots to gradually drift higher over time, with a small tick up a bit more likely than not this week. The only significant change to the economic forecasts should be an increase in 2024 GDP growth. GIR
John Paulson will host a Florida fundraiser for Donald Trump next month, as the former president tries to match Joe Biden’s money operation and pay for a growing pile of legal bills and judgments. FT
JPMorgan surprised with a 9.5% dividend hike on the back of record annual profit. The firm’s asset-management division named Jonathan Sherman the next head of its US equities business. BBG
Intel jumped premarket after winning $8.5 billion in US grants — and as much as $11 billion in loans — to help fund the expansion of its domestic factories. The White House is also weighing blacklisting Chinese chip firms linked to Huawei, people familiar said, escalating its campaign to curtail Beijing’s AI and semiconductor ambitions. BBG
A more detailed look at global markets courtesy of Newsquawk
APAC stocks traded cautiously and mostly rangebound ahead of the FOMC and with Japanese markets closed. ASX 200 struggled for direction as strength in energy was offset by losses in the tech and consumer sectors. KOSPI outperformed as South Korea plans to cut corporate and dividend income tax to encourage a higher shareholder return, while index heavyweight Samsung Electronics (005930 KS) rose over 5% and was helped by reports that NVIDIA looks to procure high-bandwidth memory chips from the Co. Hang Seng and Shanghai Comp. were indecisive as participants digested the latest earnings releases, while Prada (1913 HK) shares slipped in early trade after Gucci owner Kering (KER FP) issued a luxury sector warning amid Asia-Pacific weakness, while the mainland was kept afloat following the lack of surprises from the PBoC's benchmark LPRs which were maintained at their current levels
Top Asian News
PBoC reshuffled its Monetary Policy Committee which now includes China securities regulator head Wu Qing and PBoC Vice Governor Xuan Changneng, while the committee also has two new academic members, Huang Yiping from Peking University and Huang Haizhou from Tsinghua University.
Chinese Foreign Minister Wang Yi said in a meeting with his Australian counterpart that their economies are highly complementary and have great potential, while he stressed that since relations are on the right track, they must not hesitate, deviate or turn back. Furthermore, Wang said regarding China's sovereignty, dignity and legitimate concerns, that they hope that the Australian side will continue to abide by commitments it has made, as well as respect and properly handle them.
Australian Foreign Minister Wong said she discussed a range of shared interests with her Chinese counterpart and welcomes progress in the removal of trade impediments with China. Wong added she discussed volatility in nickel markets with China and raised concerns about human rights, including in Xinjiang, Tibet, and Hong Kong, while they will seek to manage differences with China wisely.
China's embassy in the UK commented regarding UK Foreign Secretary Cameron's remarks on Hong Kong's new law and urged the British side to stop making groundless accusations against the legislation of Article 23, while it added that Hong Kong affairs are purely China's internal affairs and the British side is not qualified to make irresponsible remarks.
US is said to consider sanctioning Huawei's chipmaking network which could be added to the entity list, while the companies that could be blacklisted over links with Huawei include chipmakers Qingdao Si’en, Swaysure, and Shenzhen Pensun Technology, according to Bloomberg.
Tencent (700 HK/TCEHY) - Q4 (CNY): Revenue 155.20bln (exp. 157.42bln). FY Adj. Net 157.7bln (exp. 152.97bln). FY-end combined MAU of Weixin and WeChat 1.343bln (prev. 1.313bln); Recommended final dividend of HKD 3.40/shr.
Tencent (700 HK/TCEHY) President says Chinese gaming regulator has approved many licenses since December to show support for the industry; says Q1 video games revenue will be weaker Y/Y.
European bourses, Stoxx600 (-0.2%) are mostly lower, with clear underperformance in the CAC 40 (-0.8%), with Luxury names hampered by Kering (-14.4%). European sectors are mostly lower; Consumer Products and Services is slumped at the foot of the pile after Kering issued a profit warning, which has weighed on peers such as LVMH (-2.9%)/Hermes (-1.9%). US equity futures (ES -0.1%, NQ -0.1%, RTY -0.5%) are softer, with clear underperformance in the RTY, as it pares back yesterday's gains; Intel (+2.2% pre-market) gains after being awarded approx. USD 20bln in grants by the Biden Administration.
Top European News
ECB President Lagarde: "Building confidence in the path ahead"; "when it comes to the data that is relevant for our policy decisions, we will know a bit more by April and a lot more by June.". "Three domestic factors that will be to ensuring that the inflation path evolves as we project: 1. Wage Growth, 2. Profit Margins 3. Productivity Growth"; Echoes rhetoric from the prior ECB meeting.
EU Council and Parliament provisionally agreed to renew the suspension of import duties and quotas on Ukrainian exports to the EU until June 2025, according to Reuters.
FX
Dollar is firmer vs. peers as JPY weakness provides support and has led DXY above yesterday's peak at 104.05 (vs current 104.12). Resistance comes via the March high at 104.29. Fate for USD is likely to be sealed by today's FOMC meeting.
EUR is weighed on by the broadly firmer USD with not much in the way of fresh EZ-specific updates as comments from Lagarde reiterate recent remarks. EUR/USD trough yesterday was 1.0834 with 200DMA just above at 1.0838.
GBP is softer vs. USD but flat against EUR following slightly softer-than-expected UK inflation metrics. Cable has been as low as 1.2690 but is yet to test its 50DMA to the downside at 1.2684.
Another session of losses for JPY as yesterday's BoJ hike fails to stop the rot in the absence of a dovish turn from the Fed. USD/JPY has been as high as 151.58 with technicians highlighting the 2023 high at 151.91 and 2022 high at 151.94. Continued upside will prompt speculation of intervention.
Antipodeans are both softer vs. the USD. AUD/USD is holding above yesterday's 0.6563 trough, whilst NZD/USD has extended downside to print a fresh YTD low at 0.6031.
PBoC set USD/CNY mid-point at 7.0968 vs exp. 7.1967 (prev. 7.0985).
Fixed Income
Gilts gapped higher by 24 ticks to 98.97 after the region's softer-than-expected CPI numbers. Gilts continued to advance higher reaching a 99.30 peak, before fading the move back towards 99.00.
Bunds hold a bullish tilt, given the UK data. Thereafter, nothing fundamentally new from ECB's Lagarde who kept the emphasis on June. Price action generally mirrors Gilts, with Bunds printing a high at 132.34, before eventually fading the move.
UST price action is in-fitting with the above but slightly more contained overall. USTs remain around the 110-08 mark after Tuesday's particularly strong 20yr auction with newsflow since thin and the narrative honing in on the FOMC.
Commodities
A subdued session for crude thus far, amid the broadly risk-averse mood coupled with a stronger Dollar, with the complex giving back some of its recent gains despite the heightened geopolitical tensions and slightly bullish private inventory data.
Precious metals upside has been capped by the firmer Dollar with participants on standby for the FOMC release, dot plots, and press conference. XAU holds around 2,150/oz within a USD 2,154.55-2,160.30/oz range.
Base metals are mixed with price action largely dictated by the Greenback and amid the cautious risk sentiment. Price action in Europe has been contained thus far.
Peru copper production declined 1.2% Y/Y in January to 205,375 metric tons, according to the Mines and Energy Ministry.
Russian Energy Minister Shulginov says the situation on domestic fuel market is under constant surveillance; measures are being taken to keep gasoline surplus.
Norway's Prelim (Feb) oil production 1.897mln BPD (prev. 1.829mln M/M); Gas production 10.4bln CU metres (prev. 11.71bln cu meters M/M).
Geopolitics: Middle East
US President Biden said the war in Gaza has caused terrible suffering to the Palestinian people and they will continue to lead international efforts to deliver more humanitarian aid to the people of Gaza people, while it was also reported that Defense Secretary Austin will host his Israeli counterpart next week for a bilateral meeting.
UK Foreign Secretary Cameron said hostages held by Hamas in Gaza must be released and the most important thing now is a pause in fighting to get hostages out and aid in. Cameron stated it is crucial to turn a pause in fighting into a permanent, sustainable ceasefire and that a ceasefire can only be achieved with conditions being fulfilled, while he added they must get Hamas leaders out of Gaza and dismantle their network to ensure a ceasefire lasts, according to a Reuters interview.
"Israeli media: Blinken to visit Israel on Friday", according to Sky News Arabia.
"Agreement on truce in Gaza is not imminent, but there is slow progress in the negotiations", according to Al Arabiya citing sources
Geopolitics: Other
China's embassy in the Philippines said US Secretary of State Blinken's remarks about the South China Sea ignored facts and groundlessly accused China regarding its activities in the South China Sea. Furthermore, it stated that remarks once again threatened China with the 'so-called' US-Philippine Mutual Defence Treaty obligations which China firmly opposes, while China advises the US not to stir up trouble or take sides on the South China Sea issue.
Taiwan's Foreign Minister said China has built "enormous" military bases on three islands surrounding Taiwan's main holding in the South China Sea, according to Reuters.
US Air Force said it conducted a successful hypersonic weapons test, according to Reuters.
North Korea leader Kim guided a solid fuel engine test for a new intermediate-range hypersonic missile, according to KCNA.
US Event Calendar
07:00: March MBA Mortgage Applications -1.6%, prior 7.1%
14:00: March FOMC Rate Decision
DB's Jim Reid concludes the overnight wrap
As we arrive at another Fed decision day, markets have posted further advances ahead of the announcement, with both the S&P 500 (+0.56%) and Europe’s STOXX 600 (+0.26%) moving higher. However, there were growing warnings under the surface, particularly on the inflation side, as Brent crude oil prices closed above $87/bbl for the first time since October. So it’s clear there are several price pressures in the pipeline, which has led to fresh doubts about whether we’ll get rate cuts by the summer after all. Moreover, there are increasing signs that investors are pricing this in, with US 1yr inflation swaps inching up to 2.64%, their highest level since October, even as bond yields eased off from Monday’s 3-month highs.
When it comes to the Fed’s decision, it’s widely expected they’ll keep rates on hold today. So the main focus will instead be on the latest Summary of Economic Projections, including the dot plot for where officials see rates moving over the next few years. As a reminder, the last dot plot in December pencilled in three rate cuts for 2024, which led to a significant multi-asset rally as investors grew confident that rate cuts were on the horizon. But since then, the inflation reports for both January and February were stronger than expected, with core CPI running at a monthly +0.4%.
Given those developments on the inflation side, there’s been growing speculation about whether the Fed might signal fewer than three cuts in today’s dot plot. Indeed, it’s worth noting that back in December, 8 of the 19 officials already had two rate cuts or less for 2024, so it would only take two other officials to shift hawkishly for the median dot to move up to two cuts. In their preview (link here), DB’s US economists expect the median dot to remain at three cuts in 2024, but they think the Fed will raise their 2025 and 2026 dots slightly to show less easing further out. That will be significant if so, as the post-pandemic dot plots repeatedly moved the dots up or held them steady at every meeting, up until December, when the dots finally moved lower compared to the meeting before. So if this March dot plot does move the dots higher again, it will make the dovish shift in December look more like a blip than a turning point.
We have argued for some time that central banks face an unenviable challenge in calibrating their policy this year given the long and variable policy lags and the extreme nature of the recent inflation shock and accompanying post-Covid structural shifts. In yesterday’s note here , looking at credit cycles across the US and Europe, Peter Sidorov argues that this calibration challenge is the toughest for the Fed, with the US seeing more resilient credit conditions than Europe, but with more of the delayed impact of rate hikes still to play out there. The note is a useful reminder of the challenges the Fed will face going forward so good context ahead of the conclusion of the FOMC today.
Leading up to their final deliberations, markets have managed to post further gains over the last 24 hours, with the S&P 500 recovering from a -0.35% decline after the open yesterday to close +0.56% higher. Energy stocks (+1.08%) led the advance amidst the rise in oil prices, with consumer discretionary (+0.86%) and industrials (+0.82%) also posting strong gains. The broad gains saw 76% of the S&P constituents up on the day, with the equal-weighted S&P 500 up +0.58%. Moreover, even as the Magnificent 7 (+0.36%) lagged the S&P 500, its gain was still enough to take the group up to a fresh all-time high. Finally in Europe, the story was also one of modest gains, with the STOXX 600 up +0.26%. However, both the CAC 40 (+0.65%) and the DAX (+0.31%) saw larger advances, which left both of them at new records as well.
Over on the rates side, US Treasuries rallied before the Fed’s decision, with the 10yr yield (-3.1bps) coming down from its YTD high the previous day to close at 4.29%, with the rally extending after a strong 20yr Treasury auction. But the rally was more prominent at the front end, with the 2yr yield (-4.8bps) down to 4.685% as investors priced in slightly more rate cuts for the remainder of the year. For example, the amount of cuts priced by the Fed’s December meeting rose +2.4bps to 73bps, having closed at its lowest of 2024 so far on Monday, at just 71bps. Still, the last three sessions are the first time since November that markets have priced less 2024 easing than the December median FOMC dot of 75bps.
Meanwhile in Europe, the main story was one of wider spreads, as yields on 10yr bunds (-1.0bps) and OATs (-0.6bps) fell back, whereas those on Italian BTPs (+2.3bps) and Greek bonds (+3.8bps) both moved higher.
Asian equity markets are mostly trading higher this morning led by the KOSPI (+1.30%) which is being propelled by a +4.81% rise in index heavyweight Samsung Electronics. Elsewhere the Hang Seng is reversing initial losses to gain (+0.18%) with the CSI (+0.20%) and the Shanghai Composite (+0.45%) also edging higher. Japan is closed for a public holiday which means no cash US Treasury trading. S&P 500 (-0.11%) and NASDAQ 100 (-0.12%) futures are edging lower.
In FX, the Japanese yen (-0.41%) is extending its losses and trading at a 4-month low of 151.45 and within touching distance of its weakest level since 1990 even after the BoJ moved away from negative interest rates and yield curve control yesterday. Against the euro it's now at a 16-year low of 164.60. The Yen is still a funder in the global carry trade and yesterday's inline policy meeting hasn't changed that yet.
Moving back across the world, over in Canada there was some brighter news on inflation yesterday, as CPI unexpectedly fell to +2.8% in February (vs. +3.1% expected). That helped support an outperformance in Canadian sovereign bonds, with the 10yr yield down -7.4bps on the day. The release also led investors to price in a significantly higher chance of a rate cut by the June meeting, with overnight index swaps moving up the probability from 49% on Monday to 79% by yesterday’s close. Looking forward, the next inflation release comes from the UK this morning shortly after we go to press, which will be in focus ahead of the Bank of England’s next decision tomorrow.
Elsewhere on the data side, US housing starts rose by more than expected in February, up to an annualised rate of 1.521m (vs. 1.440m expected), whilst building permits also rose to an annualised rate of 1.518m (vs. 1.496m expected). Over in Germany, the ZEW survey also came out for March, with the expectations component up to 31.7 (vs. 20.5 expected), which is its highest level since February 2022.
To the day ahead now, and the main highlight will be the Federal Reserve’s policy decision and Chair Powell’s subsequent press conference. Otherwise, data releases include UK CPI for February, Italian industrial production for January, and the European Commission’s preliminary consumer confidence indicator for the Euro Area in March. From central banks, we’ll also hear from ECB President Lagarde, and the ECB’s Lane, De Cos, Schnabel, Nagel and Villeroy.
We use cookies on our website to give you the most relevant experience by remembering your preferences and repeat visits. By clicking “Accept”, you consent to the use of ALL the cookies.
This website uses cookies to improve your experience while you navigate through the website. Out of these, the cookies that are categorized as necessary are stored on your browser as they are essential for the working of basic functionalities of the website. We also use third-party cookies that help us analyze and understand how you use this website. These cookies will be stored in your browser only with your consent. You also have the option to opt-out of these cookies. But opting out of some of these cookies may affect your browsing experience.
Necessary cookies are absolutely essential for the website to function properly. These cookies ensure basic functionalities and security features of the website, anonymously.
Cookie
Duration
Description
cookielawinfo-checbox-analytics
11 months
This cookie is set by GDPR Cookie Consent plugin. The cookie is used to store the user consent for the cookies in the category "Analytics".
cookielawinfo-checbox-functional
11 months
The cookie is set by GDPR cookie consent to record the user consent for the cookies in the category "Functional".
cookielawinfo-checbox-others
11 months
This cookie is set by GDPR Cookie Consent plugin. The cookie is used to store the user consent for the cookies in the category "Other.
cookielawinfo-checkbox-necessary
11 months
This cookie is set by GDPR Cookie Consent plugin. The cookies is used to store the user consent for the cookies in the category "Necessary".
cookielawinfo-checkbox-performance
11 months
This cookie is set by GDPR Cookie Consent plugin. The cookie is used to store the user consent for the cookies in the category "Performance".
viewed_cookie_policy
11 months
The cookie is set by the GDPR Cookie Consent plugin and is used to store whether or not user has consented to the use of cookies. It does not store any personal data.
Functional cookies help to perform certain functionalities like sharing the content of the website on social media platforms, collect feedbacks, and other third-party features.
Performance cookies are used to understand and analyze the key performance indexes of the website which helps in delivering a better user experience for the visitors.
Analytical cookies are used to understand how visitors interact with the website. These cookies help provide information on metrics the number of visitors, bounce rate, traffic source, etc.
Advertisement cookies are used to provide visitors with relevant ads and marketing campaigns. These cookies track visitors across websites and collect information to provide customized ads.


