Uncategorized
Glass tableware market to grow by USD 1,493.77 Mn: Household products market is the parent market – Technavio
Glass tableware market to grow by USD 1,493.77 Mn: Household products market is the parent market – Technavio
PR Newswire
NEW YORK, Dec. 13, 2022
NEW YORK, Dec. 13, 2022 /PRNewswire/ — The global glass tableware market has been categorized as a pa…
Share this:

Glass tableware market to grow by USD 1,493.77 Mn: Household products market is the parent market - Technavio
PR Newswire
NEW YORK, Dec. 13, 2022
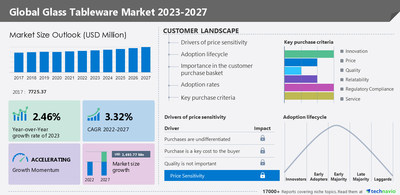
NEW YORK, Dec. 13, 2022 /PRNewswire/ -- The global glass tableware market has been categorized as a part of the global household products market. The parent market, the global household products market, covers non-durable household products, including detergents, soaps, diapers, and other tissue and household paper products.
The glass tableware market size is forecast to grow by USD 1,493.77 million, at a CAGR of 3.32% between 2022 and 2027, according to Technavio, Download a report sample
The glass tableware market report covers the following areas:
The report also offers an up-to-date analysis regarding the current market scenario, the latest trends and drivers, and the overall market environment.
The global glass tableware market is fragmented. The market comprises several large and small vendors that offer various types of glass tableware. The presence of numerous vendors in the market makes it competitive, which is compelling vendors to adopt pricing and marketing strategies to retain their existing market shares and seize new market opportunities. However, the increasing competition among manufacturers may lead them to reduce the prices of their products, which can have a negative impact on their profit margins. Further, the entry by new players into the market requires high capital investments. Thus, the threat of substitutes is moderate in 2022 and is expected to remain the same during the forecast period.
Anchor Hocking LLC, Anhui Deli Daily Glass Co. Ltd., arc online, Bormioli Rocco Spa, Cedar Glass SAE, Corelle Brands LLC, Glass Source GmbH, Inter IKEA Holding BV, Kavalierglass AS, Krosno Glass SA, LaOpala RG Pvt. Ltd., Lenox Corp., Libbey Inc., Ocean Glass Public Co. Ltd., and PGP Glass Pvt. Ltd. are among some of the major market participants.
The competitive scenario categorizes companies based on various performance indicators. Some of the factors considered include the financial performance of companies, growth strategies, product innovations, new product launches, investments, and growth in market share among others. Buy the Report
- Product
- Dinnerware
- Beverageware
- Others
The dinnerware segment held the largest share of the market in 2022. The segment includes plates and other serving dishes. The demand for these products is on the rise due to the rapid economic growth in developing countries and the shift in the lifestyle of consumers. In addition to this, factors such as the rising disposable income of consumers and westernization are fueling the growth of the segment.
- Geography
- China
- India
- The U.K.
- Germany
- France
- Rest of Europe
- The U.S.
- Canada
- Saudi Arabia
- South Africa
- Rest of the Middle East & Africa
- Brazil
- Argentina
- APAC
- Europe
- North America
- Middle East & Africa
- South America
APAC is estimated to account for 54% of the market's growth during the forecast period. The rising disposable income and increasing economic activities have put a majority of the lower-middle-class population in the upper-middle-class segment. This transformation is creating a significant demand for a wide range of premium consumer goods and items, including glass tableware. Also, many consumers in the region are switching from conventional stainless steel, plastic, and melamine tableware to glass tableware products. All these factors are driving the growth of the regional market.
To gain further insights about various segments, Request a PDF Sample
- CAGR of the market during the forecast period.
- Detailed information on factors that will drive the growth of the market between 2023 and 2027
- Precise estimation of the size of the glass tableware market and its contribution to the parent market.
- Accurate predictions about upcoming trends and changes in consumer behavior.
- Growth of the market industry across APAC, Europe, North America, South America, and Middle East and Africa.
- Thorough analysis of the market's competitive landscape and detailed information about vendors.
- Comprehensive analysis of factors that will challenge the growth of glass tableware market vendors.
Subscribe to our "Basic Plan" billed annually at USD 5000 which enables you to download 5 reports per month.
- The cookware market size is expected to increase by USD 8.99 billion from 2021 to 2026, and the market's growth momentum will accelerate at a CAGR of 5.8%. The rapid penetration of regular kitchen stoves using LPG fuel in emerging countries is notably driving the cookware market growth, although factors such as growing threat from the unorganized sector may impede market growth.
- The crystalware and glassware market size is expected to increase by USD 4.12 billion from 2021 to 2026, and the market's growth momentum will accelerate at a CAGR of 7.95%. The launch of innovative products to gain consumer interest is notably driving the crystalware and glassware market growth, although factors such as the threat of procurement may impede the market growth.
Glass Tableware Market Scope | |
Report Coverage | Details |
Page number | 161 |
Base year | 2022 |
Historic period | 2017-2021 |
Forecast period | 2023-2027 |
Growth momentum & CAGR | Accelerate at a CAGR of 3.32% |
Market growth 2023-2027 | USD 1,493.77 million |
Market structure | Fragmented |
YoY growth 2022-2023(%) | 2.46 |
Regional analysis | APAC, Europe, North America, Middle East and Africa, and South America |
Performing market contribution | APAC at 54% |
Key countries | US, China, Japan, Germany, and France |
Competitive landscape | Leading Vendors, Market Positioning of Vendors, Competitive Strategies, and Industry Risks |
Key companies profiled | Anchor Hocking LLC, Anhui Deli Daily Glass Co. Ltd., arc online, Bormioli Rocco Spa, Cedar Glass SAE, Corelle Brands LLC, Glass Source GmbH, Inter IKEA Holding BV, Kavalierglass AS, Krosno Glass SA, LaOpala RG Pvt. Ltd., Lenox Corp., Libbey Inc., Ocean Glass Public Co. Ltd., PGP Glass Pvt. Ltd., Steelite International Ltd., Termisil Glass Sp z o o, TURKIYE SISE VE CAM FABRIKALARI AS, WMF Group GmbH, and Borosil Ltd. |
Market dynamics | Parent market analysis, market growth inducers and obstacles, fast-growing and slow-growing segment analysis, COVID-19 impact and recovery analysis and future consumer dynamics, and market condition analysis for the forecast period. |
Customization purview | If our report has not included the data that you are looking for, you can reach out to our analysts and get segments customized. |
Customization purview | If our report has not included the data that you are looking for, you can reach out to our analysts and get segments customized. |
1 Executive Summary
- 1.1 Market overview
- Exhibit 01: Executive Summary – Chart on Market Overview
- Exhibit 02: Executive Summary – Data Table on Market Overview
- Exhibit 03: Executive Summary – Chart on Global Market Characteristics
- Exhibit 04: Executive Summary – Chart on Market by Geography
- Exhibit 05: Executive Summary – Chart on Market Segmentation by Product
- Exhibit 06: Executive Summary – Chart on Market Segmentation by Distribution Channel
- Exhibit 07: Executive Summary – Chart on Incremental Growth
- Exhibit 08: Executive Summary – Data Table on Incremental Growth
- Exhibit 09: Executive Summary – Chart on Vendor Market Positioning
2 Market Landscape
- 2.1 Market ecosystem
- Exhibit 10: Parent market
- Exhibit 11: Market Characteristics
3 Market Sizing
- 3.1 Market definition
- Exhibit 12: Offerings of vendors included in the market definition
- 3.2 Market segment analysis
- Exhibit 13: Market segments
- 3.3 Market size 2022
- 3.4 Market outlook: Forecast for 2022-2027
- Exhibit 14: Chart on Global - Market size and forecast 2022-2027 ($ million)
- Exhibit 15: Data Table on Global - Market size and forecast 2022-2027 ($ million)
- Exhibit 16: Chart on Global Market: Year-over-year growth 2022-2027 (%)
- Exhibit 17: Data Table on Global Market: Year-over-year growth 2022-2027 (%)
4 Historic Market Size
- 4.1 Global glass tableware market 2017 - 2021
- Exhibit 18: Historic Market Size – Data Table on Global glass tableware market 2017 - 2021 ($ million)
- 4.2 Product Segment Analysis 2017 - 2021
- Exhibit 19: Historic Market Size – Product Segment 2017 - 2021 ($ million)
- 4.3 Distribution channel Segment Analysis 2017 - 2021
- Exhibit 20: Historic Market Size – Distribution channel Segment 2017 - 2021 ($ million)
- 4.4 Geography Segment Analysis 2017 - 2021
- Exhibit 21: Historic Market Size – Geography Segment 2017 - 2021 ($ million)
- 4.5 Country Segment Analysis 2017 - 2021
- Exhibit 22: Historic Market Size – Country Segment 2017 - 2021 ($ million)
5 Five Forces Analysis
- 5.1 Five forces summary
- Exhibit 23: Five forces analysis - Comparison between 2022 and 2027
- 5.2 Bargaining power of buyers
- Exhibit 24: Chart on Bargaining power of buyers – Impact of key factors 2022 and 2027
- 5.3 Bargaining power of suppliers
- Exhibit 25: Bargaining power of suppliers – Impact of key factors in 2022 and 2027
- 5.4 Threat of new entrants
- Exhibit 26: Threat of new entrants – Impact of key factors in 2022 and 2027
- 5.5 Threat of substitutes
- Exhibit 27: Threat of substitutes – Impact of key factors in 2022 and 2027
- 5.6 Threat of rivalry
- Exhibit 28: Threat of rivalry – Impact of key factors in 2022 and 2027
- 5.7 Market condition
- Exhibit 29: Chart on Market condition - Five forces 2022 and 2027
6 Market Segmentation by Product
- 6.1 Market segments
- Exhibit 30: Chart on Product - Market share 2022-2027 (%)
- Exhibit 31: Data Table on Product - Market share 2022-2027 (%)
- 6.2 Comparison by Product
- Exhibit 32: Chart on Comparison by Product
- Exhibit 33: Data Table on Comparison by Product
- 6.3 Dinnerware - Market size and forecast 2022-2027
- Exhibit 34: Chart on Dinnerware - Market size and forecast 2022-2027 ($ million)
- Exhibit 35: Data Table on Dinnerware - Market size and forecast 2022-2027 ($ million)
- Exhibit 36: Chart on Dinnerware - Year-over-year growth 2022-2027 (%)
- Exhibit 37: Data Table on Dinnerware - Year-over-year growth 2022-2027 (%)
- 6.4 Beverageware - Market size and forecast 2022-2027
- Exhibit 38: Chart on Beverageware - Market size and forecast 2022-2027 ($ million)
- Exhibit 39: Data Table on Beverageware - Market size and forecast 2022-2027 ($ million)
- Exhibit 40: Chart on Beverageware - Year-over-year growth 2022-2027 (%)
- Exhibit 41: Data Table on Beverageware - Year-over-year growth 2022-2027 (%)
- 6.5 Others - Market size and forecast 2022-2027
- Exhibit 42: Chart on Others - Market size and forecast 2022-2027 ($ million)
- Exhibit 43: Data Table on Others - Market size and forecast 2022-2027 ($ million)
- Exhibit 44: Chart on Others - Year-over-year growth 2022-2027 (%)
- Exhibit 45: Data Table on Others - Year-over-year growth 2022-2027 (%)
- 6.6 Market opportunity by Product
- Exhibit 46: Market opportunity by Product ($ million)
7 Market Segmentation by Distribution Channel
- 7.1 Market segments
- Exhibit 47: Chart on Distribution Channel - Market share 2022-2027 (%)
- Exhibit 48: Data Table on Distribution Channel - Market share 2022-2027 (%)
- 7.2 Comparison by Distribution Channel
- Exhibit 49: Chart on Comparison by Distribution Channel
- Exhibit 50: Data Table on Comparison by Distribution Channel
- 7.3 Offline - Market size and forecast 2022-2027
- Exhibit 51: Chart on Offline - Market size and forecast 2022-2027 ($ million)
- Exhibit 52: Data Table on Offline - Market size and forecast 2022-2027 ($ million)
- Exhibit 53: Chart on Offline - Year-over-year growth 2022-2027 (%)
- Exhibit 54: Data Table on Offline - Year-over-year growth 2022-2027 (%)
- 7.4 Online - Market size and forecast 2022-2027
- Exhibit 55: Chart on Online - Market size and forecast 2022-2027 ($ million)
- Exhibit 56: Data Table on Online - Market size and forecast 2022-2027 ($ million)
- Exhibit 57: Chart on Online - Year-over-year growth 2022-2027 (%)
- Exhibit 58: Data Table on Online - Year-over-year growth 2022-2027 (%)
- 7.5 Market opportunity by Distribution Channel
- Exhibit 59: Market opportunity by Distribution Channel ($ million)
8 Customer Landscape
- 8.1 Customer landscape overview
- Exhibit 60: Analysis of price sensitivity, lifecycle, customer purchase basket, adoption rates, and purchase criteria
9 Geographic Landscape
- 9.1 Geographic segmentation
- Exhibit 61: Chart on Market share by geography 2022-2027 (%)
- Exhibit 62: Data Table on Market share by geography 2022-2027 (%)
- 9.2 Geographic comparison
- Exhibit 63: Chart on Geographic comparison
- Exhibit 64: Data Table on Geographic comparison
- 9.3 APAC - Market size and forecast 2022-2027
- Exhibit 65: Chart on APAC - Market size and forecast 2022-2027 ($ million)
- Exhibit 66: Data Table on APAC - Market size and forecast 2022-2027 ($ million)
- Exhibit 67: Chart on APAC - Year-over-year growth 2022-2027 (%)
- Exhibit 68: Data Table on APAC - Year-over-year growth 2022-2027 (%)
- 9.4 Europe - Market size and forecast 2022-2027
- Exhibit 69: Chart on Europe - Market size and forecast 2022-2027 ($ million)
- Exhibit 70: Data Table on Europe - Market size and forecast 2022-2027 ($ million)
- Exhibit 71: Chart on Europe - Year-over-year growth 2022-2027 (%)
- Exhibit 72: Data Table on Europe - Year-over-year growth 2022-2027 (%)
- 9.5 North America - Market size and forecast 2022-2027
- Exhibit 73: Chart on North America - Market size and forecast 2022-2027 ($ million)
- Exhibit 74: Data Table on North America - Market size and forecast 2022-2027 ($ million)
- Exhibit 75: Chart on North America - Year-over-year growth 2022-2027 (%)
- Exhibit 76: Data Table on North America - Year-over-year growth 2022-2027 (%)
- 9.6 Middle East and Africa - Market size and forecast 2022-2027
- Exhibit 77: Chart on Middle East and Africa - Market size and forecast 2022-2027 ($ million)
- Exhibit 78: Data Table on Middle East and Africa - Market size and forecast 2022-2027 ($ million)
- Exhibit 79: Chart on Middle East and Africa - Year-over-year growth 2022-2027 (%)
- Exhibit 80: Data Table on Middle East and Africa - Year-over-year growth 2022-2027 (%)
- 9.7 South America - Market size and forecast 2022-2027
- Exhibit 81: Chart on South America - Market size and forecast 2022-2027 ($ million)
- Exhibit 82: Data Table on South America - Market size and forecast 2022-2027 ($ million)
- Exhibit 83: Chart on South America - Year-over-year growth 2022-2027 (%)
- Exhibit 84: Data Table on South America - Year-over-year growth 2022-2027 (%)
- 9.8 China - Market size and forecast 2022-2027
- Exhibit 85: Chart on China - Market size and forecast 2022-2027 ($ million)
- Exhibit 86: Data Table on China - Market size and forecast 2022-2027 ($ million)
- Exhibit 87: Chart on China - Year-over-year growth 2022-2027 (%)
- Exhibit 88: Data Table on China - Year-over-year growth 2022-2027 (%)
- 9.9 US - Market size and forecast 2022-2027
- Exhibit 89: Chart on US - Market size and forecast 2022-2027 ($ million)
- Exhibit 90: Data Table on US - Market size and forecast 2022-2027 ($ million)
- Exhibit 91: Chart on US - Year-over-year growth 2022-2027 (%)
- Exhibit 92: Data Table on US - Year-over-year growth 2022-2027 (%)
- 9.10 Germany - Market size and forecast 2022-2027
- Exhibit 93: Chart on Germany - Market size and forecast 2022-2027 ($ million)
- Exhibit 94: Data Table on Germany - Market size and forecast 2022-2027 ($ million)
- Exhibit 95: Chart on Germany - Year-over-year growth 2022-2027 (%)
- Exhibit 96: Data Table on Germany - Year-over-year growth 2022-2027 (%)
- 9.11 Japan - Market size and forecast 2022-2027
- Exhibit 97: Chart on Japan - Market size and forecast 2022-2027 ($ million)
- Exhibit 98: Data Table on Japan - Market size and forecast 2022-2027 ($ million)
- Exhibit 99: Chart on Japan - Year-over-year growth 2022-2027 (%)
- Exhibit 100: Data Table on Japan - Year-over-year growth 2022-2027 (%)
- 9.12 France - Market size and forecast 2022-2027
- Exhibit 101: Chart on France - Market size and forecast 2022-2027 ($ million)
- Exhibit 102: Data Table on France - Market size and forecast 2022-2027 ($ million)
- Exhibit 103: Chart on France - Year-over-year growth 2022-2027 (%)
- Exhibit 104: Data Table on France - Year-over-year growth 2022-2027 (%)
- 9.13 Market opportunity by geography
- Exhibit 105: Market opportunity by geography ($ million)
10 Drivers, Challenges, and Trends
- 10.1 Market drivers
- 10.2 Market challenges
- 10.3 Impact of drivers and challenges
- Exhibit 106: Impact of drivers and challenges in 2022 and 2027
- 10.4 Market trends
11 Vendor Landscape
- 11.1 Overview
- 11.2 Vendor landscape
- Exhibit 107: Overview on Criticality of inputs and Factors of differentiation
- 11.3 Landscape disruption
- Exhibit 108: Overview on factors of disruption
- 11.4 Industry risks
- Exhibit 109: Impact of key risks on business
12 Vendor Analysis
- 12.1 Vendors covered
- Exhibit 110: Vendors covered
- 12.2 Market positioning of vendors
- Exhibit 111: Matrix on vendor position and classification
- 12.3 Anchor Hocking LLC
- Exhibit 112: Anchor Hocking LLC - Overview
- Exhibit 113: Anchor Hocking LLC - Product / Service
- Exhibit 114: Anchor Hocking LLC - Key offerings
- 12.4 Anhui Deli Daily Glass Co. Ltd.
- Exhibit 115: Anhui Deli Daily Glass Co. Ltd. - Overview
- Exhibit 116: Anhui Deli Daily Glass Co. Ltd. - Product / Service
- Exhibit 117: Anhui Deli Daily Glass Co. Ltd. - Key offerings
- 12.5 arc online
- Exhibit 118: arc online - Overview
- Exhibit 119: arc online - Product / Service
- Exhibit 120: arc online - Key offerings
- 12.6 Bormioli Rocco Spa
- Exhibit 121: Bormioli Rocco Spa - Overview
- Exhibit 122: Bormioli Rocco Spa - Product / Service
- Exhibit 123: Bormioli Rocco Spa - Key offerings
- 12.7 Borosil Ltd.
- Exhibit 124: Borosil Ltd. - Overview
- Exhibit 125: Borosil Ltd. - Business segments
- Exhibit 126: Borosil Ltd. - Key offerings
- Exhibit 127: Borosil Ltd. - Segment focus
- 12.8 Cedar Glass SAE
- Exhibit 128: Cedar Glass SAE - Overview
- Exhibit 129: Cedar Glass SAE - Product / Service
- Exhibit 130: Cedar Glass SAE - Key offerings
- 12.9 Corelle Brands LLC
- Exhibit 131: Corelle Brands LLC - Overview
- Exhibit 132: Corelle Brands LLC - Product / Service
- Exhibit 133: Corelle Brands LLC - Key offerings
- 12.10 Glass Source GmbH
- Exhibit 134: Glass Source GmbH - Overview
- Exhibit 135: Glass Source GmbH - Product / Service
- Exhibit 136: Glass Source GmbH - Key offerings
- 12.11 Inter IKEA Holding BV
- Exhibit 137: Inter IKEA Holding BV - Overview
- Exhibit 138: Inter IKEA Holding BV - Product / Service
- Exhibit 139: Inter IKEA Holding BV - Key news
- Exhibit 140: Inter IKEA Holding BV - Key offerings
- 12.12 Kavalierglass AS
- Exhibit 141: Kavalierglass AS - Overview
- Exhibit 142: Kavalierglass AS - Product / Service
- Exhibit 143: Kavalierglass AS - Key offerings
- 12.13 Krosno Glass SA
- Exhibit 144: Krosno Glass SA - Overview
- Exhibit 145: Krosno Glass SA - Product / Service
- Exhibit 146: Krosno Glass SA - Key offerings
- 12.14 LaOpala RG Pvt. Ltd.
- Exhibit 147: LaOpala RG Pvt. Ltd. - Overview
- Exhibit 148: LaOpala RG Pvt. Ltd. - Product / Service
- Exhibit 149: LaOpala RG Pvt. Ltd. - Key offerings
- 12.15 Lenox Corp.
- Exhibit 150: Lenox Corp. - Overview
- Exhibit 151: Lenox Corp. - Product / Service
- Exhibit 152: Lenox Corp. - Key offerings
- 12.16 Libbey Inc.
- Exhibit 153: Libbey Inc. - Overview
- Exhibit 154: Libbey Inc. - Business segments
- Exhibit 155: Libbey Inc. - Key offerings
- Exhibit 156: Libbey Inc. - Segment focus
- 12.17 Ocean Glass Public Co. Ltd.
- Exhibit 157: Ocean Glass Public Co. Ltd. - Overview
- Exhibit 158: Ocean Glass Public Co. Ltd. - Business segments
- Exhibit 159: Ocean Glass Public Co. Ltd. - Key offerings
- Exhibit 160: Ocean Glass Public Co. Ltd. - Segment focus
13 Appendix
- 13.1 Scope of the report
- 13.2 Inclusions and exclusions checklist
- Exhibit 161: Inclusions checklist
- Exhibit 162: Exclusions checklist
- 13.3 Currency conversion rates for US$
- Exhibit 163: Currency conversion rates for US$
- 13.4 Research methodology
- Exhibit 164: Research methodology
- Exhibit 165: Validation techniques employed for market sizing
- Exhibit 166: Information sources
- 13.5 List of abbreviations
- Exhibit 167: List of abbreviations
Technavio is a leading global technology research and advisory company. Their research and analysis focus on emerging market trends and provides actionable insights to help businesses identify market opportunities and develop effective strategies to optimize their market positions. With over 500 specialized analysts, Technavio's report library consists of more than 17,000 reports and counting, covering 800 technologies, spanning across 50 countries. Their client base consists of enterprises of all sizes, including more than 100 Fortune 500 companies. This growing client base relies on Technavio's comprehensive coverage, extensive research, and actionable market insights to identify opportunities in existing and potential markets and assess their competitive positions within changing market scenarios.
Technavio Research
Jesse Maida
Media & Marketing Executive
US: +1 844 364 1100
UK: +44 203 893 3200
Email: media@technavio.com
Website: www.technavio.com/

View original content to download multimedia:https://www.prnewswire.com/news-releases/glass-tableware-market-to-grow-by-usd-1-493-77-mn-household-products-market-is-the-parent-market--technavio-301700341.html
SOURCE Technavio
Uncategorized
Women’s basketball is gaining ground, but is March Madness ready to rival the men’s game?
The hype around Caitlin Clark, NCAA Women’s Basketball is unprecedented — but can its March Madness finally rival the Men’s?
Share this:


In March 2021, the world was struggling to find its legs amid the ongoing Covid-19 pandemic. Sports leagues were trying their best to keep going.
It started with the NBA creating a bubble in Orlando in late 2020, playing a full postseason in the confines of Disney World in arenas that were converted into gyms devoid of fans. Other leagues eventually allowed for limited capacity seating in stadiums, including the NCAA for its Men’s and Women’s Basketball tournaments.
The two tournaments were confined to two cities that year — instead of games normally played in different regions around the country: Indianapolis for the men and San Antonio for the women.
But a glaring difference between the men’s and women’s facilities was exposed by Oregon’s Sedona Prince on social media. The workout and practice area for the men was significantly larger than the women, whose weight room was just a single stack of dumbbells.
Let me put it on Twitter too cause this needs the attention pic.twitter.com/t0DWKL2YHR
— SEDONA (@sedonaprince_) March 19, 2021
The video drew significant attention to the equity gaps between the Men’s and Women’s divisions, leading to a 114-page report by a civil rights law firm that detailed the inequities between the two and suggested ways to improve the NCAA’s efforts for the Women’s side. One of these suggestions was simply to give the Women’s Tournament the same March Madness moniker as the men, which it finally got in 2022.
But underneath the surface of these institutional changes, women’s basketball’s single-biggest success driver was already emerging out of the shadows.
During the same COVID-marred season, a rookie from Iowa led the league in scoring with 26.6 points per game.
Her name: Caitlin Clark.
As it stands today, Clark is the leading scorer in the history of college basketball — Men’s or Women’s. Her jaw-dropping shooting ability has fueled record viewership and ticket sales for Women’s collegiate games, carrying momentum to the March Madness tournament that has NBA legends like Kevin Garnett and Paul Pierce more excited for the Women’s March Madness than the Men’s this year.
Related: Ticket prices for Caitlin Clark's final college home game are insanely high
But as the NCAA tries to bridge the opportunities given to the two sides, can the hype around Clark be enough for the Women’s March Madness to bring in the same fandom as the Men for the 2024 tournaments?
TheStreet spoke with Jon Lewis of Sports Media Watch, who has been following sports viewership trends for the last two decades; Melissa Isaacson, a veteran sports journalist and longtime advocate of women’s basketball; and Pete Giorgio, Deloitte’s leader for Global and US Sports to dissect the rise Caitlin Clark and women’s collegiate hoops ahead of March Madness.
“Nobody is moving the needle like Caitlin Clark,” Lewis told TheStreet. “Nobody else in sports, period, right now, is fueling record numbers on all these different networks, driving viewership beyond what the norm has been for 20 years."
The Caitlin Clark Effect is real — but there are other reasons for the success of women's basketball
The game in which Clark broke the all-time college scoring record against Ohio State on Sunday, Mar. 3 was seen by an average of 3.4 million viewers on Fox, marking the first time a women’s game broke the two million viewership barrier since 2010. Viewership for that game came in just behind the men’s game between Michigan State vs Arizona game on Thanksgiving, which Lewis said was driven by NFL viewership on the same day.
A week later, Iowa’s Big Ten Championship win over Nebraska breached the three million viewers mark as well, and the team has also seen viewership numbers crack over 1.5 million viewers multiple times throughout the regular season.
The success on television has also translated to higher ticket prices, as tickets to watch Clark at home and on the road have breached hundreds of dollars and drawn long lines outside stadiums. Isaacson, who is a professor at Northwestern, said she went to the game between the Hawkeyes and Northwestern Wildcats — which was the first sellout in school history for the team — and witnessed the effect of Clark in person.
“Standing in line interviewing people at the Northwestern game, seeing men who've never been to a women's game with their little girls watching and so excited, and seeing Caitlin and her engaging with little girls, it’s just been really fun,” Isaacson said.
But while Clark is certainly the biggest success driver, her game isn’t the only thing pulling up the women’s side. The three-point revolution, which started in the NBA with the introduction of deeper analytics as well as the rise of stars like Steph Curry, has been a positive for the Women’s game.
“They backed up to the three-point line and it’s opening up the game,” Isaacson said.
One of the major criticisms from a lot of women’s hoops detractors has been how the game does not compare in terms of quality to the men. However, shooting has become a great equalizer, displayed recently during the 2024 NBA All-Star Weekend last month when the WNBA’s Sabrina Ionescu nearly defeated Curry — who is widely considered the greatest shooter ever — in a three-point contest.
Clark has become the embodiment of the three-point revolution for the women. Her shooting displays have demanded the respect of anyone who has doubted women’s basketball in the past because being a man simply doesn’t grant someone the ability to shoot long-distance bombs the way she can.
Basketball pundit Bill Simmons admitted on a Feb. 28 episode of “The Bill Simmons Podcast” that he used to not want to watch women’s basketball because he didn’t enjoy watching the product, but finds himself following the women’s game this year more than the men’s side in large part due to Clark.
“I think she has the chance to be the most fun basketball player, male or female, when she gets to the pros,” Simmons said. “If she’s going to make the same 30-footers, routinely. It’s basically all the same Curry stuff just with a female … I would like watching her play in any format.”
But while Clark is driving up the numbers at the top, she’s not the only one carrying the greatness of the product. Lewis, Isaacson, Giorgio — and even Simmons, on his podcast — agreed that there are several other names and collegiate programs pulling in fans.
“It’s not just Iowa, it’s not just Caitlin Clark, it’s all of these teams,” Giorgio said. “Part of it is Angel Reese … coaches like Dawn Staley in South Carolina … You’ve got great stories left and right.”

The viewership showed that as well because the SEC Championship game between the LSU Tigers and University of South Carolina Gamecocks on Sunday, Mar. 10 averaged two million viewers.
Bridging the gap between the Men’s and Women’s March Madness viewership
The first reason women are catching up to the men is really star power. While the Women’s division has names like Clark and Reese, there just aren’t any names on the Men’s side this year that carry the same weight.
Garnett said on his show that he can’t name any men’s college basketball players, while on the women’s side, he could easily throw out the likes of Clark, Reese, UConn’s Paige Bueckers, and USC’s JuJu Watkins. Lewis felt the same.
Kevin Garnett energy towards WBB is unmatched. Sorry for the language but that’s how he talks. Just watch. pic.twitter.com/0yGBRGaF3O
— The9450 Podcast Network (@The9450) March 8, 2024
“The stars in the men's game, with one and done, I genuinely couldn't give you a single name of a single men’s player,” Lewis said.
A major reason for this is that the Women’s side has the continuity that the Men’s side does not. The rules of the NBA allow for players to play just one year in college — or even play a year professionally elsewhere — before entering the draft, while the WNBA requires players to be 22-years-old during the year of the draft to be eligible.
“You know the stars in the women's game because they stay longer,” Lewis said. “[In the men’s game], the programs are the stars … In the women's game, it's a lot more like the NBA where the players are the stars.”
Parity is also a massive factor on both sides. The women’s game used to be dominated by a few schools like UConn and Notre Dame. Nowadays, between LSU, Iowa, University of South Carolina, Stanford, and UConn, there are a handful of schools that have a shot to win the entire tournament. While this is more exciting for fans, the talent in the women's game isn’t deep enough, so too many upsets are unlikely. Many of the biggest draws are still expected to make deep runs.
But on the men’s side, there is a bigger shot that the smaller programs make it to the end — which is what was seen last year. UConn eventually won the whole thing, but schools without as big of a national fanbase in San Diego State, Florida Atlantic University, and the University Miami rounded out the Final Four.
“People want to see one Cinderella,” Lewis said. “They don't want to see two and three, they want one team that isn't supposed to be there.”
Is Women's March Madness ready to overtake the Men?
Social media might feel like it’s giving more traction to the Women’s game, but experts don’t necessarily expect that to show up in the viewership numbers just yet.
“There’s certainly a lot more buzz than there used to be,” Giorgio said. “It’s been growing every year for not just the past few years but for 10 years, but it’s hard to compare it versus Men’s.”
But the gap continues to get smaller and smaller between the two sides, and this year's tournament could bridge that gap even further.
One indicator is ticket prices. For the NCAA Tournament Final Four in April, “get-in” ticket prices are currently more expensive for the Women’s game than the Men’s game, according to TickPick. The ticketing site also projects that the Women’s Final Four and Championship game ticket prices will smash any previous records for the Women’s side should Clark and the Hawkeyes make a run to the end.

Getty Images/TheStreet
The caveat is that the Women’s Final Four is played in a stadium that has less than a third of the seating capacity of the Men’s Final Four. That’s why the average ticket prices are still more expensive for the men, although the gap is a lot smaller this year than in previous years.

But that caveat pretty much sums up where the women’s game currently stands versus the men’s: There is still a significant gap between the distribution and availability of the former.
While Iowa’s regular season games have garnered millions of viewers, the majority of the most-viewed games are still Men’s contests.
To illustrate the gap between the men’s and women’s game — last year’s Women’s Championship game that saw the LSU Tigers defeat the Hawkeyes was a record-breaking one for the women, drawing an average of 9.9 million viewers, more than double the viewership from the previous year.
One of the main reasons for that increase, as Lewis pointed out, is that last year’s Championship game was on ABC, which was the first time since 1995 that the Women’s Championship game was on broadcast television. The 1995 contest between UConn and Tennessee drew 7.4 million viewers.
The Men’s Championship actually had a record low in viewership last year garnering only 14.7 million viewers, driven in-part due to a lack of hype surrounding the schools that made it to the Final Four and Championship game. Viewership for the Men’s title game has been trending down in recent years — partly due to the effect the pandemic had on collective sports viewership — but the Men’s side had been easily breaching 20 million viewers for the game as recently as 2017.

Iowa's Big Ten Championship win on Sunday actually only averaged 6,000 fewer viewers than the iconic rivalry game between Duke and University of North Carolina Men’s Basketball the day prior. However, there is also the case that the Iowa game was played on broadcast TV (CBS) versus the Duke-UNC game airing on cable channel (ESPN).
So historical precedence makes it unlikely that we’ll see the women’s game match the men’s in terms of viewership as early as this year barring another massive viewership jump for the women and a lack of recovery for the Men’s side.
But ultimately, this shouldn’t be looked at as a down point for Women’s Basketball, according to Lewis. The Men’s side has built its viewership base for years, and the Women’s side is still growing. Even keeping pace with the Men’s viewership is already a great sign.
“The fact that these games have Caitlin Clark are even in the conversation with men's games, in terms of viewership is a huge deal,” Lewis said.
Related: Angel Reese makes bold statement for avoiding late game scuffle in championship game
recovery pandemic covid-19Uncategorized
One city held a mass passport-getting event
A New Orleans congressman organized a way for people to apply for their passports en masse.
Share this:


While the number of Americans who do not have a passport has dropped steadily from more than 80% in 1990 to just over 50% now, a lack of knowledge around passport requirements still keeps a significant portion of the population away from international travel.
Over the four years that passed since the start of covid-19, passport offices have also been dealing with significant backlog due to the high numbers of people who were looking to get a passport post-pandemic.
Related: Here is why it is (still) taking forever to get a passport
To deal with these concurrent issues, the U.S. State Department recently held a mass passport-getting event in the city of New Orleans. Called the "Passport Acceptance Event," the gathering was held at a local auditorium and invited residents of Louisiana’s 2nd Congressional District to complete a passport application on-site with the help of staff and government workers.
'Come apply for your passport, no appointment is required'
"Hey #LA02," Rep. Troy A. Carter Sr. (D-LA), whose office co-hosted the event alongside the city of New Orleans, wrote to his followers on Instagram (META) . "My office is providing passport services at our #PassportAcceptance event. Come apply for your passport, no appointment is required."
More Travel:
- A new travel term is taking over the internet (and reaching airlines and hotels)
- The 10 best airline stocks to buy now
- Airlines see a new kind of traveler at the front of the plane
The event was held on March 14 from 10 a.m. to 1 p.m. While it was designed for those who are already eligible for U.S. citizenship rather than as a way to help non-citizens with immigration questions, it helped those completing the application for the first time fill out forms and make sure they have the photographs and identity documents they need. The passport offices in New Orleans where one would normally have to bring already-completed forms have also been dealing with lines and would require one to book spots weeks in advance.
These are the countries with the highest-ranking passports in 2024
According to Carter Sr.'s communications team, those who submitted their passport application at the event also received expedited processing of two to three weeks (according to the State Department's website, times for regular processing are currently six to eight weeks).
While Carter Sr.'s office has not released the numbers of people who applied for a passport on March 14, photos from the event show that many took advantage of the opportunity to apply for a passport in a group setting and get expedited processing.
Every couple of months, a new ranking agency puts together a list of the most and least powerful passports in the world based on factors such as visa-free travel and opportunities for cross-border business.
In January, global citizenship and financial advisory firm Arton Capital identified United Arab Emirates as having the most powerful passport in 2024. While the United States topped the list of one such ranking in 2014, worsening relations with a number of countries as well as stricter immigration rules even as other countries have taken strides to create opportunities for investors and digital nomads caused the American passport to slip in recent years.
A UAE passport grants holders visa-free or visa-on-arrival access to 180 of the world’s 198 countries (this calculation includes disputed territories such as Kosovo and Western Sahara) while Americans currently have the same access to 151 countries.
stocks pandemic covid-19 grantsUncategorized
Fast-food chain closes restaurants after Chapter 11 bankruptcy
Several major fast-food chains recently have struggled to keep restaurants open.
Share this:


Competition in the fast-food space has been brutal as operators deal with inflation, consumers who are worried about the economy and their jobs and, in recent months, the falling cost of eating at home.
Add in that many fast-food chains took on more debt during the covid pandemic and that labor costs are rising, and you have a perfect storm of problems.
It's a situation where Restaurant Brands International (QSR) has suffered as much as any company.
Related: Wendy's menu drops a fan favorite item, adds something new
Three major Burger King franchise operators filed for bankruptcy in 2023, and the chain saw hundreds of stores close. It also saw multiple Popeyes franchisees move into bankruptcy, with dozens of locations closing.
RBI also stepped in and purchased one of its key franchisees.
"Carrols is the largest Burger King franchisee in the United States today, operating 1,022 Burger King restaurants in 23 states that generated approximately $1.8 billion of system sales during the 12 months ended Sept. 30, 2023," RBI said in a news release. Carrols also owns and operates 60 Popeyes restaurants in six states."
The multichain company made the move after two of its large franchisees, Premier Kings and Meridian, saw multiple locations not purchased when they reached auction after Chapter 11 bankruptcy filings. In that case, RBI bought select locations but allowed others to close.
Image source: Chen Jianli/Xinhua via Getty
Another fast-food chain faces bankruptcy problems
Bojangles may not be as big a name as Burger King or Popeye's, but it's a popular chain with more than 800 restaurants in eight states.
"Bojangles is a Carolina-born restaurant chain specializing in craveable Southern chicken, biscuits and tea made fresh daily from real recipes, and with a friendly smile," the chain says on its website. "Founded in 1977 as a single location in Charlotte, our beloved brand continues to grow nationwide."
Like RBI, Bojangles uses a franchise model, which makes it dependent on the financial health of its operators. The company ultimately saw all its Maryland locations close due to the financial situation of one of its franchisees.
Unlike. RBI, Bojangles is not public — it was taken private by Durational Capital Management LP and Jordan Co. in 2018 — which means the company does not disclose its financial information to the public.
That makes it hard to know whether overall softness for the brand contributed to the chain seeing its five Maryland locations after a Chapter 11 bankruptcy filing.
Bojangles has a messy bankruptcy situation
Even though the locations still appear on the Bojangles website, they have been shuttered since late 2023. The locations were operated by Salim Kakakhail and Yavir Akbar Durranni. The partners operated under a variety of LLCs, including ABS Network, according to local news channel WUSA9.
The station reported that the owners face a state investigation over complaints of wage theft and fraudulent W2s. In November Durranni and ABS Network filed for bankruptcy in New Jersey, WUSA9 reported.
"Not only do former employees say these men owe them money, WUSA9 learned the former owners owe the state, too, and have over $69,000 in back property taxes."
Former employees also say that the restaurant would regularly purchase fried chicken from Popeyes and Safeway when it ran out in their stores, the station reported.
Bojangles sent the station a comment on the situation.
"The franchisee is no longer in the Bojangles system," the company said. "However, it is important to note in your coverage that franchisees are independent business owners who are licensed to operate a brand but have autonomy over many aspects of their business, including hiring employees and payroll responsibilities."
Kakakhail and Durranni did not respond to multiple requests for comment from WUSA9.
bankruptcy pandemic

Key shipping company files for Chapter 11 bankruptcy


Women’s basketball is gaining ground, but is March Madness ready to rival the men’s game?


These Cities Have The Highest (And Lowest) Share Of Unaffordable Neighborhoods In 2024


Tight inventory and frustrated buyers challenge agents in Virginia


Industrial Production Increased 0.1% in February
Key shipping company files Chapter 11 bankruptcy


One city held a mass passport-getting event


Southwest and United Airlines have bad news for passengers


The hostility Black women face in higher education carries dire consequences


Simple blood test could predict risk of long-term COVID-19 lung problems
-

 Uncategorized3 weeks ago
All Of The Elements Are In Place For An Economic Crisis Of Staggering Proportions
-

 International1 week ago
EyePoint poaches medical chief from Apellis; Sandoz CFO, longtime BioNTech exec to retire
-

 Uncategorized4 weeks ago
California Counties Could Be Forced To Pay $300 Million To Cover COVID-Era Program
-

 Uncategorized3 weeks ago
Apparel Retailer Express Moving Toward Bankruptcy
-

 Uncategorized1 month ago
Industrial Production Decreased 0.1% in January
-

 International1 week ago
Walmart launches clever answer to Target’s new membership program
-

 Spread & Containment3 days ago
IFM’s Hat Trick and Reflections On Option-To-Buy M&A
-

 Uncategorized4 weeks ago
RFK Jr: The Wuhan Cover-Up & The Rise Of The Biowarfare-Industrial Complex