Uncategorized
First Community Corporation Announces Third Quarter Results and Cash Dividend
First Community Corporation Announces Third Quarter Results and Cash Dividend
PR Newswire
LEXINGTON, S.C., Oct. 19, 2022
Highlights for Third Quarter of 2022
Net income of $3.951 million, an increase of 26.2% on a linked quarter basis.Diluted EPS o…
Share this:

First Community Corporation Announces Third Quarter Results and Cash Dividend
PR Newswire
LEXINGTON, S.C., Oct. 19, 2022
Highlights for Third Quarter of 2022
- Net income of $3.951 million, an increase of 26.2% on a linked quarter basis.
- Diluted EPS of $0.52 per common share for the quarter and $1.39 year-to-date through September 30, 2022.
- Total loans increased during the third quarter by $33.9 million, an annualized growth rate of 14.7%.
- Cost of deposits were unchanged on a linked quarter basis at 0.09% for the third quarter of 2022.
- Margin expansion of 0.36% during the third quarter with net interest margin on a tax equivalent basis of 3.29%.
- Investment advisory line of business revenue of $1.053 million
- Strong credit quality metrics with non-performing assets (NPAs) ratio of 0.36%, past due ratio of 0.04% and net loan recovery excluding overdrafts of $88 thousand during the third quarter, with a year-to-date net recovery of $349 thousand.
- Cash dividend of $0.13 per common share, which is the 83rd consecutive quarter of cash dividends paid to common shareholders.
- Regulatory approval received for full-service office in Rock Hill, South Carolina
LEXINGTON, S.C., Oct. 19, 2022 /PRNewswire/ -- Today, First Community Corporation (Nasdaq: FCCO), the holding company for First Community Bank, reported net income for the third quarter of 2022 of $3.951 million as compared to $3.130 million in the second quarter of 2022 and $4.748 million in the third quarter of 2021. Diluted earnings per common share were $0.52 for the third quarter of 2022 as compared to $0.41 for the second quarter of 2022 and $0.63 for the third quarter of 2021. As a note, during the third quarter of 2021, the bank recognized $1.561 million in non-recurring PPP related fee income compared to $729 in the third quarter of 2022.
Year-to-date through September 30, 2022 net income was $10.570 million compared to $11.546 million during the first nine months of 2021. Diluted earnings per share for the first nine months of 2022 were $1.39, compared to $1.53 during the same time period in 2021. As a note, during the first nine months of 2021, the bank recognized $2.714 million in non-recurring PPP related fee income compared to $45 thousand in the first nine months of 2022.
Cash Dividend and Capital
The Board of Directors approved a cash dividend for the third quarter of 2022. The company will pay a $0.13 per share dividend to holders of the company's common stock. This dividend is payable November 15, 2022 to shareholders of record as of November 1, 2022. Mike Crapps, First Community President and CEO, commented, "Our entire board is pleased that our performance enables the company to continue its cash dividend for the 83rd consecutive quarter."
As previously announced, the Company's Board of Directors has approved a share repurchase plan that provides for the repurchase of up to 375,000 shares of its common stock, which represents approximately 5% of the Company's 7,572,517 shares outstanding on September 30, 2022. Under the repurchase plan, the Company may repurchase shares from time to time. No shares have been repurchased under this plan.
Each of the regulatory capital ratios for the bank exceed the well capitalized minimum levels currently required by regulatory statute. At September 30, 2022, the bank's regulatory capital ratios (Leverage, Tier I Risk Based and Total Risk Based) were 8.53%, 13.42%, and 14.49%, respectively. This compares to the same ratios as of September 30, 2021 of 8.56%, 13.58%, and 14.74%, respectively. As of September 30, 2022, the bank's Common Equity Tier I ratio was 13.42% compared to 13.58% at September 30, 2021. Further, the company's Tangible Common Equity to Tangible Assets (TCE) ratio was 6.03% as of September 30, 2022 compared to 8.00% as of September 30, 2021. It should be noted that while the TCE ratio declined during the third quarter by 9 basis points from 6.12% as of June 30, 2022 to this level of 6.03%, excluding the Accumulated Other Comprehensive Loss (AOCL), the ratio increased in the quarter from 7.59% as of June 30, 2022 to 7.90% as of September 30, 2022.
Further, while the Tangible Book Value (TBV) per share declined during the quarter from $13.50 per share as of June 30, 2022 to $13.03 per share as of September 30, 2022, excluding AOCL, TBV per share increased in the quarter from $17.00 per share as of June 30, 2022 to $17.43 per share as of September 30, 2022.
Asset Quality
Asset quality metrics remained strong as of September 30, 2022. The non-performing assets ratio for the third quarter was 0.36% of total assets and a total past due ratio of 0.04%. Net loan recoveries excluding overdrafts for the quarter were $88 thousand and the year-to-date through September 30, 2022 net recovery was $349 thousand. The ratio of classified loans plus OREO now stands at 4.9% of total bank regulatory risk-based capital as of September 30, 2022.
Balance Sheet
Total loans increased during the third quarter by $33.9 million which is an annualized growth rate of 14.7%. Commercial loan production was $70.5 million during the third quarter of 2022. First Community Bank President Ted Nissen noted, "The strong loan growth that we have experienced in 2022 continued through the third quarter. Year-to-date through September 30, 2022, we have experienced $86.5 million in loan growth which is a 13.4% annualized growth rate."
Total deposits were $1.436 billion at September 30, 2022 compared to $1.469 billion at June 30, 2022. Pure deposits, which are defined as total deposits less certificates of deposits, were $1.326 billion at September 30, 2022 compared to $1.349 billion at June 30, 2022. Securities sold under agreements to repurchase, which are related to customer cash management accounts or business sweep accounts, were $73.7 million at September 30, 2022, compared to $71.8 million at June 30, 2021. Costs of deposits were unchanged on a linked quarter basis at 0.09% in the third quarter of 2022. Cost of funds increased slightly on a linked quarter basis to 0.14% in the third quarter of 2022 from 0.12% in the second quarter of the year. Mr. Crapps commented, "A strength of our bank has been and continues to be our low-cost deposit base. We have been able to continue to manage our cost of deposits and costs of funds in the rapidly rising rate environment. During the third quarter, we did experience a slight contraction in our deposit base."
Revenue
Net Interest Income/Net Interest Margin
Net interest income increased $1.743 million or 15.8% to $12.794 million for the third quarter of 2022 compared to second quarter net interest income of $11.051 million. Year-over-year, net interest income increased $338 thousand or 2.7% from $12.456 million in the third quarter of 2021. In the third quarter of 2021, the Company recognized PPP fee income of $1.561 million. Third quarter net interest margin, on a tax equivalent basis, was 3.29% compared to net interest margin of 2.93% in the second quarter of the year. Margin expansion was primarily due to higher yields in the loan and investment portfolios and the lag in the increase in interest rates paid on interest bearing deposit accounts. In addition, interest income on variable rate collateralized mortgage obligations, primarily consisting of GNMA home equity conversion mortgages improved $449 thousand on a linked quarter basis from ($202) thousand in the second quarter of 2022 to $247 thousand in the third quarter of the year. There was an improvement and stabilization in prepayments and an increase in the coupons on these bonds due to higher market interest rates.
Non-Interest Income
Total non-interest income, excluding other non-recurring income, was $2.673 million in the third quarter of 2022 compared to $3.004 million in the second quarter of the year and $3.517 million in the third quarter of 2021. This decrease is primarily attributable to lower production and revenue in the bank's mortgage line of business.
Gain on sale revenues in the mortgage line of business were $290 thousand in the third quarter of 2022 compared to $481 thousand in the second quarter of the year and $1.147 million in the third quarter of 2021. Revenues in the investment advisory line of business were $1.053 million in the third quarter of 2022, compared to $1.195 million in the second quarter of 2022 and $1.040 million in the third quarter of 2021. Assets under management (AUM) were $529.5 million at September 30, 2022 compared to $524.3 million at June 30, 2022 and $650.9 million at December 31, 2021. Mr. Crapps commented, "Revenue in the mortgage line of business has been impacted by the headwinds of rising mortgage rates and low housing inventory. To help offset this impact, our bank began to market an Adjustable Rate Mortgage (ARM) loan product to provide borrowers with an alternative to fixed rate mortgage loans in the second quarter. As these loans are being held on our balance sheet, the result is additive to loan growth but results in less gain-on-sale fee revenue. During the third quarter, we have also increased focus on construction lending where demand has remained more constant. Although still strong, revenue in our financial planning and investment advisory line of business and related AUM have been affected by the stock market performance in the first nine months of the year."
Non-Interest Expense
Non-interest expense was $10.417 million in the third quarter of 2022, up $229 thousand over the second quarter of 2022. Other expense was $307 thousand higher in the third quarter of the year due to higher legal, professional, recruiting and consulting fees. Salaries and Benefits expense was $198 thousand higher due to expenses related to the acquisition of additional mortgage lenders in the third quarter, increased compensation levels for banking office employees implemented at the beginning of the third quarter and lower vacancy rates during the quarter. Marketing and Public Relations expenses were down $283 thousand in the third quarter due to a planned lighter media schedule during the summer months.
Other
During the third quarter of 2022, the Company received regulatory approval to open a full service banking office in Rock Hill, South Carolina. Earlier this year, the Company entered this market with the launch of a Loan Production Office. The full-service office is scheduled to open on October 20, 2022.
About First Community Corporation
First Community Corporation stock trades on The NASDAQ Capital Market under the symbol "FCCO" and is the holding company for First Community Bank, a local community bank based in the Midlands of South Carolina. First Community Bank is a full-service commercial bank offering deposit and loan products and services, residential mortgage lending and financial planning/investment advisory services for businesses and consumers. First Community serves customers in the Midlands, Aiken, Upstate and Piedmont Regions of South Carolina as well as Augusta, Georgia. For more information, visit www.firstcommunitysc.com.
FORWARD-LOOKING STATEMENTS
This news release and certain statements by our management may contain "forward-looking statements" within the meaning of the Private Securities Litigation Reform Act of 1995, such as statements relating to future plans, goals, projections and expectations, and are thus prospective. Forward looking statements can be identified by words such as "anticipate", "expects", "intends", "believes", "may", "likely", "will", "plans" or other statements that indicate future periods. Such forward-looking statements are subject to risks, uncertainties, and other factors which could cause actual results to differ materially from future results expressed or implied by such forward-looking statements. Such risks, uncertainties and other factors, include, among others, the following: (1) competitive pressures among depository and other financial institutions may increase significantly and have an effect on pricing, spending, third-party relationships and revenues; (2) the strength of the United States economy in general and the strength of the local economies in which we conduct operations may be different than expected including, but not limited to, due to the negative impacts and disruptions resulting from the outbreak of the novel coronavirus, or COVID-19, on the economies and communities we serve, which has had and may continue to have an adverse impact on our business, operations, and performance, and could continue to have a negative impact on our credit portfolio, share price, borrowers, and on the economy as a whole both domestically and globally; (3) the rate of delinquencies and amounts of charge-offs, the level of allowance for loan loss, the rates of loan growth, or adverse changes in asset quality in our loan portfolio, which may result in increased credit risk-related losses and expenses; (4) changes in legislation, regulation, policies or administrative practices, whether by judicial, governmental, or legislative action, (5) adverse conditions in the stock market, the public debt markets and other capital markets (including changes in interest rate conditions) could continue to have a negative impact on the company; (6) technology and cybersecurity risks, including potential business disruptions, reputational risks, and financial losses, associated with potential attacks on or failures by our computer systems and computer systems of our vendors and other third parties; and (7) risks, uncertainties and other factors disclosed in our most recent Annual Report on Form 10-K filed with the SEC, or in any of our Quarterly Reports on Form 10-Q or Current Reports on Form 8-K filed with the SEC since the end of the fiscal year covered by our most recently filed Annual Report on Form 10-K, which are available at the SEC's Internet site (http://www.sec.gov).
Although we believe that the assumptions underlying the forward-looking statements are reasonable, any of the assumptions could prove to be inaccurate. We can give no assurance that the results contemplated in the forward-looking statements will be realized. The inclusion of this forward-looking information should not be construed as a representation by our company or any person that the future events, plans, or expectations contemplated by our company will be achieved. We undertake no obligation to publicly update or revise any forward-looking statements, whether as a result of new information, future events, or otherwise, except as required by law.
FIRST COMMUNITY CORPORATION | ||||||
BALANCE SHEET DATA | ||||||
(Dollars in thousands, except per share data) | ||||||
As of | ||||||
September 30, | June 30, | March 31, | December 31, | September 30, | ||
2022 | 2022 | 2022 | 2021 | 2021 | ||
Total Assets | $ 1,651,829 | $ 1,684,824 | $ 1,652,279 | $ 1,584,508 | $ 1,560,326 | |
Other Short-term Investments and CD's1 | 17,244 | 76,918 | 68,169 | 47,049 | 55,259 | |
Investment Securities | ||||||
Investments Held-to-Maturity | 233,301 | 233,730 | - | - | - | |
Investments Available-for-Sale | 338,350 | 337,254 | 577,820 | 564,839 | 513,500 | |
Other Investments at Cost | 1,929 | 1,929 | 1,879 | 1,785 | 1,760 | |
Total Investment Securities | 573,580 | 572,913 | 579,699 | 566,624 | 515,260 | |
Loans Held for Sale | 1,758 | 4,533 | 12,095 | 7,120 | 6,213 | |
Loans | ||||||
Paycheck Protection Program (PPP) Loans | 238 | 250 | 269 | 1,467 | 9,109 | |
Non-PPP Loans | 949,972 | 916,082 | 875,528 | 862,235 | 872,411 | |
Total Loans | 950,210 | 916,332 | 875,797 | 863,702 | 881,520 | |
Allowance for Loan Losses | 11,315 | 11,220 | 11,063 | 11,179 | 11,025 | |
Goodwill | 14,637 | 14,637 | 14,637 | 14,637 | 14,637 | |
Other Intangibles | 801 | 840 | 879 | 919 | 959 | |
Total Deposits | 1,436,256 | 1,468,975 | 1,430,748 | 1,361,291 | 1,333,568 | |
Securities Sold Under Agreements to Repurchase | 73,659 | 71,800 | 68,060 | 54,216 | 59,821 | |
Federal Home Loan Bank Advances | - | - | - | - | - | |
Junior Subordinated Debt | 14,964 | 14,964 | 14,964 | 14,964 | 14,964 | |
Shareholders' Equity | 114,145 | 117,592 | 125,380 | 140,998 | 139,113 | |
Book Value Per Common Share | 15.07 | $ 15.54 | $ 16.59 | $ 18.68 | $ 18.44 | |
Tangible Book Value Per Common Share | 13.03 | $ 13.50 | $ 14.53 | $ 16.62 | $ 16.37 | |
Tangible Book Value Per Common Share excluding Accumulated Other | 17.43 | $ 17.00 | $ 16.52 | $ 16.18 | $ 15.76 | |
Comprehensive Income (Loss) | ||||||
Equity to Assets | 6.91 % | 6.98 % | 7.59 % | 8.90 % | 8.92 % | |
Tangible Common Equity to Tangible Assets (TCE Ratio) | 6.03 % | 6.12 % | 6.71 % | 8.00 % | 8.00 % | |
TCE Ratio excluding Accumulated Other Comprehensive Income (Loss) | 7.90 % | 7.59 % | 7.56 % | 7.80 % | 7.72 % | |
Loan to Deposit Ratio (Includes Loans Held for Sale) | 66.28 % | 62.69 % | 62.06 % | 63.97 % | 66.57 % | |
Loan to Deposit Ratio (Excludes Loans Held for Sale) | 66.16 % | 62.38 % | 61.21 % | 63.45 % | 66.10 % | |
Allowance for Loan Losses/Loans | 1.19 % | 1.22 % | 1.26 % | 1.29 % | 1.25 % | |
Regulatory Capital Ratios (Bank): | ||||||
Leverage Ratio | 8.53 % | 8.34 % | 8.43 % | 8.45 % | 8.56 % | |
Tier 1 Capital Ratio | 13.42 % | 13.47 % | 13.89 % | 13.97 % | 13.58 % | |
Total Capital Ratio | 14.49 % | 14.57 % | 15.03 % | 15.15 % | 14.74 % | |
Common Equity Tier 1 Capital Ratio | 13.42 % | 13.47 % | 13.89 % | 13.97 % | 13.58 % | |
Tier 1 Regulatory Capital | $ 142,305 | $ 137,910 | $ 135,555 | $ 132,918 | $ 129,741 | |
Total Regulatory Capital | $ 153,620 | $ 149,130 | $ 146,618 | $ 144,097 | $ 140,766 | |
Common Equity Tier 1 Capital | $ 142,305 | $ 137,910 | $ 135,555 | $ 132,918 | $ 129,741 | |
1 Includes federal funds sold and interest-bearing deposits | ||||||
Average Balances: | Three months ended | Nine months ended | ||||
September 30, | September 30, | |||||
2022 | 2021 | 2022 | 2021 | |||
Average Total Assets | $ 1,667,737 | $ 1,542,820 | $ 1,644,803 | $ 1,495,657 | ||
Average Loans (Includes Loans Held for Sale) | 938,318 | 893,888 | 903,989 | 891,987 | ||
Average Investment Securities | 581,044 | 488,526 | 571,131 | 431,332 | ||
Average Short-term Investments and CDs | 37,529 | 58,547 | 59,071 | 71,804 | ||
Average Earning Assets | 1,556,891 | 1,440,961 | 1,534,191 | 1,395,123 | ||
Average Deposits | 1,449,951 | 1,312,565 | 1,417,855 | 1,268,965 | ||
Average Other Borrowings | 86,602 | 77,840 | 90,361 | 77,179 | ||
Average Shareholders' Equity | 119,001 | 140,404 | 124,038 | 137,087 | ||
Asset Quality: | As of | |||||
September 30, | June 30, | March 31, | December 31, | September 30, | ||
2022 | 2022 | 2022 | 2021 | 2021 | ||
Loan Risk Rating by Category (End of Period) | ||||||
Special Mention | $ 596 | $ 684 | $ 1,668 | $ 1,626 | $ 2,851 | |
Substandard | 6,539 | 6,710 | 7,849 | 7,872 | 7,992 | |
Doubtful | - | - | - | - | - | |
Pass | 943,075 | 908,938 | 866,280 | 854,204 | 870,677 | |
$ 950,210 | $ 916,332 | $ 875,797 | $ 863,702 | $ 881,520 | ||
Nonperforming Assets | ||||||
Non-accrual Loans | $ 4,875 | $ 4,351 | $ 148 | $ 250 | $ 359 | |
Other Real Estate Owned and Repossessed Assets | 984 | 984 | 1,146 | 1,165 | 1,165 | |
Accruing Loans Past Due 90 Days or More | 30 | - | 174 | - | - | |
Total Nonperforming Assets | $ 5,889 | $ 5,335 | $ 1,468 | $ 1,415 | $ 1,524 | |
Accruing Trouble Debt Restructurings | $ 91 | $ 125 | $ 1,393 | $ 1,444 | $ 1,474 | |
Three months ended | Nine months ended | |||||
September 30, | September 30, | |||||
2022 | 2021 | 2022 | 2021 | |||
Loans Charged-off | $ 1 | $ - | $ 4 | $ 127 | ||
Overdrafts Charged-off | 13 | 21 | 43 | 40 | ||
Loan Recoveries | (89) | (355) | (352) | (386) | ||
Overdraft Recoveries | (2) | (4) | (8) | (23) | ||
Net Charge-offs (Recoveries) | $ (77) | $ (338) | $ (313) | $ (242) | ||
Net Charge-offs / (Recoveries) to Average Loans2 | (0.03 %) | (0.15 %) | (0.05 %) | (0.04 %) | ||
2 Annualized | ||||||
FIRST COMMUNITY CORPORATION | |||||||||||||
INCOME STATEMENT DATA | |||||||||||||
(Dollars in thousands, except per share data) | |||||||||||||
Three months ended | Three months ended | Three months ended | Nine months ended | ||||||||||
September 30, | June 30, | March 31, | September 30, | ||||||||||
2022 | 2021 | 2022 | 2021 | 2022 | 2021 | 2022 | 2021 | ||||||
Interest income | $ 13,352 | $ 12,982 | $ 11,513 | $ 11,664 | $ 11,195 | $ 11,218 | $ 36,060 | $ 35,864 | |||||
Interest expense | 558 | 526 | 462 | 572 | 462 | 651 | 1,482 | 1,749 | |||||
Net interest income | 12,794 | 12,456 | 11,051 | 11,092 | 10,733 | 10,567 | 34,578 | 34,115 | |||||
Provision for (release of) loan losses | 18 | 49 | (70) | 168 | (125) | 177 | (177) | 394 | |||||
Net interest income after provision | 12,776 | 12,407 | 11,121 | 10,924 | 10,858 | 10,390 | 34,755 | 33,721 | |||||
Non-interest income | |||||||||||||
Deposit service charges | 243 | 257 | 262 | 212 | 265 | 246 | 770 | 715 | |||||
Mortgage banking income | 290 | 1,147 | 481 | 1,143 | 839 | 990 | 1,610 | 3,280 | |||||
Investment advisory fees and non-deposit commissions | 1,053 | 1,040 | 1,195 | 957 | 1,198 | 877 | 3,446 | 2,874 | |||||
Gain (loss) on sale of other assets | - | 13 | (45) | - | - | 77 | (45) | 90 | |||||
Other non-recurring income | - | 47 | 5 | - | 4 | 100 | 9 | 147 | |||||
Other | 1,087 | 1,060 | 1,111 | 1,106 | 1,068 | 1,006 | 3,266 | 3,172 | |||||
Total non-interest income | 2,673 | 3,564 | 3,009 | 3,418 | 3,374 | 3,296 | 9,056 | 10,278 | |||||
Non-interest expense | |||||||||||||
Salaries and employee benefits | 6,373 | 6,394 | 6,175 | 5,948 | 6,119 | 5,964 | 18,667 | 18,306 | |||||
Occupancy | 786 | 743 | 786 | 734 | 705 | 730 | 2,277 | 2,207 | |||||
Equipment | 331 | 336 | 329 | 338 | 332 | 275 | 992 | 949 | |||||
Marketing and public relations | 163 | 140 | 446 | 313 | 361 | 396 | 970 | 849 | |||||
FDIC assessment | 121 | 189 | 105 | 146 | 130 | 169 | 356 | 504 | |||||
Other real estate expenses | 19 | 58 | 29 | 55 | 47 | 29 | 95 | 142 | |||||
Amortization of intangibles | 39 | 52 | 40 | 52 | 39 | 57 | 118 | 161 | |||||
Other | 2,585 | 1,993 | 2,278 | 2,292 | 2,221 | 1,920 | 7,084 | 6,205 | |||||
Total non-interest expense | 10,417 | 9,905 | 10,188 | 9,878 | 9,954 | 9,540 | 30,559 | 29,323 | |||||
Income before taxes | 5,032 | 6,066 | 3,942 | 4,464 | 4,278 | 4,146 | 13,252 | 14,676 | |||||
Income tax expense | 1,081 | 1,318 | 812 | 921 | 789 | 891 | 2,682 | 3,130 | |||||
Net income | $ 3,951 | $ 4,748 | $ 3,130 | $ 3,543 | $ 3,489 | $ 3,255 | $ 10,570 | $ 11,546 | |||||
Per share data | |||||||||||||
Net income, basic | $ 0.52 | $ 0.63 | $ 0.42 | $ 0.47 | $ 0.46 | $ 0.44 | $ 1.40 | $ 1.54 | |||||
Net income, diluted | $ 0.52 | $ 0.63 | $ 0.41 | $ 0.47 | $ 0.46 | $ 0.43 | $ 1.39 | $ 1.53 | |||||
Average number of shares outstanding - basic | 7,531,104 | 7,498,832 | 7,526,284 | 7,485,625 | 7,518,375 | 7,475,522 | 7,523,792 | 7,486,746 | |||||
Average number of shares outstanding - diluted | 7,607,909 | 7,555,998 | 7,607,349 | 7,537,179 | 7,594,840 | 7,522,568 | 7,605,540 | 7,540,332 | |||||
Shares outstanding period end | 7,572,517 | 7,544,374 | 7,566,633 | 7,539,587 | 7,559,760 | 7,524,944 | 7,572,517 | 7,544,374 | |||||
Return on average assets | 0.94 % | 1.22 % | 0.76 % | 0.94 % | 0.87 % | 0.92 % | 0.86 % | 1.03 % | |||||
Return on average common equity | 13.17 % | 13.42 % | 10.82 % | 10.51 % | 10.31 % | 9.74 % | 11.39 % | 11.26 % | |||||
Return on average common tangible equity | 15.14 % | 15.10 % | 12.48 % | 11.89 % | 11.63 % | 11.01 % | 13.02 % | 12.71 % | |||||
Net interest margin (non taxable equivalent) | 3.26 % | 3.43 % | 2.90 % | 3.17 % | 2.87 % | 3.20 % | 3.01 % | 3.27 % | |||||
Net interest margin (taxable equivalent) | 3.29 % | 3.47 % | 2.93 % | 3.20 % | 2.91 % | 3.23 % | 3.05 % | 3.30 % | |||||
Efficiency ratio1 | 66.78 % | 61.56 % | 71.60 % | 67.50 % | 69.93 % | 69.16 % | 69.36 % | 65.87 % | |||||
1 Calculated by dividing non-interest expense by net interest income on tax equivalent basis and non interest income, excluding gain on sale of other assets and other non-recurring noninterest income. | |||||||||||||
FIRST COMMUNITY CORPORATION | ||||||||
Yields on Average Earning Assets and | ||||||||
Rates on Average Interest-Bearing Liabilities | ||||||||
Three months ended September 30, 2022 | Three months ended September 30, 2021 | |||||||
Average | Interest | Yield/ | Average | Interest | Yield/ | |||
Balance | Earned/Paid | Rate | Balance | Earned/Paid | Rate | |||
Assets | ||||||||
Earning assets | ||||||||
Loans | ||||||||
PPP loans | $ 244 | $ 1 | 1.63 % | $ 31,936 | $ 1,646 | 20.45 % | ||
Non-PPP loans | 938,074 | 10,099 | 4.27 % | 861,952 | 9,310 | 4.29 % | ||
Total loans | 938,318 | 10,100 | 4.27 % | 893,888 | 10,956 | 4.86 % | ||
Non-taxable securities | 52,732 | 385 | 2.90 % | 54,626 | 388 | 2.82 % | ||
Taxable securities | 528,312 | 2,673 | 2.01 % | 433,900 | 1,607 | 1.47 % | ||
Int bearing deposits in other banks | 37,486 | 194 | 2.05 % | 58,541 | 31 | 0.21 % | ||
Fed funds sold | 43 | - | 0.00 % | 6 | - | 0.00 % | ||
Total earning assets | 1,556,891 | 13,352 | 3.40 % | 1,440,961 | 12,982 | 3.57 % | ||
Cash and due from banks | 25,033 | 24,903 | ||||||
Premises and equipment | 32,016 | 33,747 | ||||||
Goodwill and other intangibles | 15,457 | 15,621 | ||||||
Other assets | 49,587 | 38,376 | ||||||
Allowance for loan losses | (11,247) | (10,788) | ||||||
Total assets | $ 1,667,737 | $ 1,542,820 | ||||||
Liabilities | ||||||||
Interest-bearing liabilities | ||||||||
Interest-bearing transaction accounts | $ 335,648 | $ 48 | 0.06 % | $ 306,108 | $ 43 | 0.06 % | ||
Money market accounts | 320,202 | 156 | 0.19 % | 278,958 | 109 | 0.16 % | ||
Savings deposits | 167,302 | 23 | 0.05 % | 139,540 | 20 | 0.06 % | ||
Time deposits | 144,338 | 105 | 0.29 % | 157,485 | 231 | 0.58 % | ||
Fed funds purchased | 262 | 3 | 4.54 % | - | - | NA | ||
Securities sold under agreements to repurchase | 71,376 | 32 | 0.18 % | 62,876 | 19 | 0.12 % | ||
Other short-term debt | - | - | NA | - | - | NA | ||
Other long-term debt | 14,964 | 191 | 5.06 % | 14,964 | 104 | 2.76 % | ||
Total interest-bearing liabilities | 1,054,092 | 558 | 0.21 % | 959,931 | 526 | 0.22 % | ||
Demand deposits | 482,461 | 430,474 | ||||||
Other liabilities | 12,183 | 12,011 | ||||||
Shareholders' equity | 119,001 | 140,404 | ||||||
Total liabilities and shareholders' equity | $ 1,667,737 | $ 1,542,820 | ||||||
Cost of deposits, including demand deposits | 0.09 % | 0.12 % | ||||||
Cost of funds, including demand deposits | 0.14 % | 0.15 % | ||||||
Net interest spread | 3.19 % | 3.35 % | ||||||
Net interest income/margin - excluding PPP loans | $ 12,793 | 3.26 % | $ 10,810 | 3.04 % | ||||
Net interest income/margin - including PPP loans | $ 12,794 | 3.26 % | $ 12,456 | 3.43 % | ||||
Net interest income/margin (tax equivalent) - excl. PPP loans | $ 12,924 | 3.29 % | $ 10,939 | 3.08 % | ||||
Net interest income/margin (tax equivalent) - incl. PPP loans | $ 12,925 | 3.29 % | $ 12,585 | 3.47 % | ||||
FIRST COMMUNITY CORPORATION | ||||||||
Yields on Average Earning Assets and | ||||||||
Rates on Average Interest-Bearing Liabilities | ||||||||
Nine months ended September 30, 2022 | Nine months ended September 30, 2021 | |||||||
Average | Interest | Yield/ | Average | Interest | Yield/ | |||
Balance | Earned/Paid | Rate | Balance | Earned/Paid | Rate | |||
Assets | ||||||||
Earning assets | ||||||||
Loans | ||||||||
PPP loans | $ 368 | $ 48 | 17.44 % | $ 47,605 | $ 3,086 | 8.67 % | ||
Non-PPP loans | 903,621 | 28,359 | 4.20 % | 844,382 | 27,061 | 4.28 % | ||
Total loans | 903,989 | 28,407 | 4.20 % | 891,987 | 30,147 | 4.52 % | ||
Non-taxable securities | 52,480 | 1,140 | 2.90 % | 54,896 | 1,164 | 2.83 % | ||
Taxable securities | 518,651 | 6,126 | 1.58 % | 376,436 | 4,459 | 1.58 % | ||
Int bearing deposits in other banks | 59,050 | 387 | 0.88 % | 71,052 | 94 | 0.18 % | ||
Fed funds sold | 21 | - | 0.00 % | 752 | - | 0.00 % | ||
Total earning assets | 1,534,191 | 36,060 | 3.14 % | 1,395,123 | 35,864 | 3.44 % | ||
Cash and due from banks | 27,295 | 22,844 | ||||||
Premises and equipment | 32,391 | 34,065 | ||||||
Goodwill and other intangibles | 15,496 | 15,673 | ||||||
Other assets | 46,658 | 38,581 | ||||||
Allowance for loan losses | (11,228) | (10,629) | ||||||
Total assets | $ 1,644,803 | $ 1,495,657 | ||||||
Liabilities | ||||||||
Interest-bearing liabilities | ||||||||
Interest-bearing transaction accounts | $ 336,584 | $ 138 | 0.05 % | $ 296,430 | $ 152 | 0.07 % | ||
Money market accounts | 309,717 | 384 | 0.17 % | 267,143 | 359 | 0.18 % | ||
Savings deposits | 155,856 | 65 | 0.06 % | 132,700 | 58 | 0.06 % | ||
Time deposits | 149,559 | 387 | 0.35 % | 158,969 | 801 | 0.67 % | ||
Fed funds purchased | 88 | 3 | 4.56 % | 1 | - | 0.00 % | ||
Securities sold under agreements to repurchase | 75,309 | 79 | 0.14 % | 62,214 | 66 | 0.14 % | ||
Other short-term debt | - | - | NA | - | - | NA | ||
Other long-term debt | 14,964 | 426 | 3.81 % | 14,964 | 313 | 2.80 % | ||
Total interest-bearing liabilities | 1,042,077 | 1,482 | 0.19 % | 932,421 | 1,749 | 0.25 % | ||
Demand deposits | 466,139 | 413,723 | ||||||
Other liabilities | 12,549 | 12,426 | ||||||
Shareholders' equity | 124,038 | 137,087 | ||||||
Total liabilities and shareholders' equity | $ 1,644,803 | $ 1,495,657 | ||||||
Cost of deposits, including demand deposits | 0.09 % | 0.14 % | ||||||
Cost of funds, including demand deposits | 0.13 % | 0.17 % | ||||||
Net interest spread | 2.95 % | 3.19 % | ||||||
Net interest income/margin - excluding PPP loans | $ 34,530 | 3.01 % | $ 31,029 | 3.08 % | ||||
Net interest income/margin - including PPP loans | $ 34,578 | 3.01 % | $ 34,115 | 3.27 % | ||||
Net interest income/margin (tax equivalent) - excl. PPP loans | $ 34,921 | 3.04 % | $ 31,389 | 3.11 % | ||||
Net interest income/margin (tax equivalent) - incl. PPP loans | $ 34,969 | 3.05 % | $ 34,475 | 3.30 % | ||||
The tables below provide a reconciliation of non‑GAAP measures to GAAP for the periods indicated:
September 30, |
June 30, | March 31, | December 31, | September 30, | |||||||||||||
Tangible book value per common share | 2022 | 2022 | 2022 | 2021 | 2021 | ||||||||||||
Tangible common equity per common share (non‑GAAP) | $ | 13.03 | $ | 13.50 | $ | 14.53 | $ | 16.62 | $ | 16.37 | |||||||
Effect to adjust for intangible assets | 2.04 | 2.04 | 2.06 | 2.06 | 2.07 | ||||||||||||
Book value per common share (GAAP) | $ | 15.07 | $ | 15.54 | $ | 16.59 | $ | 18.68 | $ | 18.44 | |||||||
Tangible common shareholders' equity to tangible | |||||||||||||||||
Tangible common equity to tangible assets (non‑GAAP) | 6.03 | % | 6.12 | % | 6.71 | % | 8.00 | % | 8.00 | % | |||||||
Effect to adjust for intangible assets | 0.88 | % | 0.86 | % | 0.88 | % | 0.90 | % | 0.92 | % | |||||||
Common equity to assets (GAAP) | 6.91 | % | 6.98 | % | 7.59 | % | 8.90 | % | 8.92 | % | |||||||
September 30, |
June 30, | March 31, | December 31, | September 30, | |||||||||||||
Tangible book value per common share excluding | 2022 | 2022 | 2022 | 2021 | 2021 | ||||||||||||
Tangible common equity per common share excluding | $ | 17.43 | $ | 17.00 | $ | 16.52 | $ | 16.18 | $ | 15.76 | |||||||
Effect to adjust for intangible assets and accumulated | (2.36) | (1.46) | 0.07 | 2.50 | 2.68 | ||||||||||||
Book value per common share (GAAP) | $ | 15.07 | $ | 15.54 | $ | 16.59 | $ | 18.68 | $ | 18.44 | |||||||
Tangible common shareholders' equity to tangible | |||||||||||||||||
Tangible common equity to tangible assets excluding | 7.90 | % | 7.59 | % | 7.56 | % | 7.80 | % | 7.72 | % | |||||||
Effect to adjust for intangible assets and accumulated | (0.99) | % | (0.61) | % | 0.03 | % | 1.10 | % | 1.20 | % | |||||||
Common equity to assets (GAAP) | 6.91 | % | 6.98 | % | 7.59 | % | 8.90 | % | 8.92 | % | |||||||
Return on average tangible | Three months ended | Three months ended | Three months ended | Nine months ended | ||||||||||||
2022 | 2021 | 2022 | 2021 | 2022 | 2021 | 2022 | 2021 | |||||||||
Return on average tangible | 15.14 | % | 15.10 | % | 12.48 | % | 11.89 | % | 11.63 | % | 11.01 | % | 13.02 | % | 12.71 | % |
Effect to adjust for intangible | (1.97) | % | (1.68) | % | (1.66) | % | (1.38) | % | (1.32) | % | (1.27) | % | (1.63) | % | (1.45) | % |
Return on average common | 13.17 | % | 13.42 | % | 10.82 | % | 10.51 | % | 10.31 | % | 9.74 | % | 11.39 | % | 11.26 | % |
Three months ended | Nine months ended | |||||||||||
September 30, | June 30, | September 30, |
September 30, | |||||||||
Pre-tax, pre-provision earnings | 2022 | 2022 | 2021 | 2022 | 2021 | |||||||
Pre-tax, pre-provision earnings (non‑GAAP) | $ | 5,050 | $ | 3,872 | $ | 6,115 | $ | 13,075 | $ | 15,070 | ||
Effect to adjust for pre-tax, pre-provision earnings | (1,099) | (742) | (1,367) | (2,505) | (3,524) | |||||||
Net Income (GAAP) | $ | 3,951 | $ | 3,130 | $ | 4,748 | $ | 10,570 | $ | 11,546 | ||
Three months ended | Nine months ended | ||||||||||||
September 30, | September 30, | ||||||||||||
Net interest margin excluding PPP Loans | 2022 | 2021 | 2022 | 2021 | |||||||||
Net interest margin excluding PPP loans (non-GAAP) | 3.26 % | 3.04 % | 3.01 % | 3.08 % | |||||||||
Effect to adjust for PPP loans | 0.00 | 0.39 | 0.00 | 0.19 | |||||||||
Net interest margin (GAAP) | 3.26 % | 3.43 % | 3.01 % | 3.27 % | |||||||||
Three months ended | Nine months ended | |||||||||||||
September 30, | September 30, | |||||||||||||
Net interest margin on a tax-equivalent basis excluding | 2022 | 2021 | 2022 | 2021 | ||||||||||
Net interest margin on a tax-equivalent basis excluding | 3.29 % | 3.08 % | 3.04 % | 3.11 % | ||||||||||
Effect to adjust for PPP loans | 0.00 | 0.39 | 0.01 | 0.19 | ||||||||||
Net interest margin on a tax equivalent basis (GAAP) | 3.29 % | 3.47 % | 3.05 % | 3.30 % | ||||||||||
September 30, | June 30, | Growth | Annualized | |||||||||||
Loans and loan growth | 2022 | 2022 | Dollars | Rate | ||||||||||
Non-PPP Loans and Related Credit Facilities (non-GAAP) | $ | 949,972 | 916,082 | 33,890 | 14.7 | % | ||||||||
PPP Related Credit Facilities | 0 | 0 | 0 | 0 | % | |||||||||
Non-PPP Loans (non‑GAAP) | $ | 949,972 | $ | 916,082 | $ | 33,890 | 14.7 | % | ||||||
PPP Loans | 238 | 250 | (12) | (19.0) | % | |||||||||
Total Loans (GAAP) | $ | 950,210 | $ | 916,332 | $ | 33,878 | 14.7 | % | ||||||
September 30, | September 30, | Growth | Annualized | |||||||||||
Loans and loan growth | 2022 | 2021 | Dollars | Rate | ||||||||||
Non-PPP Loans and Related Credit Facilities (non-GAAP) | $ | 949,972 | 870,608 | 79,364 | 9.1 | % | ||||||||
PPP Related Credit Facilities | 0 | 1,803 | (1,803) | (100.0) | % | |||||||||
Non-PPP Loans (non‑GAAP) | $ | 949,972 | $ | 872,411 | $ | 77,561 | 8.9 | % | ||||||
PPP Loans | 238 | 9,109 | (8,871) | (97.4) | % | |||||||||
Total Loans (GAAP) | $ | 950,210 | $ | 881,520 | $ | 68,690 | 7.8 | % | ||||||
Certain financial information presented above is determined by methods other than in accordance with generally accepted accounting principles ("GAAP"). These non-GAAP financial measures include "Tangible book value per common share," "Tangible common shareholders' equity to tangible assets," "Tangible book value per common share excluding accumulated other comprehensive income (loss)," "Tangible common shareholders' equity to tangible assets excluding accumulated other comprehensive income (loss)," "Return on average tangible common equity," "Pre-tax, pre-provision earnings," "Net interest margin excluding PPP Loans," "Net interest margin on a tax-equivalent basis excluding PPP Loans," "Non-PPP Loans and Related Credit Facilities," and "Non-PPP Loans."
- "Tangible book value per common share" is defined as total equity reduced by recorded intangible assets divided by total common shares outstanding.
- "Tangible common shareholders' equity to tangible assets" is defined as total common equity reduced by recorded intangible assets divided by total assets reduced by recorded intangible assets.
- "Tangible book value per common share excluding accumulated other comprehensive income (loss)" is defined as total equity reduced by recorded intangible assets and accumulated other comprehensive income (loss) divided by total common shares outstanding.
- "Tangible common shareholders' equity to tangible assets excluding accumulated other comprehensive income (loss)" is defined as total common equity reduced by recorded intangible assets and accumulated other comprehensive income (loss) divided by total assets reduced by recorded intangible assets and other comprehensive income (loss).
- "Return on average tangible common equity" is defined as net income on an annualized basis divided by average total equity reduced by average recorded intangible assets.
- "Pre-tax, pre-provision earnings" is defined as net interest income plus non-interest income, reduced by non-interest expense.
- "Net interest margin excluding PPP Loans" is defined as annualized net interest income less annualized interest income on PPP Loans divided by average earning assets less the average balance of PPP Loans.
- "Net interest margin on a tax-equivalent basis excluding PPP Loans" is defined as annualized net interest income on a tax-equivalent basis less annualized interest income on PPP Loans divided by average earning assets less the average balance of PPP Loans.
- "Non-PPP Loans and Related Credit Facilities" is defined as Total Loans less PPP Related Credit Facilities and PPP Loans.
- "Non-PPP Loans" is defined as Total Loans less PPP Loans.
- "Non-PPP Loans and Related Credit Facilities Growth - Dollars" is calculated by taking the difference between two time periods compared for Total Loans less PPP Loans and PPP Related Credit Facilities. "Non-PPP Loans and Related Credit Facilities – Annualized Growth Rate" is calculated by (i) dividing "Non-PPP Loans and Related Credit Facilities Loan Growth - Dollars" by the number of days between the two time periods compared (ii) times the number of days in the year (iii) divided by the prior time period Non-PPP Loans and Related Credit Facilities balance.
- "Non-PPP Loans Growth - Dollars" is calculated by taking the difference between two time periods compared for Total Loans less PPP Loans. "Non-PPP Loans – Annualized Growth Rate" is calculated by (i) dividing "Non-PPP Loans Loan Growth - Dollars" by the number of days between the two time periods compared (ii) times the number of days in the year (iii) divided by the prior time period Non-PPP Loans balance.
Our management believes that these non-GAAP measures are useful because they enhance the ability of investors and management to evaluate and compare our operating results from period-to-period in a meaningful manner. Non-GAAP measures have limitations as analytical tools, and investors should not consider them in isolation or as a substitute for analysis of the company's results as reported under GAAP.
View original content to download multimedia:https://www.prnewswire.com/news-releases/first-community-corporation-announces-third-quarter-results-and-cash-dividend-301652905.html
SOURCE First Community Corporation
Apartment permits are back to recession lows. Will mortgage rates follow?
If housing leads us into a recession in the near future, that means mortgage rates have stayed too high for too long.
Share this:


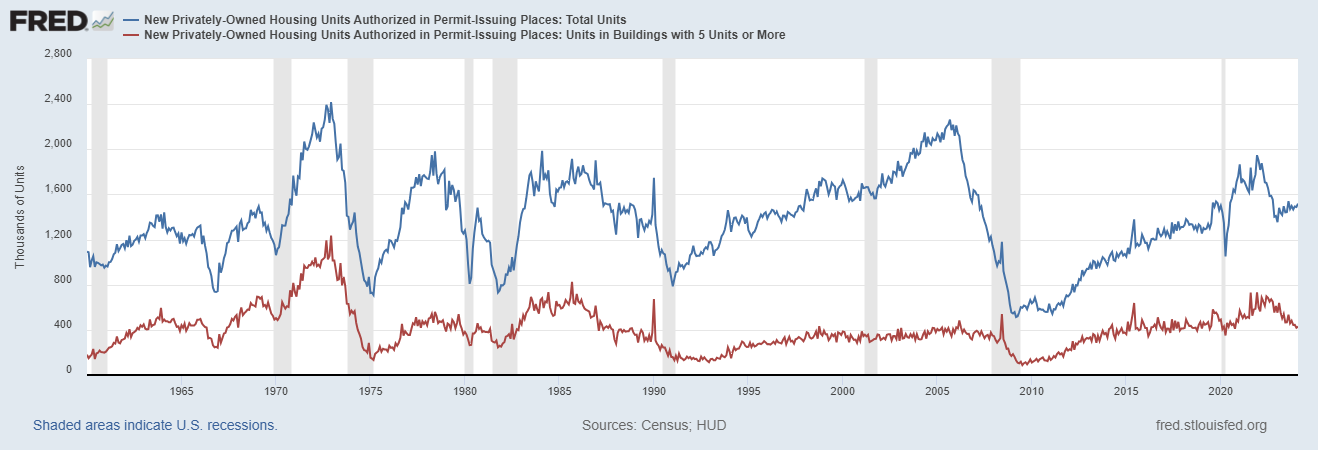
In Tuesday’s report, the 5-unit housing permits data hit the same levels we saw in the COVID-19 recession. Once the backlog of apartments is finished, those jobs will be at risk, which traditionally means mortgage rates would fall soon after, as they have in previous economic cycles.
However, this is happening while single-family permits are still rising as the rate of builder buy-downs and the backlog of single-family homes push single-family permits and starts higher. It is a tale of two markets — something I brought up on CNBC earlier this year to explain why this trend matters with housing starts data because the two marketplaces are heading in opposite directions.
The question is: Will the uptick in single-family permits keep mortgage rates higher than usual? As long as jobless claims stay low, the falling 5-unit apartment permit data might not lead to lower mortgage rates as it has in previous cycles.
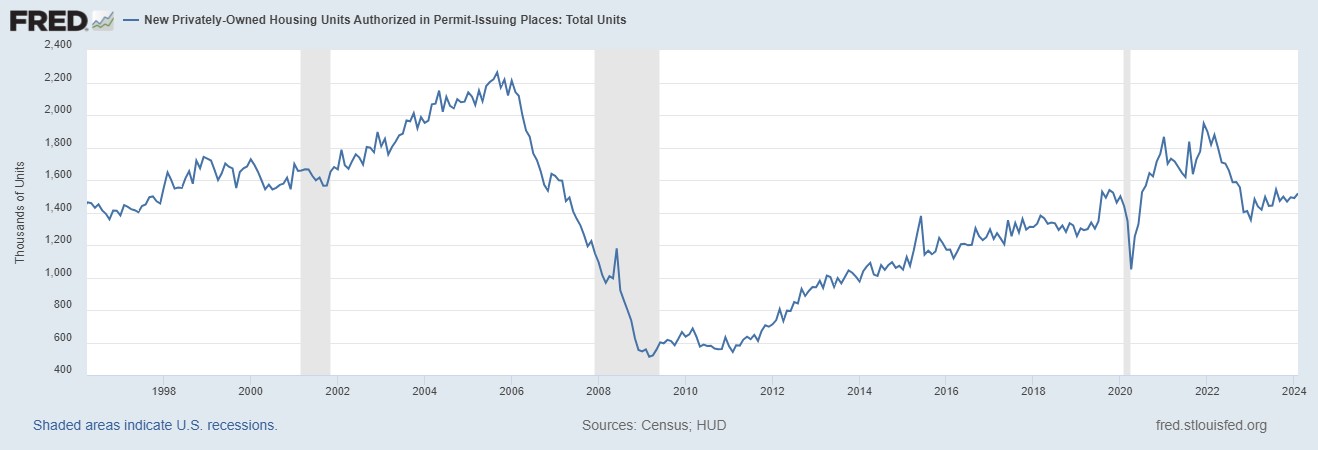
From Census: Building Permits: Privately‐owned housing units authorized by building permits in February were at a seasonally adjusted annual rate of 1,518,000. This is 1.9 percent above the revised January rate of 1,489,000 and 2.4 percent above the February 2023 rate of 1,482,000.
When people say housing leads us in and out of a recession, it is a valid premise and that is why people carefully track housing permits. However, this housing cycle has been unique. Unfortunately, many people who have tracked this housing cycle are still stuck on 2008, believing that what happened during COVID-19 was rampant demand speculation that would lead to a massive supply of homes once home sales crashed. This would mean the builders couldn’t sell more new homes or have housing permits rise.
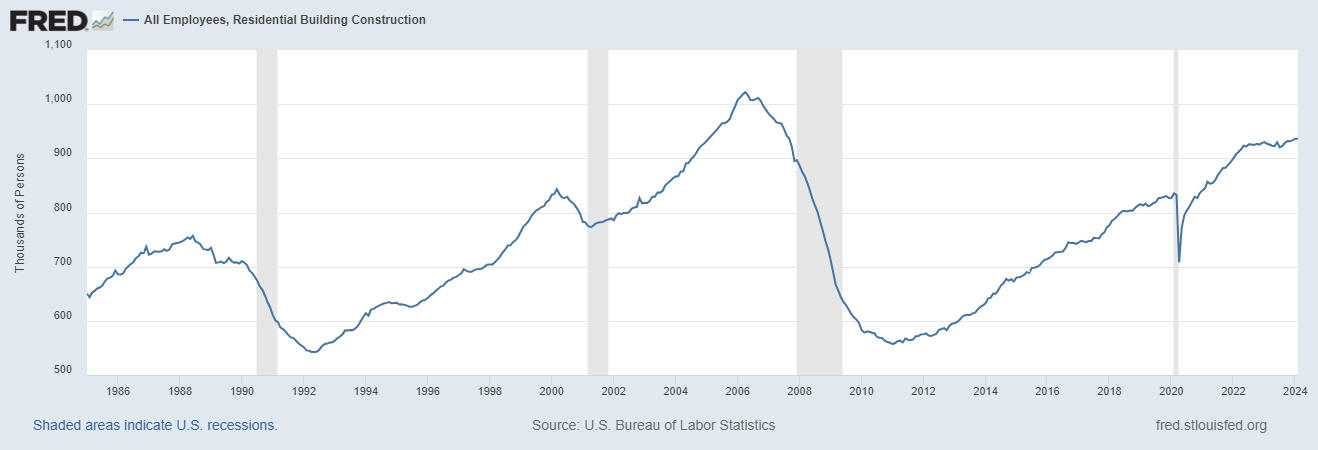
Housing permits, starts and new home sales were falling for a while, and in 2022, the data looked recessionary. However, new home sales were never near the 2005 peak, and the builders found a workable bottom in sales by paying down mortgage rates to boost demand. The first level of job loss recessionary data has been averted for now. Below is the chart of the building permits.
On the other hand, the apartment boom and bust has already happened. Permits are already back to the levels of the COVID-19 recession and have legs to move lower. Traditionally, when this data line gets this negative, a recession isn’t far off. But, as you can see in the chart below, there’s a big gap between the housing permit data for single-family and five units. Looking at this chart, the recession would only happen after single-family and 5-unit permits fall together, not when we have a gap like we see today.
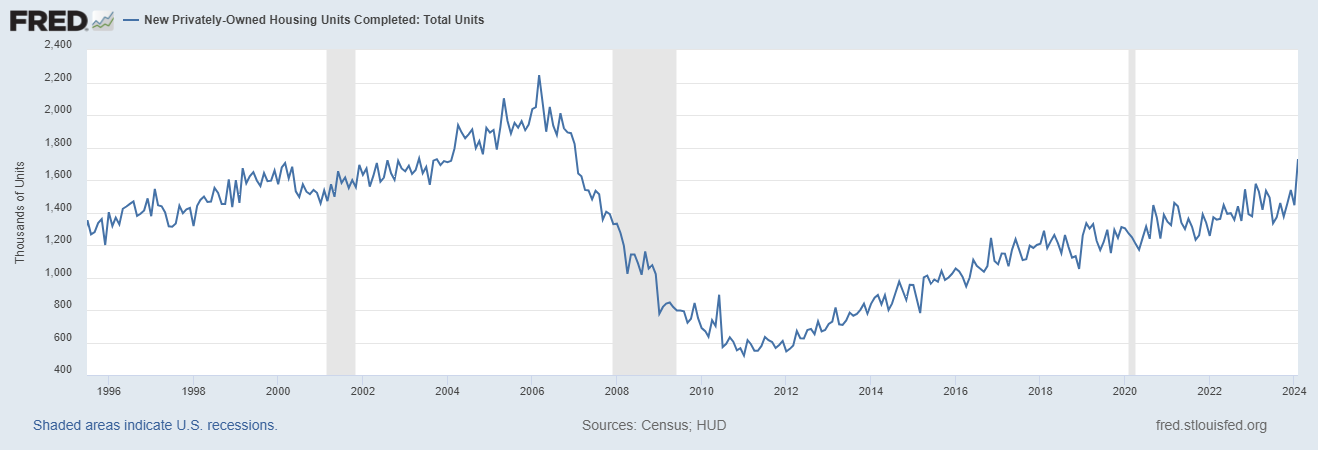
From Census: Housing completions: Privately‐owned housing completions in February were at a seasonally adjusted annual rate of 1,729,000.
As we can see in the chart below, we had a solid month of housing completions. This was driven by 5-unit completions, which have been in the works for a while now. Also, this month’s report show a weather impact as progress in building was held up due to bad weather. However, the good news is that more supply of rental units will mean the fight against rent inflation will be positive as more supply is the best way to deal with inflation. In time, that is also good news for mortgage rates.
Housing Starts: Privately‐owned housing starts in February were at a seasonally adjusted annual rate of 1,521,000. This is 10.7 percent (±14.2 percent)* above the revised January estimate of 1,374,000 and is 5.9 percent (±10.0 percent)* above the February 2023 rate of 1,436,000.
Housing starts data beat to the upside, but the real story is that the marketplace has diverged into two different directions. The apartment boom is over and permits are heading below the COVID-19 recession, but as long as the builders can keep rates low enough to sell more new homes, single-family permits and starts can slowly move forward.
If we lose the single-family marketplace, expect the chart below to look like it always does before a recession — meaning residential construction workers lose their jobs. For now, the apartment construction workers are at the most risk once they finish the backlog of apartments under construction.
Overall, the housing starts beat to the upside. Still, the report’s internals show a marketplace with early recessionary data lines, which traditionally mean mortgage rates should go lower soon. If housing leads us into a recession in the near future, that means mortgage rates have stayed too high for too long and restrictive policy by the Fed created a recession as we have seen in previous economic cycles.
The builders have been paying down rates to keep construction workers employed, but if rates go higher, it will get more and more challenging to do this because not all builders have the capacity to buy down rates. Last year, we saw what 8% mortgage rates did to new home sales; they dropped before rates fell. So, this is something to keep track of, especially with a critical Federal Reserve meeting this week.
recession covid-19 fed federal reserve home sales mortgage rates recessionUncategorized
One more airline cracks down on lounge crowding in a way you won’t like
Qantas Airways is increasing the price of accessing its network of lounges by as much as 17%.
Share this:


Over the last two years, multiple airlines have dealt with crowding in their lounges. While they are designed as a luxury experience for a small subset of travelers, high numbers of people taking a trip post-pandemic as well as the different ways they are able to gain access through status or certain credit cards made it difficult for some airlines to keep up with keeping foods stocked, common areas clean and having enough staff to serve bar drinks at the rate that customers expect them.
In the fall of 2023, Delta Air Lines (DAL) caught serious traveler outcry after announcing that it was cracking down on crowding by raising how much one needs to spend for lounge access and limiting the number of times one can enter those lounges.
Related: Competitors pushed Delta to backtrack on its lounge and loyalty program changes
Some airlines saw the outcry with Delta as their chance to reassure customers that they would not raise their fees while others waited for the storm to pass to quietly implement their own increases.
Shutterstock
This is how much more you'll have to pay for Qantas lounge access
Australia's flagship carrier Qantas Airways (QUBSF) is the latest airline to announce that it would raise the cost accessing the 24 lounges across the country as well as the 600 international lounges available at airports across the world through partner airlines.
More Travel:
- A new travel term is taking over the internet (and reaching airlines and hotels)
- The 10 best airline stocks to buy now
- Airlines see a new kind of traveler at the front of the plane
Unlike other airlines which grant access primarily after reaching frequent flyer status, Qantas also sells it through a membership — starting from April 18, 2024, prices will rise from $600 Australian dollars ($392 USD) to $699 AUD ($456 USD) for one year, $1,100 ($718 USD) to $1,299 ($848 USD) for two years and $2,000 AUD ($1,304) to lock in the rate for four years.
Those signing up for lounge access for the first time also currently pay a joining fee of $99 AUD ($65 USD) that will rise to $129 AUD ($85 USD).
The airline also allows customers to purchase their membership with Qantas Points they collect through frequent travel; the membership fees are also being raised by the equivalent amount in points in what adds up to as much as 17% — from 308,000 to 399,900 to lock in access for four years.
Airline says hikes will 'cover cost increases passed on from suppliers'
"This is the first time the Qantas Club membership fees have increased in seven years and will help cover cost increases passed on from a range of suppliers over that time," a Qantas spokesperson confirmed to Simple Flying. "This follows a reduction in the membership fees for several years during the pandemic."
The spokesperson said the gains from the increases will go both towards making up for inflation-related costs and keeping existing lounges looking modern by updating features like furniture and décor.
While the price increases also do not apply for those who earned lounge access through frequent flyer status or change what it takes to earn that status, Qantas is also introducing even steeper increases for those renewing a membership or adding additional features such as spouse and partner memberships.
In some cases, the cost of these features will nearly double from what members are paying now.
stocks pandemicUncategorized
Star Wars icon gives his support to Disney, Bob Iger
Disney shareholders have a huge decision to make on April 3.
Share this:

Disney's (DIS) been facing some headwinds up top, but its leadership just got backing from one of the company's more prominent investors.
Star Wars creator George Lucas put out of statement in support of the company's current leadership team, led by CEO Bob Iger, ahead of the April 3 shareholders meeting which will see investors vote on the company's 12-member board.
"Creating magic is not for amateurs," Lucas said in a statement. "When I sold Lucasfilm just over a decade ago, I was delighted to become a Disney shareholder because of my long-time admiration for its iconic brand and Bob Iger’s leadership. When Bob recently returned to the company during a difficult time, I was relieved. No one knows Disney better. I remain a significant shareholder because I have full faith and confidence in the power of Disney and Bob’s track record of driving long-term value. I have voted all of my shares for Disney’s 12 directors and urge other shareholders to do the same."
Related: Disney stands against Nelson Peltz as leadership succession plan heats up
Lucasfilm was acquired by Disney for $4 billion in 2012 — notably under the first term of Iger. He received over 37 million in shares of Disney during the acquisition.
Lucas' statement seems to be an attempt to push investors away from the criticism coming from The Trian Partners investment group, led by Nelson Peltz. The group, owns about $3 million in shares of the media giant, is pushing two candidates for positions on the board, which are Peltz and former Disney CFO Jay Rasulo.
Peltz and Co. have called out a pair of Disney directors — Michael Froman and Maria Elena Lagomasino — for their lack of experience in the media space.
Related: Women's basketball is gaining ground, but is March Madness ready to rival the men's game?
Blackwells Capital is also pushing three of its candidates to take seats during the early April shareholder meeting, though Reuters has reported that the firm has been supportive of the company's current direction.
Disney has struggled in recent years amid the changes in media and the effects of the pandemic — which triggered the return of Iger at the helm in late 2022. After going through mass layoffs in the spring of 2023 and focusing on key growth brands, the company has seen a steady recovery with its stock up over 25% year-to-date and around 40% for the last six months.
Related: Veteran fund manager picks favorite stocks for 2024
stocks pandemic recovery

Manufacturing and construction vs. the still-inverted yield curve


When words make you sick


How much stress is too much? A psychiatrist explains the links between toxic stress and poor health − and how to get help


Apartment permits are back to recession lows. Will mortgage rates follow?


Caitlin Clark, Coach Prime, and Linsanity: The Anatomy of a Viewership ‘Craze’


PR55α-controlled PP2A Inhibits p16 Expression and Blocks Cellular Senescence Induction


Half Of Downtown Pittsburgh Office Space Could Be Empty In 4 Years


US Economic Conditions Scream “Buy Gold”


Wall Street Bonuses Fall For Second Year To 2019 Lows Amid Capital Markets Freeze


One more airline cracks down on lounge crowding in a way you won’t like
-

 Spread & Containment7 days ago
IFM’s Hat Trick and Reflections On Option-To-Buy M&A
-

 Uncategorized4 weeks ago
All Of The Elements Are In Place For An Economic Crisis Of Staggering Proportions
-

 International2 weeks ago
EyePoint poaches medical chief from Apellis; Sandoz CFO, longtime BioNTech exec to retire
-

 Uncategorized1 month ago
California Counties Could Be Forced To Pay $300 Million To Cover COVID-Era Program
-

 Uncategorized4 weeks ago
Apparel Retailer Express Moving Toward Bankruptcy
-

 Uncategorized1 month ago
Industrial Production Decreased 0.1% in January
-

 International2 weeks ago
Walmart launches clever answer to Target’s new membership program
-

 Uncategorized1 month ago
RFK Jr: The Wuhan Cover-Up & The Rise Of The Biowarfare-Industrial Complex