Connect with us

Uncategorized

Fed’s Flow of Funds: Household Net Worth Increased $5.5 Trillion in Q2

The Federal Reserve released the Q2 2023 Flow of Funds report today: Financial Accounts of the United States.

The net worth of households and nonprofits rose to
$154.3 trillion during the second quarter of 2023. The
value of directly and indirectly…

Published

on

The Federal Reserve released the Q2 2023 Flow of Funds report today: Financial Accounts of the United States.
The net worth of households and nonprofits rose to $154.3 trillion during the second quarter of 2023. The value of directly and indirectly held corporate equities increased $2.6 trillion and the value of real estate increased $2.5 trillion.
...
Household debt increased 2.7 percent at an annual rate in the second quarter of 2023. Consumer credit grew at an annual rate of 2.3 percent, while mortgage debt (excluding charge-offs) grew at an annual rate of 2.8 percent.
Click on graph for larger image.

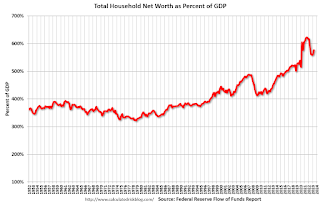
The first graph shows Households and Nonprofit net worth as a percent of GDP.  

Net worth increased $5.5 trillion in Q2 and is at an all-time high.  As a percent of GDP, net worth increased in Q2, but is below the peak in 2021.

This includes real estate and financial assets (stocks, bonds, pension reserves, deposits, etc) net of liabilities (mostly mortgages). Note that this does NOT include public debt obligations.

Household Percent EquityThe second graph shows homeowner percent equity since 1952.

Household percent equity (as measured by the Fed) collapsed when house prices fell sharply in 2007 and 2008.

In Q2 2023, household percent equity (of household real estate) was at 71.1% - up from 70.0% in Q1, 2023. This is close to the highest percent equity since the 1960s.

Note: This includes households with no mortgage debt.

Household Real Estate Assets Percent GDP The third graph shows household real estate assets and mortgage debt as a percent of GDP.  Note this graph was impacted by the sharp decline in Q2 2020 GDP.

Mortgage debt increased by $90 billion in Q2.

Mortgage debt is up $2.15 trillion from the peak during the housing bubble, but, as a percent of GDP is at 47.9% - down from Q1 - and down from a peak of 73.3% of GDP during the housing bust.

The value of real estate, as a percent of GDP, increased in Q2 - but is below the peak in Q2 2022 - and is well above the average of the last 30 years.

Read More

Continue Reading

Uncategorized

US Economic Conditions Scream “Buy Gold”

US Economic Conditions Scream "Buy Gold"

Authored by Daniel Lacalle via The Epoch Times,

The manufacturing and consumer confidence weaknesses…

Published

on

US Economic Conditions Scream "Buy Gold"

Authored by Daniel Lacalle via The Epoch Times,

The manufacturing and consumer confidence weaknesses of the United States are deeply concerning, particularly considering that all those allegedly infallible Keynesian policies are being applied intensely.

Considering the insanity of deficit spending driven by entitlement programs, the decline in the headline University of Michigan consumer sentiment index in March—from 76.9 to 76.5—is even worse than expected. Let us remember that this index was at 101 in 2019 and has not recovered the brief bounce shown by the reopening effect in March 2021. Consumer confidence is still incredibly low, and a decline in the expectations index fully explains the most recent decline. Persistent inflation, high gas prices, and declining real wages may explain the poor expectations of the average citizen. Furthermore, this poor consumer confidence reading comes after poor control group retail sales last month.

No, this is not a strong economy. The consumer confidence index, labor participation, and unemployment-to-population ratios, as well as real wage growth, remain significantly below the pre-pandemic level, and this after $6.3 trillion in new public debt that will likely reach $8 trillion by the end of 2024.

The manufacturing weakness of the United States is also a problem because this should be a period of high growth, considering the opportunities generated all over the world. Industrial output bounced 0.8 percent in February, but the January figure was revised to a larger 1.1 percent slump. If we factor in the decline in the Empire State survey, to -20.9 in March, it looks like the manufacturing decline will persist.

The shape of the U.S. economy also reflects the impossibility of the soft-landing narrative. Inflation remains well above target, and bond yields are reflecting the reality of persistent inflation. Furthermore, money supply growth stopped declining months ago.

If the money supply rises and government spending continues to rise, the Federal Reserve will be unable to cut interest rates, and the impoverishment of citizens by a loss of purchasing power will continue.

This is the result of an insane fiscal policy that increases spending and taxes. Weak growth, manufacturing decline, and worsening consumer confidence.

Demand-side policies and Keynesian experiments are leaving a once-strong economy on the same path as the eurozone: stagflation. A warning sign should be the fact that the increase in public debt completely justifies the gross domestic product recovery.

This is the problem of extraordinary monetary and fiscal experiments. Governments embrace massive spending and debt monetization under the premise that they will implement control policies if the warning signs appear, but when they do, they never stop spending. Economists close to the government said that the administration would reconsider and adjust its budget if inflation rose, and alarm bells rang. Now we have heard all the alarm bells, and the administration continues as if nothing happened. The Inflation Reduction Act became the Inflation Perpetuation Act; the rise in government borrowing is now evident in the 10- and 30-year curve; and the private sector is in an obvious contraction.

Trusting governments to moderate spending after an expenditure binge is simply an extremely dangerous bet that always ends with worse conditions for citizens. Once they start, they cannot stop, and the inevitable end is higher taxes, weaker growth, lower real wages, and a decline in the purchasing power of the dollar. All the figures in the U.S. economy scream “buy gold” because the government will always prefer to destroy the currency than to moderate the budget deficit and government size in the economy.

Tyler Durden Tue, 03/19/2024 - 06:30

Read More

Continue Reading

Uncategorized

When words make you sick

In a new book, experts in a variety of fields explore nocebo effects – how negative expectations concerning health can make a person sick. It is the…

Published

on

In a new book, experts in a variety of fields explore nocebo effects – how negative expectations concerning health can make a person sick. It is the first time a book has been written on this subject.

“I think it’s the idea that words really matter. It’s fascinating that how we communicate can affect the outcome. Communication in health care is perhaps more important than the patient recognises,” says Charlotte Blease, who is a researcher at the Department of Women’s and Children’s Health at Uppsala University. 
Along with colleagues at Brown University in the United States and the University of Zurich in Switzerland she has written the book “The Nocebo Effect: When Words Make You Sick”. Nocebo is sometimes called the placebo’s evil twin. A placebo effect occurs when a patient thinks they feel better because of receiving medicine and part of that perception is due not to the drug but to positive expectations. The concept of the nocebo effect means that harmful things can happen because a person expects it – unconsciously or consciously. This is the first time the phenomenon has been addressed in a scholarly book. Researchers in medicine, history, culture, psychology and philosophy have examined it, each in their own particular area. 

Credit: Catherine Blease

In a new book, experts in a variety of fields explore nocebo effects – how negative expectations concerning health can make a person sick. It is the first time a book has been written on this subject.

“I think it’s the idea that words really matter. It’s fascinating that how we communicate can affect the outcome. Communication in health care is perhaps more important than the patient recognises,” says Charlotte Blease, who is a researcher at the Department of Women’s and Children’s Health at Uppsala University. 
Along with colleagues at Brown University in the United States and the University of Zurich in Switzerland she has written the book “The Nocebo Effect: When Words Make You Sick”. Nocebo is sometimes called the placebo’s evil twin. A placebo effect occurs when a patient thinks they feel better because of receiving medicine and part of that perception is due not to the drug but to positive expectations. The concept of the nocebo effect means that harmful things can happen because a person expects it – unconsciously or consciously. This is the first time the phenomenon has been addressed in a scholarly book. Researchers in medicine, history, culture, psychology and philosophy have examined it, each in their own particular area. 

“It’s a very new field, an emerging discipline. Even if the nocebo effect is documented far back in history, it perhaps became especially obvious during the coronavirus pandemic,” Blease says.

A previous study of patients during the pandemic (see below) shows that as many as three quarters of the reported side-effects of the coronavirus vaccine may be due to the nocebo effect. The study involved more than 45,000 participants, approximately half of whom were injected with a saline solution instead of the vaccine but despite this still experienced many side-effects such as nausea and headache. In the book, the authors highlight that one issue that disappeared in the discussion of side-effects during the coronavirus pandemic was that many of these were actually due to the nocebo effect.

“Whether this is due to expectations – the nocebo effect – remains to be understood. However, it is curious that so many participants reported side-effects after receiving no vaccine. Regardless, some people may have been put off by what they heard about side-effects,” Blease comments.


Read More

Continue Reading

Uncategorized

Manufacturing and construction vs. the still-inverted yield curve

  – by New Deal democratProf. Menzie Chinn at Econbrowser makes the point that the yield curve is still inverted, and has not yet eclipsed the longest…

Published

on


 - by New Deal democrat


Prof. Menzie Chinn at Econbrowser makes the point that the yield curve is still inverted, and has not yet eclipsed the longest previous time between onset of such an inversion and a recession. So he believes the threat of recession is still on the table.


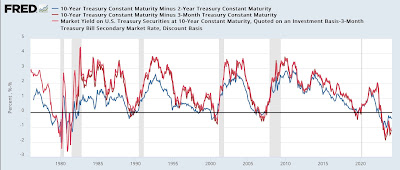
And he’s correct about the yield curve, although it is getting very long in the tooth. In the past half century, the shortest time between a 10 minus 2 year inversion (blue in the graph below) to recession has been 10 months (1980) and the longest 22 months (2007). For the 10 year minus 3 month inversion (red), the shortest time has been 8 months (1980 and 2001) and the longest has been 17 months (2007):


At present the former yield curve has been inverted for 20.5 months, and the latter for 16.5 months. So if there is no recession by May 1, we’re in uncharted territory as far as the yield curve indicator is concerned.

My view for the past half year or so has been much more cautious. While there has been nearly unprecedented Fed tightening (only the 1980-81 tightening was more severe), on the other hand there was massive pandemic stimulus, and what I described on some occasions as a “hurricane force tailwind” of supply chain unkinking. If the two positive forces have abated, does the negative force of the Fed tightening, which is still in place, now take precedence? Or because interest rates have plateaued in the past year, is it too something of a spent force? Since I confess not to know, because the situation is unprecedented in the modern era for which most data is available, I have highlighted turning to the short leading metrics. Do they remain steady or improve? Or do they deteriorate as they have before prior recessions?

First of all, let me show the NY Fed’s Global Supply Chain Index, which attempts to disaggregate supply sided information from demand side information. A positive value shows relative tightening, a negative loosening:


You can see the huge pandemic tightening in 2020 into 2022, followed by a similarly large loosening through 2023. For the past few months, the Index has been close to neutral, or shown very slight tightness.

Typically in the past Fed tightenings have operated through two main channels: housing and manufacturing, especially durable goods manufacturing.

Let’s take the two in reverse order.

Manufacturing has at very least stalled, and by some measures turned down to recessionary levels.  Last week I discussed industrial production (not shown), which peaked in late 2022 and has continued to trend sideways to slightly negative right through February.

A very good harbinger with a record going back 75 years has been the ISM manufacturing index. Here’s its historical record through about 10 years ago (when FRED discontinued publishing it):


And here is its record for the past several years:


This index was frankly recessionary for almost all of last year. It is still negative, although not so much as before.

Two other metrics with lengthy records are the average hourly workweek in manufacturing (blue, right scale), which is one of the 10 “official” leading indicators, as well as real spending on durable goods (red, measured YoY for ease of comparison, left scale):


As a general rule, if real spending on durable goods turns negative YoY for more than an isolated month, a recession has started (with the peak in absolute terms coming before). Also, since employers generally cut hours before cutting jobs, a decline of about 0.8% of an hour in the average manufacturing workweek has typically preceded a recession - with the caveat in modern times that it must fall to at least roughly 40.5 hours:


The average manufacturing workweek has met the former criteria for the last 9 months, and the latter since November. By contrast, real spending on durable goods was up 0.7% YoY as of the last report for January, and in December had made an all-time record high.

But if some of the manufacturing data has met the historical criteria for a recession warning, it is important to note that manufacturing is less of US GDP than before the year 2000, and had been down more in 2015-16 without a recession occurring.

Further, housing construction has not meaningfully constricted at all. The below graph shows the leading metric of housing permits (another “official” component of the LEI, right scale), together with housing units under construction (gold, *1.2 for scale, right scale), and also real GDP q/q (red, left scale):


Housing permits declined -30% after the Fed began tightening, which has normally been enough to trigger a recession. *BUT* the actual measure of economic activity, housing units under construction, has barely turned down at all. In comparison to past downturns, where typically it had fallen at least 10%, and more often 20%, before a recession had begun, as of last month it was only 2% off peak!

The only other two occasions where housing permits declined comparably with no recession ensuing - 1966 and 1986 - real gross domestic product increased robustly. This was similarly the case in 2023.

An important reason is the other historical reason proppin up expansions: stimulative government spending. Here’s the historical record comparing fiscal surpluses vs. deficits:


Note the abrupt end of stimulative spending in 1937, normally thought to have been the prime driver of the steep 1938 recession. Note also the big “Great Society” stimulative spending in 1966-68, when a downturn was averted (indeed, although not shown in the first graph above, there was an inverted yield curve then as well). Needless to say, there as been a great deal of stimulative fiscal spending since 2020 as well.

Fed tightening typically works by constricting demand. Both government stimulus and the unkinking of supply chains work to stimulate supply. 

All of which leads to the conclusion that, while manufacturing has reacted to the tightening, the *real* measure of construction activity has not, or not sufficiently to be recessionary.

Tomorrow housing permits, starts, and units under construction will all be updated. Unless there is a sharp decline in units under construction, there is no short term recession signal at all.

Read More

Continue Reading

Trending