Connect with us

Uncategorized

Dairy-based beverages market size to grow by USD 41.95 billion, Growth opportunities led by Agropur dairy cooperative and Arla Foods amba – Technavio

Dairy-based beverages market size to grow by USD 41.95 billion, Growth opportunities led by Agropur dairy cooperative and Arla Foods amba – Technavio
PR Newswire
NEW YORK, Jan. 18, 2023

NEW YORK, Jan. 18, 2023 /PRNewswire/ — The dairy-based bevera…

Published

on

Dairy-based beverages market size to grow by USD 41.95 billion, Growth opportunities led by Agropur dairy cooperative and Arla Foods amba - Technavio

PR Newswire

NEW YORK, Jan. 18, 2023 /PRNewswire/ -- The dairy-based beverages market is fragmented, characterized by the presence of many established vendors. The market is witnessing a significant level of competition among global and local vendors that provide a range of dairy-based beverage products. Global vendors are already established in the market, with numerous offerings to cater to the growing demand of consumers worldwide. Hence, regional vendors may find it difficult to establish themselves in the global market and compete with established vendors in terms of quality and variety. Established vendors are also focusing on widening their customer base in diversified geographies across the world.

The dairy-based beverages market size is forecasted to grow by USD 41.95 billion during the forecast period. The growth momentum of the market is estimated to accelerate at a CAGR of 5.66% from 2022 to 2027, according to Technavio.

Request the latest PDF sample report

Why buy?

  • Add credibility to strategies
  • Analyze competitor's offerings
  • Get a holistic view of the market

Grow your profit margins with Technavio- Buy the report

Dairy-based beverages market  2023-2027: Scope

The Dairy-based beverages market  report covers the following areas:

Dairy-based beverages market  2023-2027: Segmentation

  • Type 
    • Milk - The primary factors driving the segment growth are rapid growth in urbanization, the increasing prevalence of osteoporosis among women, the increasing awareness of healthy food habits, the rising availability of organic milk, and the increasing presence of global vendors of milk. Vendors such as Nestle SA (Nestle), and Fonterra Co-operative Group Ltd. and (Fonterra Co-operative Group) offer milk as one of the dairy-based beverage products. Furthermore, organic milk is also available in the market. It contains high levels of nutrients and omega-3 fatty acids, and it is free from pesticides and antibiotics. Therefore, such factors will boost segment growth during the forecast period.
    • Yogurt
    • Kefir
    • Others
  • Distribution Channel
    • Supermarkets/hypermarkets
    • Convenience stores
    • Online retail
    • Others
  • Geography 
    • APAC - APAC is estimated to account for 35% of the growth of the global market during the forecast period. The factors that are responsible for the growth of the market in Europe include growing urbanization, the rising adoption of healthy food habits to reduce the chances of developing bone diseases, increasing awareness about organic products, the growing demand for online shopping of dairy products, and the presence of prominent vendors. Furthermore, as women are at a higher risk of developing osteoporosis, the high percentage of the female population drives the consumption of dairy products to ensure proper calcium intake, which, in turn, is fostering the growth of the market in Europe. 
    • North America
    • Europe
    • South America
    • Middle East And Africa

Dairy-based beverages market  2023-2027: Vendor analysis

Agri Mark Inc., Agropur Dairy Cooperative, Arla Foods amba, Calidad Pascual SAU, Chobani Global Holdings LLC, Chr Hansen Holding AS, Dairy Farmers of America Inc., Fonterra Cooperative Group Ltd., General Mills Inc., Interfood Corp., Kerry Group Plc, KKR and Co. Inc., Morinaga Milk Industry Co. Ltd., Nestle SA, Organic Valley, Schreiber Foods Inc., The Kraft Heinz Co., The Wadia Group, Uelzena Group, and Danone SA are among some of the major market participants.

Request a PDF sample now

Dairy-based beverages market  2023-2027: Key highlights

  • CAGR of the market during the forecast period 2023-2027
  • Detailed information on factors that will assist dairy-based beverages market  growth during the next five years
  • Estimation of the dairy-based beverages market  size and its contribution to the parent market
  • Predictions on upcoming trends and changes in consumer behavior
  • The growth of the dairy-based beverages market
  • Analysis of the market's competitive landscape and detailed information on vendors
  • Comprehensive details of factors that will challenge the growth of the dairy-based beverages market, vendors

Subscribe to our "Basic Plan" billed annually at USD 5000 that enables you to download 5 reports and view 100 reports every month

Related Reports

The dairy ingredients market share is forecasted to grow by USD 29.36 billion from 2022 to 2027 at a progressing CAGR of 7.3%. The rising consumption of bakery and confectionery products is notably driving the market growth, although factors such as the rising vegan population may impede the market growth.

The packaged turmeric-based beverages market share is expected to increase by USD 446.08 million from 2021 to 2026, and the market's growth momentum will accelerate at a CAGR of 11.75%. The health benefits of turmeric is notably driving the packaged turmeric-based beverages market growth, although factors such as the increase in demand for substitute products may impede the market growth.

Report Coverage

Details

Page number

163

Base year

2022

Historic period

2017-2021

Forecast period

2023-2027

Growth momentum & CAGR

Accelerate at a CAGR of 5.66%

Market growth 2023-2027

USD 41.95 billion

Market structure

Fragmented

YoY growth 2022-2023(%)

5.43

Regional analysis

Europe, North America, APAC, South America, and Middle East and Africa

Performing market contribution

APAC at 35%

Key countries

US, Canada, India, UK, and Germany

Competitive landscape

Leading Vendors, Market Positioning of Vendors, Competitive Strategies, and Industry Risks

Key companies profiled

Agri Mark Inc., Agropur Dairy Cooperative, Arla Foods amba, Calidad Pascual SAU, Chobani Global Holdings LLC, Chr Hansen Holding AS, Dairy Farmers of America Inc., Fonterra Cooperative Group Ltd., General Mills Inc., Interfood Corp., Kerry Group Plc, KKR and Co. Inc., Morinaga Milk Industry Co. Ltd., Nestle SA, Organic Valley, Schreiber Foods Inc., The Kraft Heinz Co., The Wadia Group, Uelzena Group, and Danone SA

Market dynamics

Parent market analysis, Market growth inducers and obstacles, Fast-growing and slow-growing segment analysis, COVID-19 impact and recovery analysis and future consumer dynamics, and Market condition analysis for the forecast period.

Customization purview

If our report has not included the data that you are looking for, you can reach out to our analysts and get segments customized.

Table of Contents:

1 Executive Summary

  • 1.1 Market overview 
    • Exhibit 01: Executive Summary – Chart on Market Overview
    • Exhibit 02: Executive Summary – Data Table on Market Overview
    • Exhibit 03: Executive Summary – Chart on Global Market Characteristics
    • Exhibit 04: Executive Summary – Chart on Market by Geography
    • Exhibit 05: Executive Summary – Chart on Market Segmentation by Type
    • Exhibit 06: Executive Summary – Chart on Market Segmentation by Distribution Channel
    • Exhibit 07: Executive Summary – Chart on Incremental Growth
    • Exhibit 08: Executive Summary – Data Table on Incremental Growth
    • Exhibit 09: Executive Summary – Chart on Vendor Market Positioning

2 Market Landscape

  • 2.1 Market ecosystem 
    • Exhibit 10: Parent market
    • Exhibit 11: Market Characteristics

3 Market Sizing

  • 3.1 Market definition 
    • Exhibit 12: Offerings of vendors included in the market definition
  • 3.2 Market segment analysis 
    • Exhibit 13: Market segments
  • 3.3 Market size 2022
  • 3.4 Market outlook: Forecast for 2022-2027 
    • Exhibit 14: Chart on Global - Market size and forecast 2022-2027 ($ billion)
    • Exhibit 15: Data Table on Global - Market size and forecast 2022-2027 ($ billion)
    • Exhibit 16: Chart on Global Market: Year-over-year growth 2022-2027 (%)
    • Exhibit 17: Data Table on Global Market: Year-over-year growth 2022-2027 (%)

4 Historic Market Size

  • 4.1 Global dairy based beverages market 2017 - 2021
    • Exhibit 18: Historic Market Size – Data Table on Global dairy based beverages market 2017 - 2021 ($ billion)
  • 4.2 Type Segment Analysis 2017 - 2021 
    • Exhibit 19: Historic Market Size – Type Segment 2017 - 2021 ($ billion)
  • 4.3 Distribution channel Segment Analysis 2017 - 2021
    • Exhibit 20: Historic Market Size – Distribution channel Segment 2017 - 2021 ($ billion)
  • 4.4 Geography Segment Analysis 2017 - 2021 
    • Exhibit 21: Historic Market Size – Geography Segment 2017 - 2021 ($ billion)
  • 4.5 Country Segment Analysis 2017 - 2021 
    • Exhibit 22: Historic Market Size – Country Segment 2017 - 2021 ($ billion)

5 Five Forces Analysis

  • 5.1 Five forces summary 
    • Exhibit 23: Five forces analysis - Comparison between 2022 and 2027
  • 5.2 Bargaining power of buyers 
    • Exhibit 24: Chart on Bargaining power of buyers – Impact of key factors 2022 and 2027
  • 5.3 Bargaining power of suppliers 
    • Exhibit 25: Bargaining power of suppliers – Impact of key factors in 2022 and 2027
  • 5.4 Threat of new entrants 
    • Exhibit 26: Threat of new entrants – Impact of key factors in 2022 and 2027
  • 5.5 Threat of substitutes 
    • Exhibit 27: Threat of substitutes – Impact of key factors in 2022 and 2027
  • 5.6 Threat of rivalry 
    • Exhibit 28: Threat of rivalry – Impact of key factors in 2022 and 2027
  • 5.7 Market condition 
    • Exhibit 29: Chart on Market condition - Five forces 2022 and 2027

6 Market Segmentation by Type

  • 6.1 Market segments 
    • Exhibit 30: Chart on Type - Market share 2022-2027 (%)
    • Exhibit 31: Data Table on Type - Market share 2022-2027 (%)
  • 6.2 Comparison by Type 
    • Exhibit 32: Chart on Comparison by Type
    • Exhibit 33: Data Table on Comparison by Type
  • 6.3 Milk - Market size and forecast 2022-2027
    • Exhibit 34: Chart on Milk - Market size and forecast 2022-2027 ($ billion)
    • Exhibit 35: Data Table on Milk - Market size and forecast 2022-2027 ($ billion)
    • Exhibit 36: Chart on Milk - Year-over-year growth 2022-2027 (%)
    • Exhibit 37: Data Table on Milk - Year-over-year growth 2022-2027 (%)
  • 6.4 Yogurt - Market size and forecast 2022-2027
    • Exhibit 38: Chart on Yogurt - Market size and forecast 2022-2027 ($ billion)
    • Exhibit 39: Data Table on Yogurt - Market size and forecast 2022-2027 ($ billion)
    • Exhibit 40: Chart on Yogurt - Year-over-year growth 2022-2027 (%)
    • Exhibit 41: Data Table on Yogurt - Year-over-year growth 2022-2027 (%)
  • 6.5 Kefir - Market size and forecast 2022-2027
    • Exhibit 42: Chart on Kefir - Market size and forecast 2022-2027 ($ billion)
    • Exhibit 43: Data Table on Kefir - Market size and forecast 2022-2027 ($ billion)
    • Exhibit 44: Chart on Kefir - Year-over-year growth 2022-2027 (%)
    • Exhibit 45: Data Table on Kefir - Year-over-year growth 2022-2027 (%)
  • 6.6 Others - Market size and forecast 2022-2027
    • Exhibit 46: Chart on Others - Market size and forecast 2022-2027 ($ billion)
    • Exhibit 47: Data Table on Others - Market size and forecast 2022-2027 ($ billion)
    • Exhibit 48: Chart on Others - Year-over-year growth 2022-2027 (%)
    • Exhibit 49: Data Table on Others - Year-over-year growth 2022-2027 (%)
  • 6.7 Market opportunity by Type 
    • Exhibit 50: Market opportunity by Type ($ billion)

7 Market Segmentation by Distribution Channel

  • 7.1 Market segments 
    • Exhibit 51: Chart on Distribution Channel - Market share 2022-2027 (%)
    • Exhibit 52: Data Table on Distribution Channel - Market share 2022-2027 (%)
  • 7.2 Comparison by Distribution Channel 
    • Exhibit 53: Chart on Comparison by Distribution Channel
    • Exhibit 54: Data Table on Comparison by Distribution Channel
  • 7.3 Supermarkets/Hypermarkets - Market size and forecast 2022-2027 
    • Exhibit 55: Chart on Supermarkets/Hypermarkets - Market size and forecast 2022-2027 ($ billion)
    • Exhibit 56: Data Table on Supermarkets/Hypermarkets - Market size and forecast 2022-2027 ($ billion)
    • Exhibit 57: Chart on Supermarkets/Hypermarkets - Year-over-year growth 2022-2027 (%)
    • Exhibit 58: Data Table on Supermarkets/Hypermarkets - Year-over-year growth 2022-2027 (%)
  • 7.4 Convenience stores - Market size and forecast 2022-2027
    • Exhibit 59: Chart on Convenience stores - Market size and forecast 2022-2027 ($ billion)
    • Exhibit 60: Data Table on Convenience stores - Market size and forecast 2022-2027 ($ billion)
    • Exhibit 61: Chart on Convenience stores - Year-over-year growth 2022-2027 (%)
    • Exhibit 62: Data Table on Convenience stores - Year-over-year growth 2022-2027 (%)
  • 7.5 Online retail - Market size and forecast 2022-2027
    • Exhibit 63: Chart on Online retail - Market size and forecast 2022-2027 ($ billion)
    • Exhibit 64: Data Table on Online retail - Market size and forecast 2022-2027 ($ billion)
    • Exhibit 65: Chart on Online retail - Year-over-year growth 2022-2027 (%)
    • Exhibit 66: Data Table on Online retail - Year-over-year growth 2022-2027 (%)
  • 7.6 Others - Market size and forecast 2022-2027
    • Exhibit 67: Chart on Others - Market size and forecast 2022-2027 ($ billion)
    • Exhibit 68: Data Table on Others - Market size and forecast 2022-2027 ($ billion)
    • Exhibit 69: Chart on Others - Year-over-year growth 2022-2027 (%)
    • Exhibit 70: Data Table on Others - Year-over-year growth 2022-2027 (%)
  • 7.7 Market opportunity by Distribution Channel
    • Exhibit 71: Market opportunity by Distribution Channel ($ billion)

8 Customer Landscape

  • 8.1 Customer landscape overview 
    • Exhibit 72: Analysis of price sensitivity, lifecycle, customer purchase basket, adoption rates, and purchase criteria

9 Geographic Landscape

  • 9.1 Geographic segmentation 
    • Exhibit 73: Chart on Market share by geography 2022-2027 (%)
    • Exhibit 74: Data Table on Market share by geography 2022-2027 (%)
  • 9.2 Geographic comparison 
    • Exhibit 75: Chart on Geographic comparison
    • Exhibit 76: Data Table on Geographic comparison
  • 9.3 Europe - Market size and forecast 2022-2027
    • Exhibit 77: Chart on Europe - Market size and forecast 2022-2027 ($ billion)
    • Exhibit 78: Data Table on Europe - Market size and forecast 2022-2027 ($ billion)
    • Exhibit 79: Chart on Europe - Year-over-year growth 2022-2027 (%)
    • Exhibit 80: Data Table on Europe - Year-over-year growth 2022-2027 (%)
  • 9.4 North America - Market size and forecast 2022-2027
    • Exhibit 81: Chart on North America - Market size and forecast 2022-2027 ($ billion)
    • Exhibit 82: Data Table on North America - Market size and forecast 2022-2027 ($ billion)
    • Exhibit 83: Chart on North America - Year-over-year growth 2022-2027 (%)
    • Exhibit 84: Data Table on North America - Year-over-year growth 2022-2027 (%)
  • 9.5 APAC - Market size and forecast 2022-2027
    • Exhibit 85: Chart on APAC - Market size and forecast 2022-2027 ($ billion)
    • Exhibit 86: Data Table on APAC - Market size and forecast 2022-2027 ($ billion)
    • Exhibit 87: Chart on APAC - Year-over-year growth 2022-2027 (%)
    • Exhibit 88: Data Table on APAC - Year-over-year growth 2022-2027 (%)
  • 9.6 South America - Market size and forecast 2022-2027
    • Exhibit 89: Chart on South America - Market size and forecast 2022-2027 ($ billion)
    • Exhibit 90: Data Table on South America - Market size and forecast 2022-2027 ($ billion)
    • Exhibit 91: Chart on South America - Year-over-year growth 2022-2027 (%)
    • Exhibit 92: Data Table on South America - Year-over-year growth 2022-2027 (%)
  • 9.7 Middle East and Africa - Market size and forecast 2022-2027 
    • Exhibit 93: Chart on Middle East and Africa - Market size and forecast 2022-2027 ($ billion)
    • Exhibit 94: Data Table on Middle East and Africa - Market size and forecast 2022-2027 ($ billion)
    • Exhibit 95: Chart on Middle East and Africa - Year-over-year growth 2022-2027 (%)
    • Exhibit 96: Data Table on Middle East and Africa - Year-over-year growth 2022-2027 (%)
  • 9.8 US - Market size and forecast 2022-2027
    • Exhibit 97: Chart on US - Market size and forecast 2022-2027 ($ billion)
    • Exhibit 98: Data Table on US - Market size and forecast 2022-2027 ($ billion)
    • Exhibit 99: Chart on US - Year-over-year growth 2022-2027 (%)
    • Exhibit 100: Data Table on US - Year-over-year growth 2022-2027 (%)
  • 9.9 India - Market size and forecast 2022-2027
    • Exhibit 101: Chart on India - Market size and forecast 2022-2027 ($ billion)
    • Exhibit 102: Data Table on India - Market size and forecast 2022-2027 ($ billion)
    • Exhibit 103: Chart on India - Year-over-year growth 2022-2027 (%)
    • Exhibit 104: Data Table on India - Year-over-year growth 2022-2027 (%)
  • 9.10 UK - Market size and forecast 2022-2027
    • Exhibit 105: Chart on UK - Market size and forecast 2022-2027 ($ billion)
    • Exhibit 106: Data Table on UK - Market size and forecast 2022-2027 ($ billion)
    • Exhibit 107: Chart on UK - Year-over-year growth 2022-2027 (%)
    • Exhibit 108: Data Table on UK - Year-over-year growth 2022-2027 (%)
  • 9.11 Germany - Market size and forecast 2022-2027
    • Exhibit 109: Chart on Germany - Market size and forecast 2022-2027 ($ billion)
    • Exhibit 110: Data Table on Germany - Market size and forecast 2022-2027 ($ billion)
    • Exhibit 111: Chart on Germany - Year-over-year growth 2022-2027 (%)
    • Exhibit 112: Data Table on Germany - Year-over-year growth 2022-2027 (%)
  • 9.12 Canada - Market size and forecast 2022-2027
    • Exhibit 113: Chart on Canada - Market size and forecast 2022-2027 ($ billion)
    • Exhibit 114: Data Table on Canada - Market size and forecast 2022-2027 ($ billion)
    • Exhibit 115: Chart on Canada - Year-over-year growth 2022-2027 (%)
    • Exhibit 116: Data Table on Canada - Year-over-year growth 2022-2027 (%)
  • 9.13 Market opportunity by geography 
    • Exhibit 117: Market opportunity by geography ($ billion)

10 Drivers, Challenges, and Trends

  • 10.1 Market drivers
  • 10.2 Market challenges
  • 10.3 Impact of drivers and challenges 
    • Exhibit 118: Impact of drivers and challenges in 2022 and 2027
  • 10.4 Market trends

11 Vendor Landscape

  • 11.1 Overview
  • 11.2 Vendor landscape 
    • Exhibit 119: Overview on Criticality of inputs and Factors of differentiation
  • 11.3 Landscape disruption 
    • Exhibit 120: Overview on factors of disruption
  • 11.4 Industry risks 
    • Exhibit 121: Impact of key risks on business

12 Vendor Analysis

  • 12.1 Vendors covered 
    • Exhibit 122: Vendors covered
  • 12.2 Market positioning of vendors 
    • Exhibit 123: Matrix on vendor position and classification
  • 12.3 Agri Mark Inc. 
    • Exhibit 124: Agri Mark Inc. - Overview
    • Exhibit 125: Agri Mark Inc. - Product / Service
    • Exhibit 126: Agri Mark Inc. - Key offerings
  • 12.4 Arla Foods amba 
    • Exhibit 127: Arla Foods amba - Overview
    • Exhibit 128: Arla Foods amba - Business segments
    • Exhibit 129: Arla Foods amba - Key offerings
    • Exhibit 130: Arla Foods amba - Segment focus
  • 12.5 Chobani Global Holdings LLC 
    • Exhibit 131: Chobani Global Holdings LLC - Overview
    • Exhibit 132: Chobani Global Holdings LLC - Product / Service
    • Exhibit 133: Chobani Global Holdings LLC - Key offerings
  • 12.6 Chr Hansen Holding AS 
    • Exhibit 134: Chr Hansen Holding AS - Overview
    • Exhibit 135: Chr Hansen Holding AS - Business segments
    • Exhibit 136: Chr Hansen Holding AS - Key news
    • Exhibit 137: Chr Hansen Holding AS - Key offerings
    • Exhibit 138: Chr Hansen Holding AS - Segment focus
  • 12.7 Dairy Farmers of America Inc. 
    • Exhibit 139: Dairy Farmers of America Inc. - Overview
    • Exhibit 140: Dairy Farmers of America Inc. - Product / Service
    • Exhibit 141: Dairy Farmers of America Inc. - Key offerings
  • 12.8 Danone SA 
    • Exhibit 142: Danone SA - Overview
    • Exhibit 143: Danone SA - Business segments
    • Exhibit 144: Danone SA - Key news
    • Exhibit 145: Danone SA - Key offerings
    • Exhibit 146: Danone SA - Segment focus
  • 12.9 General Mills Inc. 
    • Exhibit 147: General Mills Inc. - Overview
    • Exhibit 148: General Mills Inc. - Business segments
    • Exhibit 149: General Mills Inc. - Key news
    • Exhibit 150: General Mills Inc. - Key offerings
    • Exhibit 151: General Mills Inc. - Segment focus
  • 12.10 Interfood Corp. 
    • Exhibit 152: Interfood Corp. - Overview
    • Exhibit 153: Interfood Corp. - Product / Service
    • Exhibit 154: Interfood Corp. - Key offerings
  • 12.11 Kerry Group Plc 
    • Exhibit 155: Kerry Group Plc - Overview
    • Exhibit 156: Kerry Group Plc - Business segments
    • Exhibit 157: Kerry Group Plc - Key offerings
    • Exhibit 158: Kerry Group Plc - Segment focus
  • 12.12 Morinaga Milk Industry Co. Ltd. 
    • Exhibit 159: Morinaga Milk Industry Co. Ltd. - Overview
    • Exhibit 160: Morinaga Milk Industry Co. Ltd. - Product / Service
    • Exhibit 161: Morinaga Milk Industry Co. Ltd. - Key offerings
  • 12.13 Nestle SA 
    • Exhibit 162: Nestle SA - Overview
    • Exhibit 163: Nestle SA - Business segments
    • Exhibit 164: Nestle SA - Key news
    • Exhibit 165: Nestle SA - Key offerings
    • Exhibit 166: Nestle SA - Segment focus
  • 12.14 Schreiber Foods Inc. 
    • Exhibit 167: Schreiber Foods Inc. - Overview
    • Exhibit 168: Schreiber Foods Inc. - Product / Service
    • Exhibit 169: Schreiber Foods Inc. - Key offerings
  • 12.15 The Kraft Heinz Co. 
    • Exhibit 170: The Kraft Heinz Co. - Overview
    • Exhibit 171: The Kraft Heinz Co. - Business segments
    • Exhibit 172: The Kraft Heinz Co. - Key offerings
    • Exhibit 173: The Kraft Heinz Co. - Segment focus
  • 12.16 The Wadia Group 
    • Exhibit 174: The Wadia Group - Overview
    • Exhibit 175: The Wadia Group - Key offerings
  • 12.17 Uelzena Group 
    • Exhibit 176: Uelzena Group - Overview
    • Exhibit 177: Uelzena Group - Product / Service
    • Exhibit 178: Uelzena Group - Key offerings

13 Appendix

  • 13.1 Scope of the report
  • 13.2 Inclusions and exclusions checklist 
    • Exhibit 179: Inclusions checklist
    • Exhibit 180: Exclusions checklist
  • 13.3 Currency conversion rates for US$ 
    • Exhibit 181: Currency conversion rates for US$
  • 13.4 Research methodology 
    • Exhibit 182: Research methodology
    • Exhibit 183: Validation techniques employed for market sizing
    • Exhibit 184: Information sources
  • 13.5 List of abbreviations 
    • Exhibit 185: List of abbreviations
About Us

Technavio is a leading global technology research and advisory company. Their research and analysis focus on emerging market trends and provide actionable insights to help businesses identify market opportunities and develop effective strategies to optimize their market positions. With over 500 specialized analysts, Technavio's report library consists of more than 17,000 reports and counting, covering 800 technologies, spanning across 50 countries. Their client base consists of enterprises of all sizes, including more than 100 Fortune 500 companies. This growing client base relies on Technavio's comprehensive coverage, extensive research, and actionable market insights to identify opportunities in existing and potential markets and assess their competitive positions within changing market scenarios.

Contact

Technavio Research
Jesse Maida
Media & Marketing Executive
US: +1 844 364 1100
UK: +44 203 893 3200
Email: media@technavio.com
Website: www.technavio.com/

View original content to download multimedia:https://www.prnewswire.com/news-releases/dairy-based-beverages-market-size-to-grow-by-usd-41-95-billion-growth-opportunities-led-by-agropur-dairy-cooperative-and-arla-foods-amba---technavio-301723104.html

SOURCE Technavio

Read More

Continue Reading

Uncategorized

Another airline is making lounge fees more expensive

Qantas Airways is increasing the price of accessing its network of lounges by as much as 17%.

Published

on

Over the last two years, multiple airlines have dealt with crowding in their lounges. While they are designed as a luxury experience for a small subset of travelers, high numbers of people taking a trip post-pandemic as well as the different ways they are able to gain access through status or certain credit cards made it difficult for some airlines to keep up with keeping foods stocked, common areas clean and having enough staff to serve bar drinks at the rate that customers expect them.

In the fall of 2023, Delta Air Lines  (DAL)  caught serious traveler outcry after announcing that it was cracking down on crowding by raising how much one needs to spend for lounge access and limiting the number of times one can enter those lounges.

Related: Competitors pushed Delta to backtrack on its lounge and loyalty program changes

Some airlines saw the outcry with Delta as their chance to reassure customers that they would not raise their fees while others waited for the storm to pass to quietly implement their own increases.

A photograph captures a Qantas Airways lounge in Sydney, Australia.

Shutterstock

This is how much more you'll have to pay for Qantas lounge access

Australia's flagship carrier Qantas Airways  (QUBSF)  is the latest airline to announce that it would raise the cost accessing the 24 lounges across the country as well as the 600 international lounges available at airports across the world through partner airlines.

More Travel:

Unlike other airlines which grant access primarily after reaching frequent flyer status, Qantas also sells it through a membership — starting from April 18, 2024, prices will rise from $600 Australian dollars ($392 USD)  to $699 AUD ($456 USD) for one year, $1,100 ($718 USD) to $1,299 ($848 USD) for two years and $2,000 AUD ($1,304) to lock in the rate for four years.

Those signing up for lounge access for the first time also currently pay a joining fee of $99 AUD ($65 USD) that will rise to $129 AUD ($85 USD).

The airline also allows customers to purchase their membership with Qantas Points they collect through frequent travel; the membership fees are also being raised by the equivalent amount in points in what adds up to as much as 17% — from 308,000 to 399,900 to lock in access for four years.

Airline says hikes will 'cover cost increases passed on from suppliers'

"This is the first time the Qantas Club membership fees have increased in seven years and will help cover cost increases passed on from a range of suppliers over that time," a Qantas spokesperson confirmed to Simple Flying. "This follows a reduction in the membership fees for several years during the pandemic."

The spokesperson said the gains from the increases will go both towards making up for inflation-related costs and keeping existing lounges looking modern by updating features like furniture and décor.

While the price increases also do not apply for those who earned lounge access through frequent flyer status or change what it takes to earn that status, Qantas is also introducing even steeper increases for those renewing a membership or adding additional features such as spouse and partner memberships.

In some cases, the cost of these features will nearly double from what members are paying now.

Read More

Continue Reading

Uncategorized

PR55α-controlled PP2A Inhibits p16 Expression and Blocks Cellular Senescence Induction

“Our results show that PR55α specifically reduces p16 expression […]” Credit: 2024 Palanivel et al. “Our results show that PR55α specifically…

Published

on

“Our results show that PR55α specifically reduces p16 expression […]”

Credit: 2024 Palanivel et al.

“Our results show that PR55α specifically reduces p16 expression […]”

BUFFALO, NY- March 19, 2024 – A new research paper was published in Aging (listed by MEDLINE/PubMed as “Aging (Albany NY)” and “Aging-US” by Web of Science) Volume 16, Issue 5, entitled, “PR55α-controlled protein phosphatase 2A inhibits p16 expression and blocks cellular senescence induction by γ-irradiation.”

Cellular senescence is a permanent cell cycle arrest that can be triggered by both internal and external genotoxic stressors, such as telomere dysfunction and DNA damage. The execution of senescence is mainly by two pathways, p16/RB and p53/p21, which lead to CDK4/6 inhibition and RB activation to block cell cycle progression. While the regulation of p53/p21 signaling in response to DNA damage and other insults is well-defined, the regulation of the p16/RB pathway in response to various stressors remains poorly understood. 

In this new study, researchers Chitra Palanivel, Lepakshe S. V. Madduri, Ashley L. Hein, Christopher B. Jenkins, Brendan T. Graff, Alison L. Camero, Sumin Zhou, Charles A. Enke, Michel M. Ouellette, and Ying Yan from the University of Nebraska Medical Center report a novel function of PR55α, a regulatory subunit of PP2A Ser/Thr phosphatase, as a potent inhibitor of p16 expression and senescence induction by ionizing radiation (IR), such as γ-rays. 

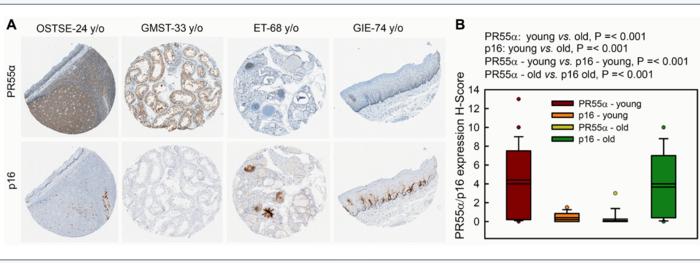
“During natural aging, there is a gradual accumulation of p16-expressing senescent cells in tissues [76]. To investigate the significance of PR55α in this up-regulation of p16, we compared levels of the p16 and PR55α proteins in a panel of normal tissue specimens derived from young (≤43 y/o) and old (≥68 y/o) donors.”

The results show that ectopic PR55α expression in normal pancreatic cells inhibits p16 transcription, increases RB phosphorylation, and blocks IR-induced senescence. Conversely, PR55α-knockdown by shRNA in pancreatic cancer cells elevates p16 transcription, reduces RB phosphorylation, and triggers senescence induction after IR. Furthermore, this PR55α function in the regulation of p16 and senescence is p53-independent because it was unaffected by the mutational status of p53. Moreover, PR55α only affects p16 expression but not p14 (ARF) expression, which is also transcribed from the same CDKN2A locus but from an alternative promoter. In normal human tissues, levels of p16 and PR55α proteins were inversely correlated and mutually exclusive. 

“Collectively, these results describe a novel function of PR55α/PP2A in blocking p16/RB signaling and IR-induced cellular senescence.”
 

Read the full paper: DOI: https://doi.org/10.18632/aging.205619 

Corresponding Authors: Michel M. Ouellette, Ying Yan

Corresponding Emails: mouellet@unmc.edu, yyan@unmc.edu

Keywords: p16, p14, CDKN2A locus, p53, RB, PR55α, PP2A, γ-irradiation

Click here to sign up for free Altmetric alerts about this article.


About Aging:

Aging publishes research papers in all fields of aging research including but not limited, aging from yeast to mammals, cellular senescence, age-related diseases such as cancer and Alzheimer’s diseases and their prevention and treatment, anti-aging strategies and drug development and especially the role of signal transduction pathways such as mTOR in aging and potential approaches to modulate these signaling pathways to extend lifespan. The journal aims to promote treatment of age-related diseases by slowing down aging, validation of anti-aging drugs by treating age-related diseases, prevention of cancer by inhibiting aging. Cancer and COVID-19 are age-related diseases.

Aging is indexed by PubMed/Medline (abbreviated as “Aging (Albany NY)”), PubMed Central, Web of Science: Science Citation Index Expanded (abbreviated as “Aging‐US” and listed in the Cell Biology and Geriatrics & Gerontology categories), Scopus (abbreviated as “Aging” and listed in the Cell Biology and Aging categories), Biological Abstracts, BIOSIS Previews, EMBASE, META (Chan Zuckerberg Initiative) (2018-2022), and Dimensions (Digital Science).

Please visit our website at www.Aging-US.com​​ and connect with us:

  • Facebook
  • X, formerly Twitter
  • Instagram
  • YouTube
  • LinkedIn
  • Reddit
  • Pinterest
  • Spotify, and available wherever you listen to podcasts


Click here to subscribe to Aging publication updates.

For media inquiries, please contact media@impactjournals.com.


Aging (Aging-US) Journal Office

6666 E. Quaker Str., Suite 1B

Orchard Park, NY 14127

Phone: 1-800-922-0957, option 1

###


Read More

Continue Reading

Uncategorized

Wall Street Bonuses Fall For Second Year To 2019 Lows Amid Capital Markets Freeze

Wall Street Bonuses Fall For Second Year To 2019 Lows Amid Capital Markets Freeze

Wall Street bonuses have declined for two consecutive years,…

Published

on

Wall Street Bonuses Fall For Second Year To 2019 Lows Amid Capital Markets Freeze

Wall Street bonuses have declined for two consecutive years, falling to levels last seen in 2019, according to the latest yearly figures released by New York State Comptroller Thomas P. DiNapoli. This trend is occurring amidst a multi-year downturn in capital markets due to the Federal Reserve's interest rate hiking cycle.

According to the report, the average Wall Street cash bonus fell 2% to $176,500 in 2023, the lowest level since 2019. The drop was far less than the 25% plunge in 2022. Last year's bonus pool was $33.8 billion, unchanged from the previous year but far less than the $42.7 billion during the stock market mania in 2021. 

Source: Bloomberg 

"Wall Street's average cash bonuses dipped slightly from last year, with continued market volatility and more people joining the securities workforce," DiNapoli said in a news release on Tuesday. 

He continued: "While these bonuses affect income tax revenues for the state and city, both budgeted for larger declines so the impact on projected revenues should be limited." 

"The securities industry's continued strength should not overshadow the broader economic picture in New York, where we need all sectors to enjoy full recovery from the pandemic," he added.

Despite the slump, the report said Wall Street's profits rose 1.8% last year, "but firms have taken a more cautious approach to compensation, and more employees have joined the securities industry, which accounts for the slight decline in the average bonus." 

The report showed the industry employed 198,500 people in 2023, up from 191,600 the prior year. This expansion occurred during a period when US banks laid off 23,000 jobs. 

Given that swaps traders and economists at Goldman Sachs Group are forecasting fewer Fed interest-rate cuts this year, a higher-for-longer rates environment will continue to discourage capital-market activity. 

There's about a 50% chance of a June cut. Over the last several months, the Fed's interest-rate target implied by overnight index swaps and SOFR futures went from 700bps of cuts to currently 292bps of cuts for the full year. 

Any delay in the easing cycle will only mean another year of depressed bonuses for Wall Street. 

Tyler Durden Tue, 03/19/2024 - 10:00

Read More

Continue Reading

Trending