Uncategorized
Cottonseed oil market size to grow by 965.24 thousand tons from 2022 to 2027: A descriptive analysis of customer landscape, vendor assessment, and market dynamics – Technavio
Cottonseed oil market size to grow by 965.24 thousand tons from 2022 to 2027: A descriptive analysis of customer landscape, vendor assessment, and market dynamics – Technavio
PR Newswire
NEW YORK, Jan. 23, 2023
NEW YORK, Jan. 23, 2023 /PRNewswire/ …
Share this:

Cottonseed oil market size to grow by 965.24 thousand tons from 2022 to 2027: A descriptive analysis of customer landscape, vendor assessment, and market dynamics - Technavio
PR Newswire
NEW YORK, Jan. 23, 2023
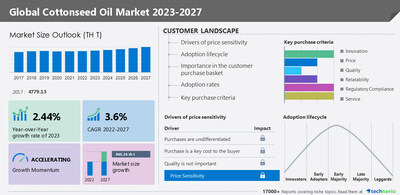
NEW YORK, Jan. 23, 2023 /PRNewswire/ -- The global cottonseed oil market size is estimated to increase by 965.24 thousand tons from 2022 to 2027. The market's growth momentum will accelerate at a CAGR of 3.6% during the forecast period - Request a sample report
Global cottonseed oil market – Vendor analysis
- Archer Daniels Midland Co. - The company offers cottonseed oil for frying, spray oil, baking, and industrial margarine.
- Aryan International - The company offers organic cottonseed oil for frying, and baking and can be used in processed food items such as mayonnaise, spicy dishes, and potato chips.
- Asha Cotton Industries - The company offers cottonseed oil under the brand called Asha.
- Bunge Ltd. - The company offers cottonseed oil used as margarine, edible oils, bakery and grain under various brands such as Dadla, Komili, Gagan, wholeharvest, Espiga, and El Maizal.
- For details on vendors and their offerings – Buy the report!
The global cottonseed oil market is fragmented, with the presence of several global as well as regional vendors. A few prominent vendors that offer cottonseed oil in the market are Archer Daniels Midland Co., Aryan International, Asha Cotton Industries, Authentic Oil Co., Bunge Ltd., Cargill Inc., Henry Lamotte Services GmbH, ITOCHU Corp., Matangi Cotton Industries, Oilseeds Australia Pty Ltd., PYCO Industries, S.R. Cotton, SULU ORGANICS Corp., Vimal Oil and Foods Ltd., Wilmar International Ltd., Gokul Refoils and Solvent Ltd., Louis Dreyfus Holding BV, and Oilseeds International Inc. and others.
The global cottonseed oil market is at its growing stage. Established vendors have started acquiring small and regional players to increase their global reach. Moreover, the market will witness the entry of several new players, which will intensify the competition among the existing players during the forecast period.
Global cottonseed oil market - Customer landscape
To help companies evaluate and develop growth strategies, the report outlines –
- Key purchase criteria
- Adoption rates
- Adoption lifecycle
- Drivers of price sensitivity
Global cottonseed oil market - Segmentation assessment
Technavio has segmented the market based on Product (GM cottonseed oil and Non-GM cottonseed oil) and Distribution channels (Offline and Online).
- The GM cottonseed oil segment will grow at a significant rate during the forecast period. The segment was the major contributor to the global cottonseed oil market in 2022. The segment is expected to witness a decline due to government restrictions in countries such as India, where the sales of GM cottonseed oil are prohibited for human consumption unless approved by the government. Various organizations in India test oil products to identify the mixture of unapproved components in the product. Most of such products did not have GM ingredients labeling on the product. Therefore, the factors mentioned above indicate that the sales of GM cottonseed oil products are expected to decline during the forecast period.
By geography, the global cottonseed oil market is segmented into APAC, Middle East and Africa, North America, South America, and Europe. The report provides actionable insights and estimates the contribution of all regions to the growth of the global cottonseed oil market.
- APAC will account for 80% of the market's growth during the forecast period. Cotton production in India is expected to increase during the forecast period due to special schemes such as intensive cotton production programs launched by the government. This will positively affect the cottonseed oil market in the region during the forecast period. The various use of cottonseed oil in other industries is also expected to increase the demand for cottonseed oil in the region during the forecast period. Cottonseed oil is used for developing biodiesel in APAC, and the use of biodiesel is expected to increase due to the depletion of fossil fuels globally.
Global Cottonseed Oil Market – Market Dynamics
Leading Drivers - The health benefits of cottonseed oil are the key factor driving the global cottonseed oil market growth. One of the growth drivers of the global cottonseed oil market is the increasing awareness among consumers about the health benefits of the consumption of cottonseed oil. For instance, Cottonseed oil is low in cholesterol content, making it popular among health-conscious consumers. Similarly, Cottonseed oil has a high smoke point, making it suitable for deep frying and cooking at high temperatures. It has a neutral taste, the taste depends on the ingredients added to it. Such factors will increase the market growth during the forecast period.
Key Trends - The availability of cold-pressed cottonseed oil is the primary trend in the global cottonseed oil market growth. The demand for cold-pressed cottonseed oil is increasing among consumers, and it is expected to remain high during the forecast period. The players in the market are also coming up with new cold-pressed cottonseed oil products. Cold pressing ensures that the product retains its natural antioxidants and natural odor and flavor. Cold pressing involves extracting the oils by pressing the fruits or seeds with a modern steel press. With increasing consumer preference for cold-pressed cottonseed oil, the global market is expected to witness high growth during the forecast period.
Major challenges - The easy availability of substitutes is a major challenge to the global cottonseed oil market growth. Cottonseed oil is widely used in cooking as it has healthy unsaturated fatty acids. Other types of vegetable oils, however, can be used as replacements for cottonseed oil in commercial and domestic cooking. Palm oil, olive oil, soybean oil, and canola oil are some alternatives to cottonseed oil. The availability of substitutes, therefore, can hamper the global cottonseed oil market during the forecast period.
What are the key data covered in this cottonseed oil market report?
- CAGR of the market during the forecast period
- Detailed information on factors that will drive the growth of the cottonseed oil market between 2023 and 2027
- Precise estimation of the cottonseed oil market size and its contribution to the market in focus on the parent market
- Accurate predictions about upcoming trends and changes in consumer behavior
- Growth of the cottonseed oil industry across APAC, Middle East and Africa, North America, South America, and Europe
- A thorough analysis of the market's competitive landscape and detailed information about vendors
- Comprehensive analysis of factors that will challenge the growth of cottonseed oil market vendors
Gain instant access to 17,000+ market research reports.
Technavio's SUBSCRIPTION platform
Related Reports:
The castor oil and its derivatives market share is expected to increase by USD 811.08 million from 2021 to 2026, and the market's growth momentum will accelerate at a CAGR of 4.94%. The increasing demand for castor oil and its derivatives in major end-use industries is notably driving the castor oil and its derivatives market growth, although factors such as fluctuations in castor oil prices caused by extreme dependence on climate may impede the market growth.
The ginger oil market share is expected to increase to USD 77.2 million from 2021 to 2026, and the market's growth momentum will accelerate at a CAGR of 9.77%. The perceived health benefits associated with ginger oil is notably driving the ginger oil market growth, although factors such as stringent regulations on the labeling of ginger oil may impede the market growth.
Cottonseed Oil Market Scope | |
Report Coverage | Details |
Page number | 162 |
Base year | 2022 |
Historic period | 2017-2021 |
Forecast period | 2023-2027 |
Growth momentum & CAGR | Accelerate at a CAGR of 3.6% |
Market growth 2023-2027 | 965.24 thousand tons |
Market structure | Fragmented |
YoY growth 2022-2023 (%) | 2.44 |
Regional analysis | APAC, Middle East and Africa, North America, South America, and Europe |
Performing market contribution | APAC at 80% |
Key countries | US, India, China, Pakistan, and Brazil |
Competitive landscape | Leading Vendors, Market Positioning of Vendors, Competitive Strategies, and Industry Risks |
Key companies profiled | Archer Daniels Midland Co., Aryan International, Asha Cotton Industries, Authentic Oil Co., Bunge Ltd., Cargill Inc., Henry Lamotte Services GmbH, ITOCHU Corp., Matangi Cotton Industries, Oilseeds Australia Pty Ltd., PYCO Industries, S.R. Cotton, SULU ORGANICS Corp., Vimal Oil and Foods Ltd., Wilmar International Ltd., Gemini Edibles and Fats India Pvt. Ltd., Gokul Refoils and Solvent Ltd., Louis Dreyfus Holding BV, Maharashtra solvent extraction P Ltd., and Oilseeds International Inc. |
Market dynamics | Parent market analysis, Market growth inducers and obstacles, Fast-growing and slow-growing segment analysis, COVID-19 impact and recovery analysis and future consumer dynamics, and Market condition analysis for the forecast period. |
Customization purview | If our report has not included the data that you are looking for, you can reach out to our analysts and get segments customized. |
1 Executive Summary
- 1.1 Market Overview
- Exhibit 01: Executive Summary – Chart on Market Overview
- Exhibit 02: Executive Summary – Data Table on Market Overview
- Exhibit 03: Executive Summary – Chart on Global Market Characteristics
- Exhibit 04: Executive Summary – Chart on Market by Geography
- Exhibit 05: Executive Summary – Chart on Market Segmentation by Product
- Exhibit 06: Executive Summary – Chart on Market Segmentation by Distribution Channel
- Exhibit 07: Executive Summary – Chart on Incremental Growth
- Exhibit 08: Executive Summary – Data Table on Incremental Growth
- Exhibit 09: Executive Summary – Chart on Vendor Market Positioning
2 Market Landscape
- 2.1 Market ecosystem
- Exhibit 10: Parent market
- Exhibit 11: Market Characteristics
3 Market Sizing
- 3.1 Market Definition
- Exhibit 12: Offerings of vendors included in the market definition
- 3.2 Market segment analysis
- Exhibit 13: Market segments
- 3.3 Market size 2022
- 3.4 Market outlook: Forecast for 2022-2027
- Exhibit 14: Chart on Global - Market size and forecast 2022-2027 (thousand t)
- Exhibit 15: Data Table on Global - Market size and forecast 2022-2027 (thousand t)
- Exhibit 16: Chart on Global Market- Year-over-year growth 2022-2027 (%)
- Exhibit 17: Data Table on Global Market- Year-over-year growth 2022-2027 (%)
4 Historic Market Size
- 4.1 Global cottonseed oil market 2017 - 2021
- Exhibit 18: Historic Market Size – Data Table on Global cottonseed oil market 2017 - 2021 (thousand t)
- 4.2 Product Segment Analysis 2017 - 2021
- Exhibit 19: Historic Market Size – Product Segment 2017 - 2021 (thousand t)
- 4.3 Distribution channel Segment Analysis 2017 - 2021
- Exhibit 20: Historic Market Size – Distribution channel Segment 2017 - 2021 (thousand t)
- 4.4 Geography Segment Analysis 2017 - 2021
- Exhibit 21: Historic Market Size – Geography Segment 2017 - 2021 (thousand t)
- 4.5 Country Segment Analysis 2017 - 2021
- Exhibit 22: Historic Market Size – Country Segment 2017 - 2021 (thousand t)
5 Five Forces Analysis
- 5.1 Five forces summary
- Exhibit 23: Five forces analysis - Comparison between 2022 and 2027
- 5.2 Bargaining power of buyers
- Exhibit 24: Chart on Bargaining power of buyers – Impact of key factors 2022 and 2027
- 5.3 Bargaining power of suppliers
- Exhibit 25: Bargaining power of suppliers – Impact of key factors in 2022 and 2027
- 5.4 Threat of new entrants
- Exhibit 26: Threat of new entrants – Impact of key factors in 2022 and 2027
- 5.5 Threat of substitutes
- Exhibit 27: Threat of substitutes – Impact of key factors in 2022 and 2027
- 5.6 Threat of rivalry
- Exhibit 28: Threat of rivalry – Impact of key factors in 2022 and 2027
- 5.7 Market condition
- Exhibit 29: Chart on Market condition - Five forces 2022 and 2027
6 Market Segmentation by Product
- 6.1 Market segments
- Exhibit 30: Chart on Product - Market share 2022-2027 (%)
- Exhibit 31: Data Table on Product - Market share 2022-2027 (%)
- 6.2 Comparison by Product
- Exhibit 32: Chart on Comparison by Product
- Exhibit 33: Data Table on Comparison by Product
- 6.3 GM cottonseed oil - Market size and forecast 2022-2027
- Exhibit 34: Chart on GM cottonseed oil - Market size and forecast 2022-2027 (thousand t)
- Exhibit 35: Data Table on GM cottonseed oil - Market size and forecast 2022-2027 (thousand t)
- Exhibit 36: Chart on GM cottonseed oil - Year-over-year growth 2022-2027 (%)
- Exhibit 37: Data Table on GM cottonseed oil - Year-over-year growth 2022-2027 (%)
- 6.4 Non-GM cottonseed oil - Market size and forecast 2022-2027
- Exhibit 38: Chart on Non-GM cottonseed oil - Market size and forecast 2022-2027 (thousand t)
- Exhibit 39: Data Table on Non-GM cottonseed oil - Market size and forecast 2022-2027 (thousand t)
- Exhibit 40: Chart on Non-GM cottonseed oil - Year-over-year growth 2022-2027 (%)
- Exhibit 41: Data Table on Non-GM cottonseed oil - Year-over-year growth 2022-2027 (%)
- 6.5 Market opportunity by Product
- Exhibit 42: Market opportunity by Product (thousand t)
7 Market Segmentation by Distribution Channel
- 7.1 Market segments
- Exhibit 43: Chart on Distribution Channel - Market share 2022-2027 (%)
- Exhibit 44: Data Table on Distribution Channel - Market share 2022-2027 (%)
- 7.2 Comparison by Distribution Channel
- Exhibit 45: Chart on Comparison by Distribution Channel
- Exhibit 46: Data Table on Comparison by Distribution Channel
- 7.3 Offline - Market size and forecast 2022-2027
- Exhibit 47: Chart on Offline - Market size and forecast 2022-2027 (thousand t)
- Exhibit 48: Data Table on Offline - Market size and forecast 2022-2027 (thousand t)
- Exhibit 49: Chart on Offline - Year-over-year growth 2022-2027 (%)
- Exhibit 50: Data Table on Offline - Year-over-year growth 2022-2027 (%)
- 7.4 Online - Market size and forecast 2022-2027
- Exhibit 51: Chart on Online - Market size and forecast 2022-2027 (thousand t)
- Exhibit 52: Data Table on Online - Market size and forecast 2022-2027 (thousand t)
- Exhibit 53: Chart on Online - Year-over-year growth 2022-2027 (%)
- Exhibit 54: Data Table on Online - Year-over-year growth 2022-2027 (%)
- 7.5 Market opportunity by Distribution Channel
- Exhibit 55: Market opportunity by Distribution Channel (thousand t)
8 Customer Landscape
- 8.1 Customer landscape overview
- Exhibit 56: Analysis of price sensitivity, lifecycle, customer purchase basket, adoption rates, and purchase criteria
9 Geographic Landscape
- 9.1 Geographic segmentation
- Exhibit 57: Chart on Market share by geography 2022-2027 (%)
- Exhibit 58: Data Table on Market share by geography 2022-2027 (%)
- 9.2 Geographic comparison
- Exhibit 59: Chart on Geographic comparison
- Exhibit 60: Data Table on Geographic comparison
- 9.3 APAC - Market size and forecast 2022-2027
- Exhibit 61: Chart on APAC - Market size and forecast 2022-2027 (thousand t)
- Exhibit 62: Data Table on APAC - Market size and forecast 2022-2027 (thousand t)
- Exhibit 63: Chart on APAC - Year-over-year growth 2022-2027 (%)
- Exhibit 64: Data Table on APAC - Year-over-year growth 2022-2027 (%)
- 9.4 Middle East and Africa - Market size and forecast 2022-2027
- Exhibit 65: Chart on Middle East and Africa - Market size and forecast 2022-2027 (thousand t)
- Exhibit 66: Data Table on Middle East and Africa - Market size and forecast 2022-2027 (thousand t)
- Exhibit 67: Chart on Middle East and Africa - Year-over-year growth 2022-2027 (%)
- Exhibit 68: Data Table on Middle East and Africa - Year-over-year growth 2022-2027 (%)
- 9.5 North America - Market size and forecast 2022-2027
- Exhibit 69: Chart on North America - Market size and forecast 2022-2027 (thousand t)
- Exhibit 70: Data Table on North America - Market size and forecast 2022-2027 (thousand t)
- Exhibit 71: Chart on North America - Year-over-year growth 2022-2027 (%)
- Exhibit 72: Data Table on North America - Year-over-year growth 2022-2027 (%)
- 9.6 South America - Market size and forecast 2022-2027
- Exhibit 73: Chart on South America - Market size and forecast 2022-2027 (thousand t)
- Exhibit 74: Data Table on South America - Market size and forecast 2022-2027 (thousand t)
- Exhibit 75: Chart on South America - Year-over-year growth 2022-2027 (%)
- Exhibit 76: Data Table on South America - Year-over-year growth 2022-2027 (%)
- 9.7 Europe - Market size and forecast 2022-2027
- Exhibit 77: Chart on Europe - Market size and forecast 2022-2027 (thousand t)
- Exhibit 78: Data Table on Europe - Market size and forecast 2022-2027 (thousand t)
- Exhibit 79: Chart on Europe - Year-over-year growth 2022-2027 (%)
- Exhibit 80: Data Table on Europe - Year-over-year growth 2022-2027 (%)
- 9.8 India - Market size and forecast 2022-2027
- Exhibit 81: Chart on India - Market size and forecast 2022-2027 (thousand t)
- Exhibit 82: Data Table on India - Market size and forecast 2022-2027 (thousand t)
- Exhibit 83: Chart on India - Year-over-year growth 2022-2027 (%)
- Exhibit 84: Data Table on India - Year-over-year growth 2022-2027 (%)
- 9.9 China - Market size and forecast 2022-2027
- Exhibit 85: Chart on China - Market size and forecast 2022-2027 (thousand t)
- Exhibit 86: Data Table on China - Market size and forecast 2022-2027 (thousand t)
- Exhibit 87: Chart on China - Year-over-year growth 2022-2027 (%)
- Exhibit 88: Data Table on China - Year-over-year growth 2022-2027 (%)
- 9.10 Pakistan - Market size and forecast 2022-2027
- Exhibit 89: Chart on Pakistan - Market size and forecast 2022-2027 (thousand t)
- Exhibit 90: Data Table on Pakistan - Market size and forecast 2022-2027 (thousand t)
- Exhibit 91: Chart on Pakistan - Year-over-year growth 2022-2027 (%)
- Exhibit 92: Data Table on Pakistan - Year-over-year growth 2022-2027 (%)
- 9.11 Brazil - Market size and forecast 2022-2027
- Exhibit 93: Chart on Brazil - Market size and forecast 2022-2027 (thousand t)
- Exhibit 94: Data Table on Brazil - Market size and forecast 2022-2027 (thousand t)
- Exhibit 95: Chart on Brazil - Year-over-year growth 2022-2027 (%)
- Exhibit 96: Data Table on Brazil - Year-over-year growth 2022-2027 (%)
- 9.12 US - Market size and forecast 2022-2027
- Exhibit 97: Chart on US - Market size and forecast 2022-2027 (thousand t)
- Exhibit 98: Data Table on US - Market size and forecast 2022-2027 (thousand t)
- Exhibit 99: Chart on US - Year-over-year growth 2022-2027 (%)
- Exhibit 100: Data Table on US - Year-over-year growth 2022-2027 (%)
- 9.13 Market opportunity by geography
- Exhibit 101: Market opportunity by geography (thousand t)
10 Drivers, Challenges, and Trends
- 10.1 Market drivers
- 10.2 Market challenges
- 10.3 Impact of drivers and challenges
- Exhibit 102: Impact of drivers and challenges in 2022 and 2027
- 10.4 Market trends
11 Vendor Landscape
- 11.1 Overview
- 11.2 Vendor landscape
- Exhibit 103: Overview on Criticality of inputs and Factors of differentiation
- 11.3 Landscape disruption
- Exhibit 104: Overview on factors of disruption
- 11.4 Industry risks
- Exhibit 105: Impact of key risks on business
12 Vendor Analysis
- 12.1 Vendors covered
- Exhibit 106: Vendors covered
- 12.2 Market positioning of vendors
- Exhibit 107: Matrix on vendor position and classification
- 12.3 Archer Daniels Midland Co.
- Exhibit 108: Archer Daniels Midland Co. - Overview
- Exhibit 109: Archer Daniels Midland Co. - Business segments
- Exhibit 110: Archer Daniels Midland Co. - Key offerings
- Exhibit 111: Archer Daniels Midland Co. - Segment focus
- 12.4 Aryan International
- Exhibit 112: Aryan International - Overview
- Exhibit 113: Aryan International - Product / Service
- Exhibit 114: Aryan International - Key offerings
- 12.5 Asha Cotton Industries
- Exhibit 115: Asha Cotton Industries - Overview
- Exhibit 116: Asha Cotton Industries - Product / Service
- Exhibit 117: Asha Cotton Industries - Key offerings
- 12.6 Bunge Ltd.
- Exhibit 118: Bunge Ltd. - Overview
- Exhibit 119: Bunge Ltd. - Business segments
- Exhibit 120: Bunge Ltd. - Key news
- Exhibit 121: Bunge Ltd. - Key offerings
- Exhibit 122: Bunge Ltd. - Segment focus
- 12.7 Cargill Inc.
- Exhibit 123: Cargill Inc. - Overview
- Exhibit 124: Cargill Inc. - Product / Service
- Exhibit 125: Cargill Inc. - Key news
- Exhibit 126: Cargill Inc. - Key offerings
- 12.8 Gemini Edibles and Fats India Pvt. Ltd.
- Exhibit 127: Gemini Edibles and Fats India Pvt. Ltd. - Overview
- Exhibit 128: Gemini Edibles and Fats India Pvt. Ltd. - Product / Service
- Exhibit 129: Gemini Edibles and Fats India Pvt. Ltd. - Key offerings
- 12.9 Henry Lamotte Services GmbH
- Exhibit 130: Henry Lamotte Services GmbH - Overview
- Exhibit 131: Henry Lamotte Services GmbH - Product / Service
- Exhibit 132: Henry Lamotte Services GmbH - Key offerings
- 12.10 ITOCHU Corp.
- Exhibit 133: ITOCHU Corp. - Overview
- Exhibit 134: ITOCHU Corp. - Business segments
- Exhibit 135: ITOCHU Corp. - Key offerings
- Exhibit 136: ITOCHU Corp. - Segment focus
- 12.11 Matangi Cotton Industries
- Exhibit 137: Matangi Cotton Industries - Overview
- Exhibit 138: Matangi Cotton Industries - Product / Service
- Exhibit 139: Matangi Cotton Industries - Key offerings
- 12.12 Oilseeds Australia Pty Ltd.
- Exhibit 140: Oilseeds Australia Pty Ltd. - Overview
- Exhibit 141: Oilseeds Australia Pty Ltd. - Product / Service
- Exhibit 142: Oilseeds Australia Pty Ltd. - Key offerings
- 12.13 Oilseeds International Inc.
- Exhibit 143: Oilseeds International Inc. - Overview
- Exhibit 144: Oilseeds International Inc. - Product / Service
- Exhibit 145: Oilseeds International Inc. - Key offerings
- 12.14 PYCO Industries
- Exhibit 146: PYCO Industries - Overview
- Exhibit 147: PYCO Industries - Product / Service
- Exhibit 148: PYCO Industries - Key offerings
- 12.15 S.R. Cotton
- Exhibit 149: S.R. Cotton - Overview
- Exhibit 150: S.R. Cotton - Product / Service
- Exhibit 151: S.R. Cotton - Key offerings
- 12.16 Vimal Oil and Foods Ltd.
- Exhibit 152: Vimal Oil and Foods Ltd. - Overview
- Exhibit 153: Vimal Oil and Foods Ltd. - Product / Service
- Exhibit 154: Vimal Oil and Foods Ltd. - Key offerings
- 12.17 Wilmar International Ltd.
- Exhibit 155: Wilmar International Ltd. - Overview
- Exhibit 156: Wilmar International Ltd. - Business segments
- Exhibit 157: Wilmar International Ltd. - Key news
- Exhibit 158: Wilmar International Ltd. - Key offerings
- Exhibit 159: Wilmar International Ltd. - Segment focus
13 Appendix
- 13.1 Scope of the report
- 13.2 Inclusions and exclusions checklist
- Exhibit 160: Inclusions checklist
- Exhibit 161: Exclusions checklist
- 13.3 Currency conversion rates for US$
- Exhibit 162: Currency conversion rates for US$
- 13.4 Research methodology
- Exhibit 163: Research methodology
- Exhibit 164: Validation techniques employed for market sizing
- Exhibit 165: Information sources
- 13.5 List of abbreviations
- Exhibit 166: List of abbreviations
Technavio is a leading global technology research and advisory company. Their research and analysis focus on emerging market trends and provide actionable insights to help businesses identify market opportunities and develop effective strategies to optimize their market positions. With over 500 specialized analysts, Technavio's report library consists of more than 17,000 reports and counting, covering 800 technologies, spanning 50 countries. Their client base consists of enterprises of all sizes, including more than 100 Fortune 500 companies. This growing client base relies on Technavio's comprehensive coverage, extensive research, and actionable market insights to identify opportunities in existing and potential markets and assess their competitive positions within changing market scenarios.
Contact
Technavio Research
Jesse Maida
Media & Marketing Executive
US: +1 844 364 1100
UK: +44 203 893 3200
Email: media@technavio.com
Website: www.technavio.com
")
View original content to download multimedia:https://www.prnewswire.com/news-releases/cottonseed-oil-market-size-to-grow-by-965-24-thousand-tons-from-2022-to-2027-a-descriptive-analysis-of-customer-landscape-vendor-assessment-and-market-dynamics---technavio-301726751.html
SOURCE Technavio
Uncategorized
February Employment Situation
By Paul Gomme and Peter Rupert The establishment data from the BLS showed a 275,000 increase in payroll employment for February, outpacing the 230,000…
Share this:


By Paul Gomme and Peter Rupert
The establishment data from the BLS showed a 275,000 increase in payroll employment for February, outpacing the 230,000 average over the previous 12 months. The payroll data for January and December were revised down by a total of 167,000. The private sector added 223,000 new jobs, the largest gain since May of last year.

Temporary help services employment continues a steep decline after a sharp post-pandemic rise.


Average hours of work increased from 34.2 to 34.3. The increase, along with the 223,000 private employment increase led to a hefty increase in total hours of 5.6% at an annualized rate, also the largest increase since May of last year.

The establishment report, once again, beat “expectations;” the WSJ survey of economists was 198,000. Other than the downward revisions, mentioned above, another bit of negative news was a smallish increase in wage growth, from $34.52 to $34.57.

The household survey shows that the labor force increased 150,000, a drop in employment of 184,000 and an increase in the number of unemployed persons of 334,000. The labor force participation rate held steady at 62.5, the employment to population ratio decreased from 60.2 to 60.1 and the unemployment rate increased from 3.66 to 3.86. Remember that the unemployment rate is the number of unemployed relative to the labor force (the number employed plus the number unemployed). Consequently, the unemployment rate can go up if the number of unemployed rises holding fixed the labor force, or if the labor force shrinks holding the number unemployed unchanged. An increase in the unemployment rate is not necessarily a bad thing: it may reflect a strong labor market drawing “marginally attached” individuals from outside the labor force. Indeed, there was a 96,000 decline in those workers.


Earlier in the week, the BLS announced JOLTS (Job Openings and Labor Turnover Survey) data for January. There isn’t much to report here as the job openings changed little at 8.9 million, the number of hires and total separations were little changed at 5.7 million and 5.3 million, respectively.

As has been the case for the last couple of years, the number of job openings remains higher than the number of unemployed persons.

Also earlier in the week the BLS announced that productivity increased 3.2% in the 4th quarter with output rising 3.5% and hours of work rising 0.3%.

The bottom line is that the labor market continues its surprisingly (to some) strong performance, once again proving stronger than many had expected. This strength makes it difficult to justify any interest rate cuts soon, particularly given the recent inflation spike.
unemployment pandemic unemploymentUncategorized
Mortgage rates fall as labor market normalizes
Jobless claims show an expanding economy. We will only be in a recession once jobless claims exceed 323,000 on a four-week moving average.
Share this:


Everyone was waiting to see if this week’s jobs report would send mortgage rates higher, which is what happened last month. Instead, the 10-year yield had a muted response after the headline number beat estimates, but we have negative job revisions from previous months. The Federal Reserve’s fear of wage growth spiraling out of control hasn’t materialized for over two years now and the unemployment rate ticked up to 3.9%. For now, we can say the labor market isn’t tight anymore, but it’s also not breaking.
The key labor data line in this expansion is the weekly jobless claims report. Jobless claims show an expanding economy that has not lost jobs yet. We will only be in a recession once jobless claims exceed 323,000 on a four-week moving average.
From the Fed: In the week ended March 2, initial claims for unemployment insurance benefits were flat, at 217,000. The four-week moving average declined slightly by 750, to 212,250
Below is an explanation of how we got here with the labor market, which all started during COVID-19.
1. I wrote the COVID-19 recovery model on April 7, 2020, and retired it on Dec. 9, 2020. By that time, the upfront recovery phase was done, and I needed to model out when we would get the jobs lost back.
2. Early in the labor market recovery, when we saw weaker job reports, I doubled and tripled down on my assertion that job openings would get to 10 million in this recovery. Job openings rose as high as to 12 million and are currently over 9 million. Even with the massive miss on a job report in May 2021, I didn’t waver.
Currently, the jobs openings, quit percentage and hires data are below pre-COVID-19 levels, which means the labor market isn’t as tight as it once was, and this is why the employment cost index has been slowing data to move along the quits percentage.

3. I wrote that we should get back all the jobs lost to COVID-19 by September of 2022. At the time this would be a speedy labor market recovery, and it happened on schedule, too
Total employment data
4. This is the key one for right now: If COVID-19 hadn’t happened, we would have between 157 million and 159 million jobs today, which would have been in line with the job growth rate in February 2020. Today, we are at 157,808,000. This is important because job growth should be cooling down now. We are more in line with where the labor market should be when averaging 140K-165K monthly. So for now, the fact that we aren’t trending between 140K-165K means we still have a bit more recovery kick left before we get down to those levels.

From BLS: Total nonfarm payroll employment rose by 275,000 in February, and the unemployment rate increased to 3.9 percent, the U.S. Bureau of Labor Statistics reported today. Job gains occurred in health care, in government, in food services and drinking places, in social assistance, and in transportation and warehousing.
Here are the jobs that were created and lost in the previous month:

In this jobs report, the unemployment rate for education levels looks like this:
- Less than a high school diploma: 6.1%
- High school graduate and no college: 4.2%
- Some college or associate degree: 3.1%
- Bachelor’s degree or higher: 2.2%

Today’s report has continued the trend of the labor data beating my expectations, only because I am looking for the jobs data to slow down to a level of 140K-165K, which hasn’t happened yet. I wouldn’t categorize the labor market as being tight anymore because of the quits ratio and the hires data in the job openings report. This also shows itself in the employment cost index as well. These are key data lines for the Fed and the reason we are going to see three rate cuts this year.
recession unemployment covid-19 fed federal reserve mortgage rates recession recovery unemploymentUncategorized
Inside The Most Ridiculous Jobs Report In History: Record 1.2 Million Immigrant Jobs Added In One Month
Inside The Most Ridiculous Jobs Report In History: Record 1.2 Million Immigrant Jobs Added In One Month
Last month we though that the January…
Share this:


Last month we though that the January jobs report was the "most ridiculous in recent history" but, boy, were we wrong because this morning the Biden department of goalseeked propaganda (aka BLS) published the February jobs report, and holy crap was that something else. Even Goebbels would blush.
What happened? Let's take a closer look.
On the surface, it was (almost) another blockbuster jobs report, certainly one which nobody expected, or rather just one bank out of 76 expected. Starting at the top, the BLS reported that in February the US unexpectedly added 275K jobs, with just one research analyst (from Dai-Ichi Research) expecting a higher number.
Some context: after last month's record 4-sigma beat, today's print was "only" 3 sigma higher than estimates. Needless to say, two multiple sigma beats in a row used to only happen in the USSR... and now in the US, apparently.

Before we go any further, a quick note on what last month we said was "the most ridiculous jobs report in recent history": it appears the BLS read our comments and decided to stop beclowing itself. It did that by slashing last month's ridiculous print by over a third, and revising what was originally reported as a massive 353K beat to just 229K, a 124K revision, which was the biggest one-month negative revision in two years!

Of course, that does not mean that this month's jobs print won't be revised lower: it will be, and not just that month but every other month until the November election because that's the only tool left in the Biden admin's box: pretend the economic and jobs are strong, then revise them sharply lower the next month, something we pointed out first last summer and which has not failed to disappoint once.
In the past month the Biden department of goalseeking stuff higher before revising it lower, has revised the following data sharply lower:
— zerohedge (@zerohedge) August 30, 2023
- Jobs
- JOLTS
- New Home sales
- Housing Starts and Permits
- Industrial Production
- PCE and core PCE
To be fair, not every aspect of the jobs report was stellar (after all, the BLS had to give it some vague credibility). Take the unemployment rate, after flatlining between 3.4% and 3.8% for two years - and thus denying expectations from Sahm's Rule that a recession may have already started - in February the unemployment rate unexpectedly jumped to 3.9%, the highest since February 2022 (with Black unemployment spiking by 0.3% to 5.6%, an indicator which the Biden admin will quickly slam as widespread economic racism or something).

And then there were average hourly earnings, which after surging 0.6% MoM in January (since revised to 0.5%) and spooking markets that wage growth is so hot, the Fed will have no choice but to delay cuts, in February the number tumbled to just 0.1%, the lowest in two years...

... for one simple reason: last month's average wage surge had nothing to do with actual wages, and everything to do with the BLS estimate of hours worked (which is the denominator in the average wage calculation) which last month tumbled to just 34.1 (we were led to believe) the lowest since the covid pandemic...

... but has since been revised higher while the February print rose even more, to 34.3, hence why the latest average wage data was once again a product not of wages going up, but of how long Americans worked in any weekly period, in this case higher from 34.1 to 34.3, an increase which has a major impact on the average calculation.

While the above data points were examples of some latent weakness in the latest report, perhaps meant to give it a sheen of veracity, it was everything else in the report that was a problem starting with the BLS's latest choice of seasonal adjustments (after last month's wholesale revision), which have gone from merely laughable to full clownshow, as the following comparison between the monthly change in BLS and ADP payrolls shows. The trend is clear: the Biden admin numbers are now clearly rising even as the impartial ADP (which directly logs employment numbers at the company level and is far more accurate), shows an accelerating slowdown.

But it's more than just the Biden admin hanging its "success" on seasonal adjustments: when one digs deeper inside the jobs report, all sorts of ugly things emerge... such as the growing unprecedented divergence between the Establishment (payrolls) survey and much more accurate Household (actual employment) survey. To wit, while in January the BLS claims 275K payrolls were added, the Household survey found that the number of actually employed workers dropped for the third straight month (and 4 in the past 5), this time by 184K (from 161.152K to 160.968K).

This means that while the Payrolls series hits new all time highs every month since December 2020 (when according to the BLS the US had its last month of payrolls losses), the level of Employment has not budged in the past year. Worse, as shown in the chart below, such a gaping divergence has opened between the two series in the past 4 years, that the number of Employed workers would need to soar by 9 million (!) to catch up to what Payrolls claims is the employment situation.

There's more: shifting from a quantitative to a qualitative assessment, reveals just how ugly the composition of "new jobs" has been. Consider this: the BLS reports that in February 2024, the US had 132.9 million full-time jobs and 27.9 million part-time jobs. Well, that's great... until you look back one year and find that in February 2023 the US had 133.2 million full-time jobs, or more than it does one year later! And yes, all the job growth since then has been in part-time jobs, which have increased by 921K since February 2023 (from 27.020 million to 27.941 million).

Here is a summary of the labor composition in the past year: all the new jobs have been part-time jobs!

But wait there's even more, because now that the primary season is over and we enter the heart of election season and political talking points will be thrown around left and right, especially in the context of the immigration crisis created intentionally by the Biden administration which is hoping to import millions of new Democratic voters (maybe the US can hold the presidential election in Honduras or Guatemala, after all it is their citizens that will be illegally casting the key votes in November), what we find is that in February, the number of native-born workers tumbled again, sliding by a massive 560K to just 129.807 million. Add to this the December data, and we get a near-record 2.4 million plunge in native-born workers in just the past 3 months (only the covid crash was worse)!

The offset? A record 1.2 million foreign-born (read immigrants, both legal and illegal but mostly illegal) workers added in February!

Said otherwise, not only has all job creation in the past 6 years has been exclusively for foreign-born workers...

... but there has been zero job-creation for native born workers since June 2018!

This is a huge issue - especially at a time of an illegal alien flood at the southwest border...

... and is about to become a huge political scandal, because once the inevitable recession finally hits, there will be millions of furious unemployed Americans demanding a more accurate explanation for what happened - i.e., the illegal immigration floodgates that were opened by the Biden admin.
Which is also why Biden's handlers will do everything in their power to insure there is no official recession before November... and why after the election is over, all economic hell will finally break loose. Until then, however, expect the jobs numbers to get even more ridiculous.


-

 Uncategorized2 weeks ago
All Of The Elements Are In Place For An Economic Crisis Of Staggering Proportions
-

 Uncategorized1 month ago
Cathie Wood sells a major tech stock (again)
-

 Uncategorized3 weeks ago
California Counties Could Be Forced To Pay $300 Million To Cover COVID-Era Program
-

 Uncategorized2 weeks ago
Apparel Retailer Express Moving Toward Bankruptcy
-

 Uncategorized3 weeks ago
Industrial Production Decreased 0.1% in January
-

 International2 days ago
Walmart launches clever answer to Target’s new membership program
-

 International2 days ago
EyePoint poaches medical chief from Apellis; Sandoz CFO, longtime BioNTech exec to retire
-

 Uncategorized3 weeks ago
RFK Jr: The Wuhan Cover-Up & The Rise Of The Biowarfare-Industrial Complex