Uncategorized
China’s Foreign Direct Investment Turns Negative For The First Time On Record
China’s Foreign Direct Investment Turns Negative For The First Time On Record
We got an early look that something is very broken in China’s…
Share this:

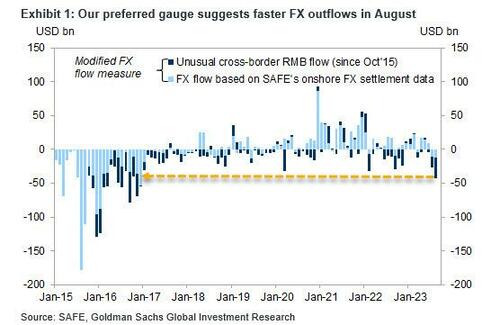
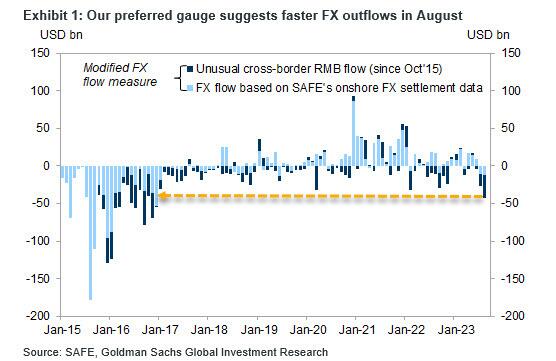
We got an early look that something is very broken in China's capital flows back mid-September, when we first reported that contrary to the official PBOC forex data, a more in depth analysis of China's fund flows reveals the biggest FX outflow since 2016 amid what we called was a "sudden surge in capital flight", one which also kicked in just before bitcoin's powerful thrust higher from $26K to $35K.
In retrospect, the reading wasn't a fluke, and three months after we reported that "China's Inward Foreign Direct Investment Falls To The Lowest Level On Record" the latest balance of payments data revealed that China recorded its first-ever quarterly decline in foreign direct investment (FDI), underscoring the capital outflow pressure we first flagged two months ago (and which was much more acute than the modest FX outflow signaled by the PBOC), and Beijing's challenge in wooing overseas companies and capital in the wake of a "de-risking" move by Western governments.
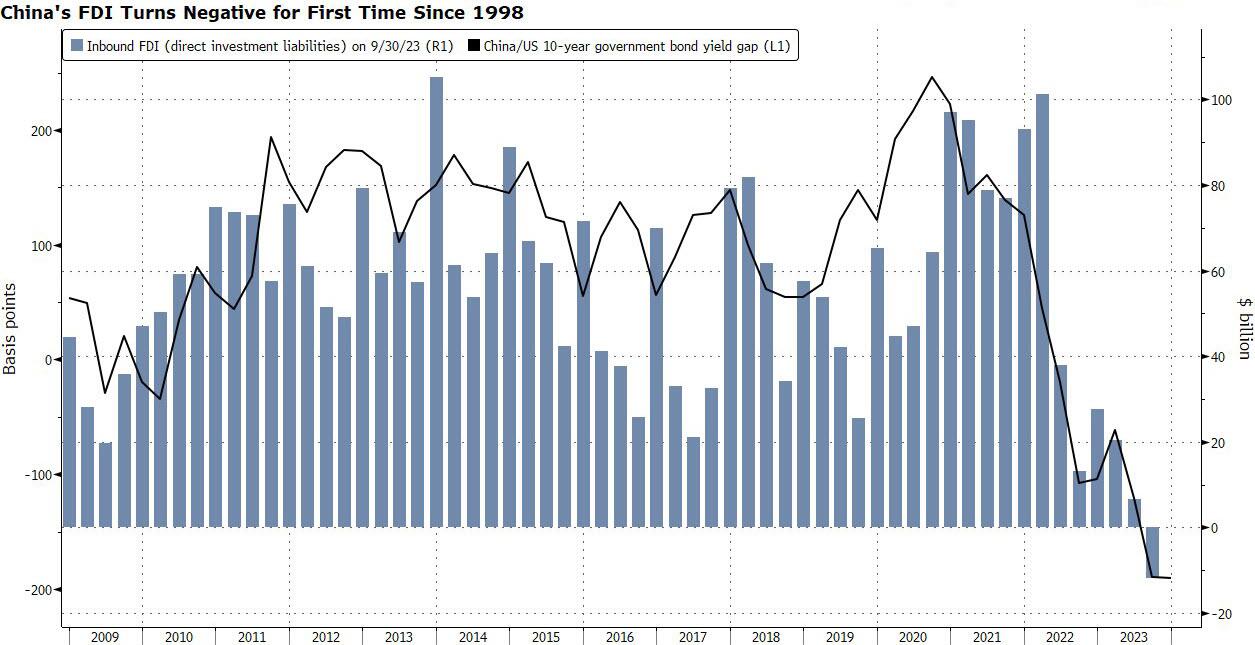
As shown in the chart below, direct investment liabilities in the country’s balance of payments - a broad measure of FDI that includes foreign companies' retained earnings in China - have been slowing over the last two years after hitting a near-peak value of more than $101 billion in the first quarter of 2022; since then the gauge weakened nearly every quarter and was a deficit of $11.8 billion during the July-September period, marking the first contraction since records started in 1998, which could be linked to the impact of "de-risking" by Western countries from China, as well as China's interest rate disadvantage (the chart below shows a striking correlation between inbound FDI and China's tumbling bond yields).
“It’s concerning to see net outflows where China’s doing its best at the moment to try and open — certainly the manufacturing sector — to new inflows,” said Robert Carnell, regional head of research for Asia-Pacific at ING Groep NV. “Maybe this is the beginning of a sign that people are just increasingly looking at alternatives to China for investment.”
"Some of the weakness in China's inward FDI may be due to multinational companies repatriating earnings," Goldman analyst Hui Shan wrote (full note available to pro subscribers) adding that "with interest rates in China 'lower for longer' while interest rates outside of China 'higher for longer', capital outflow pressures are likely to persist."
According to Julian Evans-Pritchard, head of China economics at Capital Economics, the unusually-large interest rate gap "has led firms to remit their retained earnings out of the country".
Although he sees little evidence that foreign companies are, on aggregate, reducing their presence in China, "we do think that, over the medium-term at least, increasing geopolitical tensions will hamper China's ability to attract FDI and instead favor emerging markets that are more friendly to the West."
Driven by the FDI outflows, China's basic balance - which encompasses current account and direct investment balances and are more stable than volatile portfolio investments - recorded a deficit of $3.2 billion, the second quarterly shortfall on record.
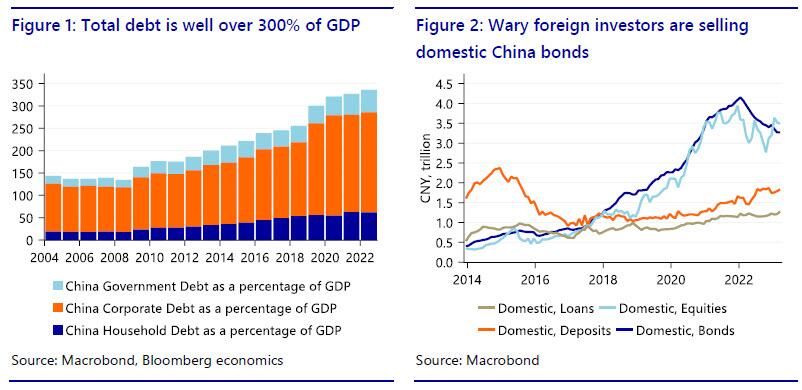
"Given these unfolding dynamics, which are poised to exert pressure on the RMB, we anticipate a sustained strategic response from China's authorities," Tommy Xie, head of Greater China Research at OCBC wrote, and while he is hardly alone in expecting a powerful response from Beijing to stop the bleeding before China is fully "Japanified" so far the ruling Communist Party has failed to materially stimulate its economy, the result of a staggering 300% in consolidated debt to GDP, which has largely tied Beijing's hand for the past 4 years.
Xie expects China's central bank to continue counter-cyclical interventions - including a strong bias in daily yuan fixings and managing yuan liquidity in the offshore market- to support the currency in the face of these headwinds.
Separately, onshore yuan trading against the dollar also hit record-low volume in October, highlighting authorities' stepped-up efforts to curb yuan selling. The latest data showed that onshore volume of yuan trading against the dollar slumped to a record low of 1.85 trillion yuan ($254.05 billion) in October, a 73% drop from the August level.
The PBOC has been urging major banks to limit trading and dissuade clients to exchange the yuan for the dollar, sources have told Reuters. This happened after our September report that FX outflows from China had hit $75 billion, the highest since the country's 2015 devaluation.
In an attempt to reverse the bleeding, the Chinese government has embarked on a big push in recent months to lure foreign investment back to the country. Bloomberg reported that on Wednesday, the Ministry of Commerce asked local governments to clear discriminatory policies facing foreign companies in a bid to stabilize investment confidence. It's doubtful the move will have any impact on capital flows which are not driven by "discriminatory" policies and have everything to do with China's dismal economy.
It cited the need to ensure subsidies for new energy vehicles are not limited to domestic brands as one example. In some industries, foreign firms wait longer and are subject to more rigorous reviewing process when applying for licenses.
In August, the internet regulator met with executives from dozens of international firms to ease concerns about new data rules. The government has also pledged to offer overseas companies better tax treatment and make it easier for them to obtain visas.
But Beijing’s pledges have rung hollow for some firms, with foreign business groups decrying “promise fatigue” amid skepticism about whether meaningful policy support is forthcoming. They also have incentive to repatriate earnings overseas because of the wide gap in interest rates between China and the US, which may be pushing them to seek higher returns elsewhere.
The FDI outflows are adding pressure on the onshore yuan, which has hit the weakest level since 2007 earlier this year. China’s benchmark 10-year government bond yield is trading at 191 basis points below that of comparable US Treasuries, versus an average premium of about 100 basis points over the past decade.
The lack of investment among global firms in China will have far reaching effects on the world’s second-largest economy, especially as it tries counter US curbs on access to advanced technology.
Aside from geopolitical risks, companies had also been pulling back on investment in China last year as the country rolled out pandemic restrictions. While those curbs have been removed, firms are still contending with other challenges from rising manufacturing costs in China and regulatory hurdles as Beijing scrutinizes activity at foreign corporations due to national security concerns.
“Some of the most damaging things have been the abrupt regulatory changes that have taken place,” said Carnell, pointing to this year’s anti-espionage campaign, which resulted in some firms having their offices raided by local authorities. “Once you damage the sort of perception of the business environment, it’s quite difficult to restore trust. I think it will take some time.”
While foreign companies make up less than 3% of the total number of corporations in China, they contribute to 40% of its trade, more than 16% of tax revenue and almost 10% of urban employment, state media has reported. They’ve also been key to China’s technological development, with foreign investment in the country’s high-tech industry growing at double-digit rates on average since 2012, according to the official Xinhua News Agency.
“A decline in trade and investment links with advanced economies will be a particularly significant headwind for a catching up economy such as China, weighing on productivity growth and technological progress,” Kuijs said. And since youth unemployment - the single, most direct precursor to the one thing Beijing fears most of all, social unrest - is already at an all time high and will continue to rise (even if China will no longer report on what it is), the likelihood that Beijing will pursue some bazooka stimulus, both fiscal and monetary, only grows with every month that Beijing does not pursue such a critical, if temporary, measure to prevent catastrophe.
Uncategorized
February Employment Situation
By Paul Gomme and Peter Rupert The establishment data from the BLS showed a 275,000 increase in payroll employment for February, outpacing the 230,000…
Share this:


By Paul Gomme and Peter Rupert
The establishment data from the BLS showed a 275,000 increase in payroll employment for February, outpacing the 230,000 average over the previous 12 months. The payroll data for January and December were revised down by a total of 167,000. The private sector added 223,000 new jobs, the largest gain since May of last year.

Temporary help services employment continues a steep decline after a sharp post-pandemic rise.


Average hours of work increased from 34.2 to 34.3. The increase, along with the 223,000 private employment increase led to a hefty increase in total hours of 5.6% at an annualized rate, also the largest increase since May of last year.

The establishment report, once again, beat “expectations;” the WSJ survey of economists was 198,000. Other than the downward revisions, mentioned above, another bit of negative news was a smallish increase in wage growth, from $34.52 to $34.57.

The household survey shows that the labor force increased 150,000, a drop in employment of 184,000 and an increase in the number of unemployed persons of 334,000. The labor force participation rate held steady at 62.5, the employment to population ratio decreased from 60.2 to 60.1 and the unemployment rate increased from 3.66 to 3.86. Remember that the unemployment rate is the number of unemployed relative to the labor force (the number employed plus the number unemployed). Consequently, the unemployment rate can go up if the number of unemployed rises holding fixed the labor force, or if the labor force shrinks holding the number unemployed unchanged. An increase in the unemployment rate is not necessarily a bad thing: it may reflect a strong labor market drawing “marginally attached” individuals from outside the labor force. Indeed, there was a 96,000 decline in those workers.


Earlier in the week, the BLS announced JOLTS (Job Openings and Labor Turnover Survey) data for January. There isn’t much to report here as the job openings changed little at 8.9 million, the number of hires and total separations were little changed at 5.7 million and 5.3 million, respectively.

As has been the case for the last couple of years, the number of job openings remains higher than the number of unemployed persons.

Also earlier in the week the BLS announced that productivity increased 3.2% in the 4th quarter with output rising 3.5% and hours of work rising 0.3%.

The bottom line is that the labor market continues its surprisingly (to some) strong performance, once again proving stronger than many had expected. This strength makes it difficult to justify any interest rate cuts soon, particularly given the recent inflation spike.
unemployment pandemic unemploymentUncategorized
Mortgage rates fall as labor market normalizes
Jobless claims show an expanding economy. We will only be in a recession once jobless claims exceed 323,000 on a four-week moving average.
Share this:


Everyone was waiting to see if this week’s jobs report would send mortgage rates higher, which is what happened last month. Instead, the 10-year yield had a muted response after the headline number beat estimates, but we have negative job revisions from previous months. The Federal Reserve’s fear of wage growth spiraling out of control hasn’t materialized for over two years now and the unemployment rate ticked up to 3.9%. For now, we can say the labor market isn’t tight anymore, but it’s also not breaking.
The key labor data line in this expansion is the weekly jobless claims report. Jobless claims show an expanding economy that has not lost jobs yet. We will only be in a recession once jobless claims exceed 323,000 on a four-week moving average.
From the Fed: In the week ended March 2, initial claims for unemployment insurance benefits were flat, at 217,000. The four-week moving average declined slightly by 750, to 212,250
Below is an explanation of how we got here with the labor market, which all started during COVID-19.
1. I wrote the COVID-19 recovery model on April 7, 2020, and retired it on Dec. 9, 2020. By that time, the upfront recovery phase was done, and I needed to model out when we would get the jobs lost back.
2. Early in the labor market recovery, when we saw weaker job reports, I doubled and tripled down on my assertion that job openings would get to 10 million in this recovery. Job openings rose as high as to 12 million and are currently over 9 million. Even with the massive miss on a job report in May 2021, I didn’t waver.
Currently, the jobs openings, quit percentage and hires data are below pre-COVID-19 levels, which means the labor market isn’t as tight as it once was, and this is why the employment cost index has been slowing data to move along the quits percentage.

3. I wrote that we should get back all the jobs lost to COVID-19 by September of 2022. At the time this would be a speedy labor market recovery, and it happened on schedule, too
Total employment data
4. This is the key one for right now: If COVID-19 hadn’t happened, we would have between 157 million and 159 million jobs today, which would have been in line with the job growth rate in February 2020. Today, we are at 157,808,000. This is important because job growth should be cooling down now. We are more in line with where the labor market should be when averaging 140K-165K monthly. So for now, the fact that we aren’t trending between 140K-165K means we still have a bit more recovery kick left before we get down to those levels.

From BLS: Total nonfarm payroll employment rose by 275,000 in February, and the unemployment rate increased to 3.9 percent, the U.S. Bureau of Labor Statistics reported today. Job gains occurred in health care, in government, in food services and drinking places, in social assistance, and in transportation and warehousing.
Here are the jobs that were created and lost in the previous month:

In this jobs report, the unemployment rate for education levels looks like this:
- Less than a high school diploma: 6.1%
- High school graduate and no college: 4.2%
- Some college or associate degree: 3.1%
- Bachelor’s degree or higher: 2.2%

Today’s report has continued the trend of the labor data beating my expectations, only because I am looking for the jobs data to slow down to a level of 140K-165K, which hasn’t happened yet. I wouldn’t categorize the labor market as being tight anymore because of the quits ratio and the hires data in the job openings report. This also shows itself in the employment cost index as well. These are key data lines for the Fed and the reason we are going to see three rate cuts this year.
recession unemployment covid-19 fed federal reserve mortgage rates recession recovery unemploymentUncategorized
Inside The Most Ridiculous Jobs Report In History: Record 1.2 Million Immigrant Jobs Added In One Month
Inside The Most Ridiculous Jobs Report In History: Record 1.2 Million Immigrant Jobs Added In One Month
Last month we though that the January…
Share this:


Last month we though that the January jobs report was the "most ridiculous in recent history" but, boy, were we wrong because this morning the Biden department of goalseeked propaganda (aka BLS) published the February jobs report, and holy crap was that something else. Even Goebbels would blush.
What happened? Let's take a closer look.
On the surface, it was (almost) another blockbuster jobs report, certainly one which nobody expected, or rather just one bank out of 76 expected. Starting at the top, the BLS reported that in February the US unexpectedly added 275K jobs, with just one research analyst (from Dai-Ichi Research) expecting a higher number.
Some context: after last month's record 4-sigma beat, today's print was "only" 3 sigma higher than estimates. Needless to say, two multiple sigma beats in a row used to only happen in the USSR... and now in the US, apparently.

Before we go any further, a quick note on what last month we said was "the most ridiculous jobs report in recent history": it appears the BLS read our comments and decided to stop beclowing itself. It did that by slashing last month's ridiculous print by over a third, and revising what was originally reported as a massive 353K beat to just 229K, a 124K revision, which was the biggest one-month negative revision in two years!

Of course, that does not mean that this month's jobs print won't be revised lower: it will be, and not just that month but every other month until the November election because that's the only tool left in the Biden admin's box: pretend the economic and jobs are strong, then revise them sharply lower the next month, something we pointed out first last summer and which has not failed to disappoint once.
In the past month the Biden department of goalseeking stuff higher before revising it lower, has revised the following data sharply lower:
— zerohedge (@zerohedge) August 30, 2023
- Jobs
- JOLTS
- New Home sales
- Housing Starts and Permits
- Industrial Production
- PCE and core PCE
To be fair, not every aspect of the jobs report was stellar (after all, the BLS had to give it some vague credibility). Take the unemployment rate, after flatlining between 3.4% and 3.8% for two years - and thus denying expectations from Sahm's Rule that a recession may have already started - in February the unemployment rate unexpectedly jumped to 3.9%, the highest since February 2022 (with Black unemployment spiking by 0.3% to 5.6%, an indicator which the Biden admin will quickly slam as widespread economic racism or something).

And then there were average hourly earnings, which after surging 0.6% MoM in January (since revised to 0.5%) and spooking markets that wage growth is so hot, the Fed will have no choice but to delay cuts, in February the number tumbled to just 0.1%, the lowest in two years...

... for one simple reason: last month's average wage surge had nothing to do with actual wages, and everything to do with the BLS estimate of hours worked (which is the denominator in the average wage calculation) which last month tumbled to just 34.1 (we were led to believe) the lowest since the covid pandemic...

... but has since been revised higher while the February print rose even more, to 34.3, hence why the latest average wage data was once again a product not of wages going up, but of how long Americans worked in any weekly period, in this case higher from 34.1 to 34.3, an increase which has a major impact on the average calculation.

While the above data points were examples of some latent weakness in the latest report, perhaps meant to give it a sheen of veracity, it was everything else in the report that was a problem starting with the BLS's latest choice of seasonal adjustments (after last month's wholesale revision), which have gone from merely laughable to full clownshow, as the following comparison between the monthly change in BLS and ADP payrolls shows. The trend is clear: the Biden admin numbers are now clearly rising even as the impartial ADP (which directly logs employment numbers at the company level and is far more accurate), shows an accelerating slowdown.

But it's more than just the Biden admin hanging its "success" on seasonal adjustments: when one digs deeper inside the jobs report, all sorts of ugly things emerge... such as the growing unprecedented divergence between the Establishment (payrolls) survey and much more accurate Household (actual employment) survey. To wit, while in January the BLS claims 275K payrolls were added, the Household survey found that the number of actually employed workers dropped for the third straight month (and 4 in the past 5), this time by 184K (from 161.152K to 160.968K).

This means that while the Payrolls series hits new all time highs every month since December 2020 (when according to the BLS the US had its last month of payrolls losses), the level of Employment has not budged in the past year. Worse, as shown in the chart below, such a gaping divergence has opened between the two series in the past 4 years, that the number of Employed workers would need to soar by 9 million (!) to catch up to what Payrolls claims is the employment situation.

There's more: shifting from a quantitative to a qualitative assessment, reveals just how ugly the composition of "new jobs" has been. Consider this: the BLS reports that in February 2024, the US had 132.9 million full-time jobs and 27.9 million part-time jobs. Well, that's great... until you look back one year and find that in February 2023 the US had 133.2 million full-time jobs, or more than it does one year later! And yes, all the job growth since then has been in part-time jobs, which have increased by 921K since February 2023 (from 27.020 million to 27.941 million).

Here is a summary of the labor composition in the past year: all the new jobs have been part-time jobs!

But wait there's even more, because now that the primary season is over and we enter the heart of election season and political talking points will be thrown around left and right, especially in the context of the immigration crisis created intentionally by the Biden administration which is hoping to import millions of new Democratic voters (maybe the US can hold the presidential election in Honduras or Guatemala, after all it is their citizens that will be illegally casting the key votes in November), what we find is that in February, the number of native-born workers tumbled again, sliding by a massive 560K to just 129.807 million. Add to this the December data, and we get a near-record 2.4 million plunge in native-born workers in just the past 3 months (only the covid crash was worse)!

The offset? A record 1.2 million foreign-born (read immigrants, both legal and illegal but mostly illegal) workers added in February!

Said otherwise, not only has all job creation in the past 6 years has been exclusively for foreign-born workers...

... but there has been zero job-creation for native born workers since June 2018!

This is a huge issue - especially at a time of an illegal alien flood at the southwest border...

... and is about to become a huge political scandal, because once the inevitable recession finally hits, there will be millions of furious unemployed Americans demanding a more accurate explanation for what happened - i.e., the illegal immigration floodgates that were opened by the Biden admin.
Which is also why Biden's handlers will do everything in their power to insure there is no official recession before November... and why after the election is over, all economic hell will finally break loose. Until then, however, expect the jobs numbers to get even more ridiculous.


-

 Uncategorized2 weeks ago
All Of The Elements Are In Place For An Economic Crisis Of Staggering Proportions
-

 Uncategorized1 month ago
Cathie Wood sells a major tech stock (again)
-

 Uncategorized3 weeks ago
California Counties Could Be Forced To Pay $300 Million To Cover COVID-Era Program
-

 Uncategorized2 weeks ago
Apparel Retailer Express Moving Toward Bankruptcy
-

 Uncategorized3 weeks ago
Industrial Production Decreased 0.1% in January
-

 International2 days ago
Walmart launches clever answer to Target’s new membership program
-

 International3 days ago
EyePoint poaches medical chief from Apellis; Sandoz CFO, longtime BioNTech exec to retire
-

 Uncategorized3 weeks ago
RFK Jr: The Wuhan Cover-Up & The Rise Of The Biowarfare-Industrial Complex