Bull Market Bull
Bull Market Beset by Too Many Misconceptions What have we learned in the one year since equities crashed? Bloomberg, March 28, 2021 To hear an audio spoken word version of this post, click here. It’s been one year since equity markets bottomed,…
Share this:

Bull Market Beset by Too Many Misconceptions
What have we learned in the one year since equities crashed?
Bloomberg, March 28, 2021
To hear an audio spoken word version of this post, click here.
It’s been one year since equity markets bottomed, beginning an epic rally that confounded and caught so many by surprise. Some of the commentary questioning why the rebound even happened amid a worsening pandemic is perplexing, revealing a lack of understanding of secular bull markets and the concept of momentum even among the most astute market observers.
The problem is that much of the explanations rely on clichés (a 20% drop designates a bear market), assumptions (you can spot a bubble in real time) and market myths (why is the time the earth takes to orbit the sun relevant to stocks?) that often lead investors astray. A few observations are helpful in better understanding the move over the past 12 months, and what may lie ahead.
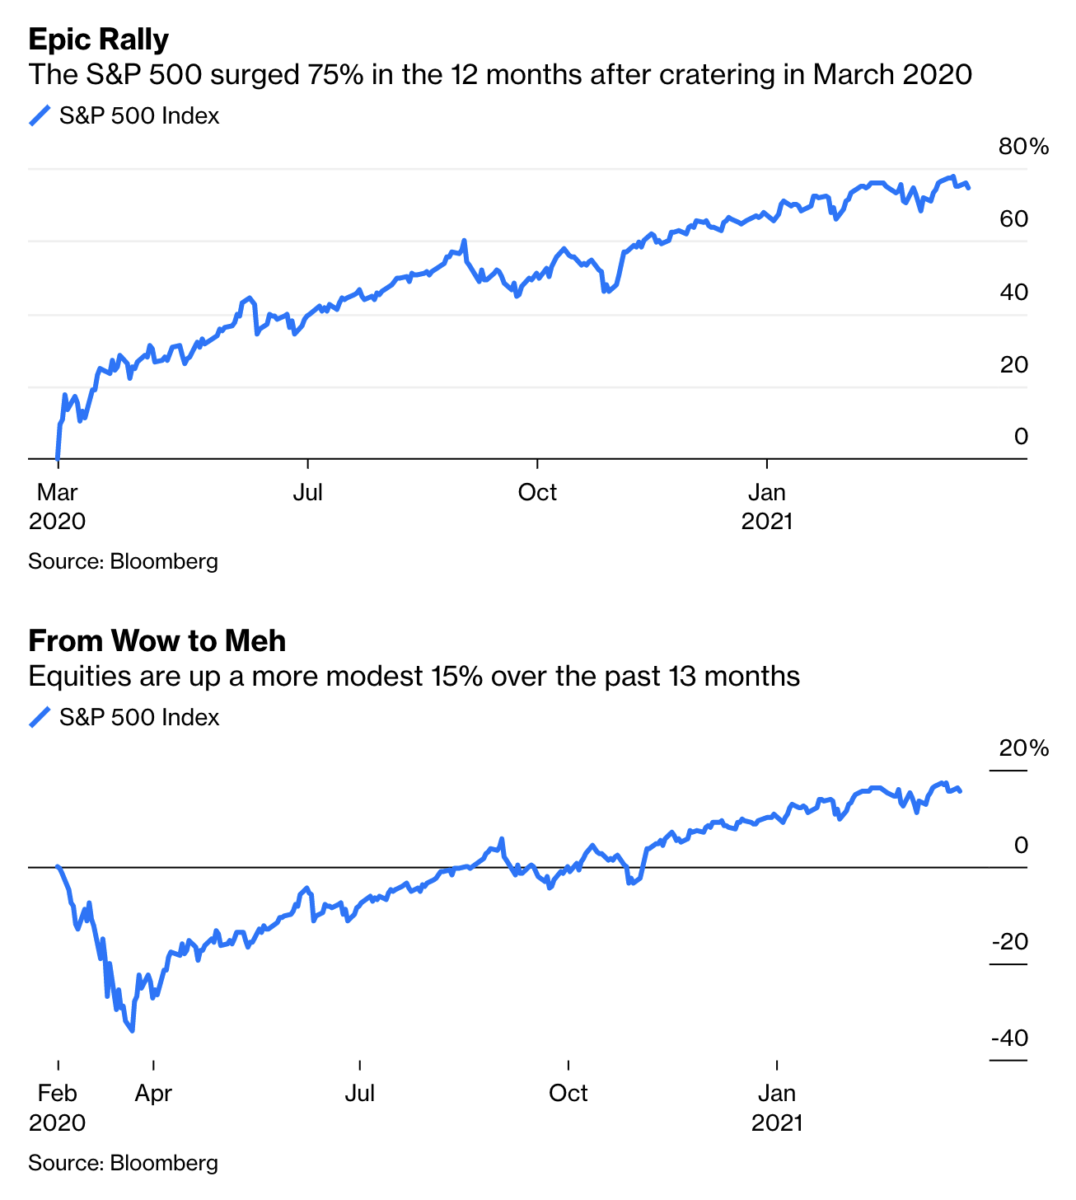
• Context Matters: The S&P 500 Index posted its best 12-month performance in history between March 23, 2020, and March 23, 2021, gaining 74.8%. This looks impressive and suggests something important, but it lacks the proper context to fully understand what took place. Get beyond your denominator blindness and note the larger picture.
Instead of looking at a 12-month chart that starts at the lows, go back 13 months. The S&P 500 is up 15.5% over that period. That’s a nice return, but not very unusual. Context matters.

Also worth noting: When the price of an asset falls 34%, it requires about a 52% move higher to get back to breakeven.
• Momentum: Investors and traders are attracted to stocks with rising prices. They may not understand what might be driving prices higher, but many don’t need or even want an explanation. Whatever the reason, traders recognize that price is a more reliable tell than the surrounding narratives; gains beget gains and price increases beget more price increases. This is perhaps why momentum is one of many Fama-French factors contributing to alpha, or the extra return an investment generates above a certain benchmark.
• Externalities: There are numerous reasons to put the pandemic in the same category as other non-economic events that had an impact on financial markets, such as the Sept. 11, 2001, terrorist attacks, Pearl Harbor bombing, or the John F. Kennedy assassination. Just as the 1982 to 2000 bull market was not ended by the 1987 crash, I don’t believe the 2020 pandemic ended the bull market that began in 2013. As I wrote last April:
“The average investor should be working from a long-term plan that won’t blow up because of a short-term disruption caused by issues like the coronavirus pandemic. Remain disciplined and stick with your goals. Seems easy to do, except sometimes it isn’t when the alarm bells are going off.”
As it turned out, the pre-collapse peak on Feb. 19, 2020, was reclaimed by August 2020. The fastest 30% drop in history followed by such a rapid recovery was an indicator that the bull market was far from over. This is not hindsight bias, but what we were discussing in real time as the market bottomed.
• Rotating Buyers/Sellers: We tend to discuss buyers and sellers as if they are monolithic blocks, but that is not the case. Holders of stocks are different depending on what point we’re at in the market cycle. My strictly anecdotal observation of participants as we made those February highs, plummeted to the March lows and then recovered to make new highs goes something like this:
Last year began as the prior one ended, with markets adding to the 29% gains of 2019. Momentum traders were enjoying the rally, and as the market reached its peak, index fund companies such as Vanguard, Blackrock and State Street, as well as 401(k) investors and dollar-cost-averagers kept doing their thing. These price insensitive investors are always buyers, both on the way up and on the way down. As the market rolled over, panicked selling became noticeable. Some of it came from hedge funds, all too aware of monthly performance targets closely watched by their investors. There was likely some nervous retail sellers as well.
Normally, a bear market takes months or years to fully develop. This one ran to its nadir in just 34 days, so the timeline was a bit compressed. Once the market fell 20% or so, the “buy the dip crowd” hardly had time jump in before the dip became a crash. At 25% off the top, the contrarians began to put their toes in the water. So too did those who “rebalance” their portfolios to maintain a steady allocation to equities. This group acts as volatility dampeners in both directions, rebalancing into peaks and valleys. So-called structural money — think sovereign wealth funds, endowments and foundations — were also buyers on the way down. They have perpetual time horizons that allows them to embrace risk in ways short-term traders can’t.
Once prices fell 30%, the value investors got excited. As prices rose, and a new uptrend was established, the trend followers re-joined the party. By mid-August, the market broke out to new highs, attracting those who employ technical analysts to guide their investing.
• Is this the second year of a new bull market? Would you say 1989 was the second year of a new bull market following the October 1987 crash? Few were saying that at the time. Instead, we learned the crash was an anomaly caused by numerous factors, especially the excessive reliance on “portfolio insurance” and creaky, outdated financial “plumbing” in use at the New York Stock Exchange.
Regardless, the forces underlying the secular bull market that began in 1982 powered ahead, making 1987 more of a digestion of the gains in the prior five years than an end to the bull market. (How many remember that the S&P 500 actually eked out a gain of 2.03% in 1987, overcoming that 20.5% drop on Oct. 19?) Rallies and declines that run counter to prior market moves do not mark the end of longer-term secular trends.
Bull markets do not begin from the lowest depths of bear markets. The 1982 -2000 bull market did not start in 1974 any more than the current bull began in March 2009. Just as there are high-water marks in hedge funds so too there are high-water marks in bear markets. A new bull market does not begin until it makes new highs; in the present case that would be March 2013.
If ever you needed proof that the day-to-day noise is a boon for traders but the bane of investors, 2020 was it. Had you missed the entire year, and not ever touched your portfolios, you would have been much better off. That might be a lesson for the next market spasm that comes your way.
Previously:
Buyers & Sellers Are Not Monolithic Blocks (March 26, 2021)
How Externalities Affect Systems (August 14, 2020)
End of the Secular Bull? Not So Fast (April 3, 2020)
Don’t Suffer From Denominator Blindness (October 14, 2015)
Cyclical Bear or Secular Bull Market? (March 20, 2015)
~~~
I originally published this at Bloomberg on Bloomberg, March 28, 2021. All of my Bloomberg columns can be found here and here.
The post Bull Market Bull appeared first on The Big Picture.
sp 500 equities stocks pandemic coronavirus recoveryInternational
TikTok Ban Obscures Chinese Stock Gold Rush
No one wants to invest in China right now. The country’s stock market is teetering on the brink of collapse. And it is about to lose its biggest foothold…
Share this:


No one wants to invest in China right now.
The country’s stock market is teetering on the brink of collapse.
And it is about to lose its biggest foothold in America — TikTok.
Yet, beneath its crumbling economy, military weather balloons and blatant propaganda tools lie some epic opportunities…
…if you have the stomach and the knowledge.
Because as Jim Woods wrote in his newsletter last month:
“China has been so battered for so long, that there is a lot of deep value here for the ‘blood in the ‘’red’’ streets’ investors.”
And boy was he right.
However, this battle-tested veteran didn’t recommend buying individual Chinese stocks.
He was more interested in the exchange-traded funds (ETFs) like the CHIQ.
And here’s why…
Predictable Manipulation
China’s heavy-handed approach creates gaping economic inefficiencies.
When markets falter, President Xi calls on his “national team” to prop up prices.
$17 billion flowed into index-tracking funds in January as the Hang Sang fell over 13% while the CSI dropped over 7%.
Jim Woods saw this coming from a mile away.
In late February, he highlighted the Chinese ETF CHIQ in late February, which has rallied rather nicely since then.
This ETF focuses on the Chinese consumer, a recent passion project for the central government.
You see, around 2018, when President Xi decided to smother his own economy, notable shifts were already taking place.
The once burgeoning retail market had slowed markedly. Developers left cities abandoned, including weird copies of Paris (Tianducheng) and England.
Source: Shutterstock
So, Xi and co. shifted the focus to the consumer… which went terribly.
For starters, a lot of the consumer wealth was tied up in real estate.
Then you had a growing population of unemployed younger adults who didn’t have any money to spend.
Once the pandemic hit, everything collapsed.
That’s why it took China far longer to recover even a sliver of its former economy.
While it’s not the growth engine of the early 2000s, the old girl still has some life left in it.
As Jim pointed out, China’s consumer spending rebounded nicely in Q4 2023.

Source: National Bureau of Statistics of China
Combined with looser central bank policy, it was only a matter of time before Chinese stocks caught a lift.
The resurgence may be largely tied to China’s desire to travel. After all, its people have been cooped up longer than any other country.
But make no mistake, this doesn’t make China a long-term investment.
Beyond what most people understand about China’s politics, there’s a little-known fact about how they treat foreign investors.
Money in. Nothing out.
When we buy a stock, we’re taking partial ownership in that company. This entitles us to a portion of the profits (or assets).
That doesn’t happen with Chinese companies.
American depository receipts (ADRs) aren’t actual shares of a company. It’s a note that the intermediary ties to shares of the company they own overseas.
So, we can only own Chinese companies indirectly.
But there’s another key feature you probably weren’t aware of.
Many of the Chinese companies we, as Americans invest in, don’t pay dividends. In fact, a much smaller percentage of Chinese companies pay any dividends.
Alibaba is a perfect example.
Despite generating billions of dollars in cash every year, it doesn’t pay dividends.
What do its managers do with the money?
Other than squirreling away $80 billion on its balance sheets, they do share buybacks.
Plenty of investors will tell you that’s even better than dividends.
But you have no legal ownership rights in China. So, what is that ADR in reality?
We’d argue nothing but paper profits at best, and air at worst.
That’s why it’s flat-out dangerous to own shares of individual Chinese companies long-term.
Any one of them can be nationalized at any moment.
Chinese ETFs reduce that risk through diversification, similar to junk bond funds.
Short of an all-out ban, like between the United States and Russia, the majority of the ETF holdings should remain intact.
Opportunistic Investing
If China is so unstable, and capable of changing at a moment’s notice, how can investors uncover pockets of value?
As Jim showed with his ETF selection, you can have some sector or thematic idea so long as you have the data to support it.
China, like any large institution, isn’t going to change its broad economic policies overnight.
As long as you study the general movements of the government, you can steer clear of the catastrophic zones and towards the diamond caves.
Because when things look THIS bad, you know the opportunities are even juicier.
But rather than try to run this maze solo, take this opportunity to check out Jim Woods’ latest report on China.
In it, he details the broad economic themes driving the Chinese government, and how to exploit them for gain.
Click here to explore Jim Woods’ report.
The post TikTok Ban Obscures Chinese Stock Gold Rush appeared first on Stock Investor.
stocks pandemic real estate etf consumer spending gold russia chinaInternational
The Great Escape… of UK Unemployment Reporting
https://bondvigilantes.com/wp-content/uploads/2024/03/1-the-great-escape-of-uk-unemployment-reporting-1024×576.pngThe Bank of England Monetary Policy Committee…
Share this:

The Bank of England Monetary Policy Committee potentially has a problem: it requires data to make its labour market forecasts and assessments, but the unemployment statistics have become increasingly unreliable. This is because the Labour Force Survey participation rate (on which the unemployment figures are based) has fallen below 50% since 2018 and has been as low as 15% recently[1]. What is the solution to this difficult measurement problem? An answer can be found in the classic war film, The Great Escape.
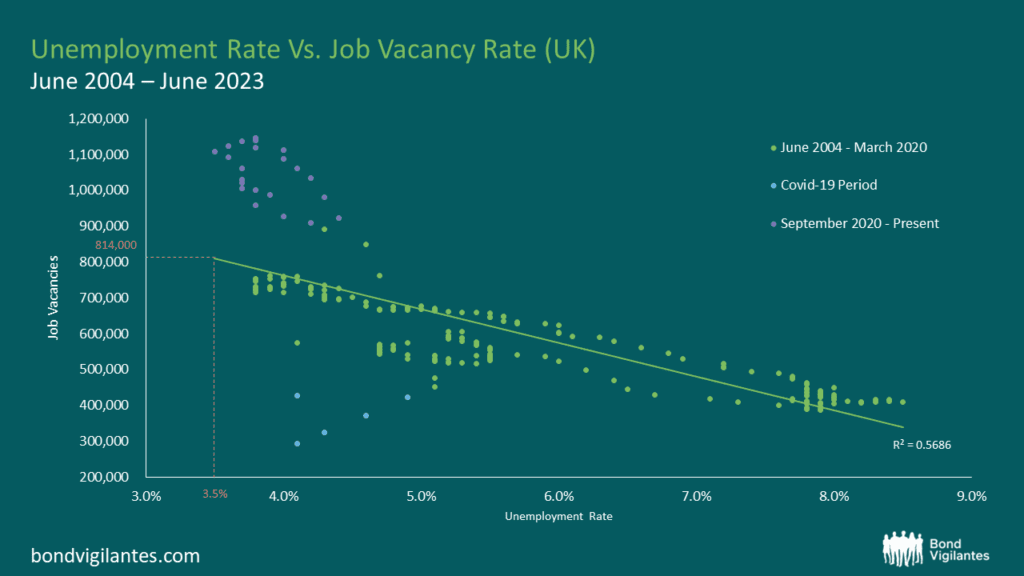
In 1943, the Escape Committee of Stalag Luft III was tasked with digging a tunnel to freedom. Unfortunately, they had a problem. They needed to measure the distance between one of the prisoner’s huts and the forest beyond the prison perimeter, but they had no reliable tools to measure this critical variable. Fortunately they had two mathematicians within the group who came up with a method to gauge the distance to the forest so that the tunnel would be long enough to ensure escape without detection. The idea was to eyeball the distance using a 20 foot tree for scale (the tree was the one ‘accurate’ measurement around which they could work with). They got individual prisoners to gauge the distance from the hut to the tree and then averaged all of the estimates. The critical distance measure was therefore the average of a large sample size of guesstimates. Fortunately, it more or less worked. Happily, modern economists have an equivalent to rely on in the area of unemployment. Their version of the Stalag Luft III tree strategy is something called the Beveridge Curve.
The Beveridge Curve is simply an observed relationship between an economy’s unemployment rate and its job vacancy rate at the same point in time. An excellent exposition can be found in the Bond Vigilantes archive[2]. When you plot the two variables against one another over a given period, the data points disclose a curve. This curve shows us that when unemployment increases, job vacancies decrease and vice versa. I have plotted the current curve below using the available data from the Office for National Statistics (ONS)[3]. The bottom left quadrant of the graph (the blue dots) relate to the Covid-19 era and the top left quadrant (the purple dots) represent the last 2 years’ worth of data. The green dots represent the remaining data from July 2004 to June 2023.
Source: Office for National Statistics, Dataset JP9Z & UNEM

Source: Office for National Statistics, Dataset JP9Z & UNEM
From these charts and new data from the ONS, we can observe that in the UK, the level of unemployment is increasing and that the job vacancy rate is decreasing. At face value, this suggests that current Bank of England monetary policy is working and that the inflation rate is slowing as the economy cools. One could argue that we are on track for a reasonably soft landing. Nothing new so far.
Things become more interesting when we consider the Beveridge Curve in conjunction with the most recent job vacancy data. We are told that there are now 814,000 job vacancies as of the 31st December 2023[4]. Ordinarily, we would use the curve and clearly be able to extrapolate from the Job Vacancy data what our Unemployment figure might be. However, we also know that the current unemployment data is unreliable, which makes this harder. Using our model inclusive of data oddities, we could extrapolate that with 814,000 job vacancies, we might expect an unemployment rate of around 3.5%. Yet, we know that our unemployment figures are unreliable so the question therefore is, how big an increase in unemployment are we likely to see given what we know about job vacancies?
In order to estimate the magnitude of the rise in unemployment, we need to look further afield. If we study the levels of economic inactivity in the UK, we can observe that they have remained stationary at 22%[5] for the last decade. We can also see that the population of the UK has risen over the same period by around 5.91%[6]. Further, we know that the Labour Force Survey (LFS) samples 40,000 households per quarter to obtain its data, but of late has had a response rate of only 15% (6,000 households). Therefore a critical question for policy makers is what is happening with the 85%, the non-responders?
Given the small sample size, it is entirely possible that the LFS suffered survey bias that is being erroneously weighted away. In other words, the LFS compensates for the paucity of response data by accessing other regional population statistics as a legitimate part of their methodology. The problems of non-responders are being addressed in upcoming LFS releases but for the time being, the data is not as clear as it ought to be. With such a small sample size, it seems possible – indeed probable – that unemployment levels are being underreported. This would explain why the current unemployment rate of 3.8%[7] is dramatically lower than the historic average of 6.7% (1971-2023). We see further evidence for this in the forecasts of the UK’s unemployment rate on Bloomberg which have been consistently above the actual levels for the last few published data points. So whilst the published headline figures might be looking reasonable, the underlying story looks like it could be hiding something more sinister.
Through it all, the Beveridge Curve remains a reasonable template. Job vacancies are definitely falling, so we should expect to see unemployment rising. Like the Stalag Luft III measurement solution, the Beveridge Curve offers a constructive way out of our present statistical dilemma. That being said, analogies can only be taken so far. Unfortunately for the inmates of Stalag Luft III, the calculation didn’t quite work and the tunnel came up short. No one actually made a Great Escape. What does this mean for UK unemployment data? Time may tell.
[1] The UK’s ‘official’ labour data is becoming a nonsense (harvard.edu)
[2] https://bondvigilantes.com/blog/2013/11/a-shifting-beveridge-curve-does-the-us-have-a-long-term-structural-unemployment-problem/
[3] Unemployment – Office for National Statistics (ons.gov.uk)
[4] https://www.ons.gov.uk/employmentandlabourmarket/peopleinwork/employmentandemployeetypes/timeseries/jp9z/unem
[5] https://www.ethnicity-facts-figures.service.gov.uk/work-pay-and-benefits/unemployment-and-economic-inactivity/economic-inactivity/latest/#:~:text=data%20shows%20that%3A-,22%25%20of%20working%20age%20people%20in%20England%2C%20Scotland%20and%20Wales,for%20a%20job)%20in%202022
[6] https://www.ons.gov.uk/peoplepopulationandcommunity/populationandmigration/populationestimates/bulletins/annualmidyearpopulationestimates/mid2021
[7] https://www.ons.gov.uk/employmentandlabourmarket/peoplenotinwork/unemployment
unemployment covid-19 monetary policy unemployment ukInternational
Germany Is Running Out Of Money And Debt Levels Are Exploding, Finance Minister Warns
Germany Is Running Out Of Money And Debt Levels Are Exploding, Finance Minister Warns
By John Cody of Remix News
German Finance Minister…
Share this:


By John Cody of Remix News
German Finance Minister Christian Lindner is warning his own government that state finances are quickly growing out of hand, and the government needs to change course and implement austerity measures. However, the dispute over spending is only expected to escalate, with budget shortfalls causing open clashes among the three-way left-liberal coalition running the country.
With negotiations kicking off for the 2025 budget, much is at stake. However, the picture has been complicated after the country’s top court ruled that the government could not shift €60 billion in money earmarked for the coronavirus crisis to other areas of the budget, with the court noting that the move was unconstitutional.
Since then, the government has been in crisis mode, and sought to cut the budget in a number of areas, including against the country’s farmers. Those cuts already sparked mass protests, showcasing how delicate the situation remains for the government.

Lindner, whose party has taken a beating in the polls, is desperate to create some distance from his coalition partners and save his party from electoral disaster. The finance minster says the financial picture facing Germany is dire, and that the budget shortfall will only grow in the coming years if measures are not taken to rein in spending.
“In an unfavorable scenario, the increasing financing deficits lead to an increase in debt in relation to economic output to around 345 percent in the long term,” reads the Sustainability Report released by his office. “In a favorable scenario, the rate will rise to around 140 percent of gross domestic product by 2070.”
Under EU law, Germany has limited its debt levels to 60 percent of economic output, which requires dramatic savings. A huge factor is Germany’s rapidly aging population, with a debt explosion on the horizon as more and more citizens head into retirement while tax revenues shrink and the social welfare system grows — in part due to the country’s exploding immigrant population.
Lindner’s partners, the Greens and Social Democrats (SPD), are loath to cut spending further, as this will harm their electoral chances. In fact, Labor Minister Hubertus Heil is pushing for a new pension package that will add billions to the country’s debt, which remarkably, Lindner also supports.
Continue reading at rmx.news


Mistakes Were Made


Home buyers must now navigate higher mortgage rates and prices


Supreme Court Rules Public Officials May Block Their Constituents On Social Media


Women’s basketball is gaining ground, but is March Madness ready to rival the men’s game?


Gen Z, The Most Pessimistic Generation In History, May Decide The Election


“Extreme Events”: US Cancer Deaths Spiked In 2021 And 2022 In “Large Excess Over Trend”


Harvard Medical School Professor Was Fired Over Not Getting COVID Vaccine


Germany Is Running Out Of Money And Debt Levels Are Exploding, Finance Minister Warns


Default: San Francisco Four Seasons Hotel Investors $3 Million Late On Loan As Foreclosure Looms


You can strike gold and silver investment opportunities at Costco
-

 Uncategorized4 weeks ago
All Of The Elements Are In Place For An Economic Crisis Of Staggering Proportions
-

 International1 week ago
EyePoint poaches medical chief from Apellis; Sandoz CFO, longtime BioNTech exec to retire
-

 Spread & Containment5 days ago
IFM’s Hat Trick and Reflections On Option-To-Buy M&A
-

 Uncategorized1 month ago
California Counties Could Be Forced To Pay $300 Million To Cover COVID-Era Program
-

 Uncategorized3 weeks ago
Apparel Retailer Express Moving Toward Bankruptcy
-

 Uncategorized1 month ago
Industrial Production Decreased 0.1% in January
-

 International1 week ago
Walmart launches clever answer to Target’s new membership program
-

 Uncategorized1 month ago
RFK Jr: The Wuhan Cover-Up & The Rise Of The Biowarfare-Industrial Complex