Uncategorized
Bitcoin shrugs off BlockFi, China protests as BTC price holds $16K
BTC price action heads higher with Bitcoin joining Asia stocks in a rebound despite FTX pressures continuing.
Bitcoin (BTC) held crucial…
Share this:


BTC price action heads higher with Bitcoin joining Asia stocks in a rebound despite FTX pressures continuing.
Bitcoin (BTC) held crucial $16,000 support into Nov. 29 as bulls weathered ongoing FTX fallout and macro triggers.

Trader teases BTC long as $16,500 reappears
Data from Cointelegraph Markets Pro and TradingView confirmed BTC/USD leaving lower levels untouched overnight.
The pair had seen a flash downturn after the Nov. 27 weekly close thanks to uncertainty from China over COVID-19 measures.
A recovery nonetheless took the market higher, with $16,500 coming into play at the time of writing.
As Cointelegraph reported, traders and analysts had warned that it was all but essential to preserve current support, with a violation opening up the road to $14,000 or lower.
Popular trader Crypto Tony even felt comfortable going long BTC on the day.
“Flipping the EQ would be a safer long entry, but keeping this open with a tight stop loss is the best way for me,” he revealed to Twitter followers.
An accompanying chart identified support and resistance zones in play on midrange timeframes.

Even fresh repercussions over the FTX debacle failed to dent Bitcoin’s performance. Meanwhile, these came in the form of a bankruptcy filing and lawsuit from crypto lender BlockFi.
The latest in a chain reaction sparked by FTX going under, the news came alongside a surprise resumption of salary payments by the defunct exchange.
“Makes sense after this bounce, as we've created a HL on Bitcoin and aiming at resistance again,” Michaël van de Poppe, founder and CEO of trading firm Eight, continued about a higher low (HL) on the 4-hour chart:
“Taking out the range between $16.5-16.8K would trigger continuation towards $18K.”

China woes cool ahead of Fed Powell speech
China meanwhile formed the main macro focus on the day, with anti-lockdown protests’ impact on market sentiment nonetheless seeming to ease.
Related: New BTC miner capitulation? 5 things to know in Bitcoin this week
Asian markets bounced back strongly, with Hong Kong’s Hang Seng up 5.2% at the time of writing and the Shanghai Composite Index gaining 2.3%.

“We do not expect China policy to publicly shift away from the Zero Covid stance, however, we could see some easing of the policy privately and in localized areas,” Mohit Kumar, an analyst at investment banking firm Jefferies, wrote in a note quoted by Bloomberg.
Nov. 30 looked set to be the key trading day of the week, with Bitcoin’s monthly close accompanied by a speech from Jerome Powell, Chair of the United States Federal Reserve.
The views, thoughts and opinions expressed here are the authors’ alone and do not necessarily reflect or represent the views and opinions of Cointelegraph.
shanghai composite stocks covid-19 bitcoin crypto btc cryptoUncategorized
One more airline cracks down on lounge crowding in a way you won’t like
Qantas Airways is increasing the price of accessing its network of lounges by as much as 17%.
Share this:

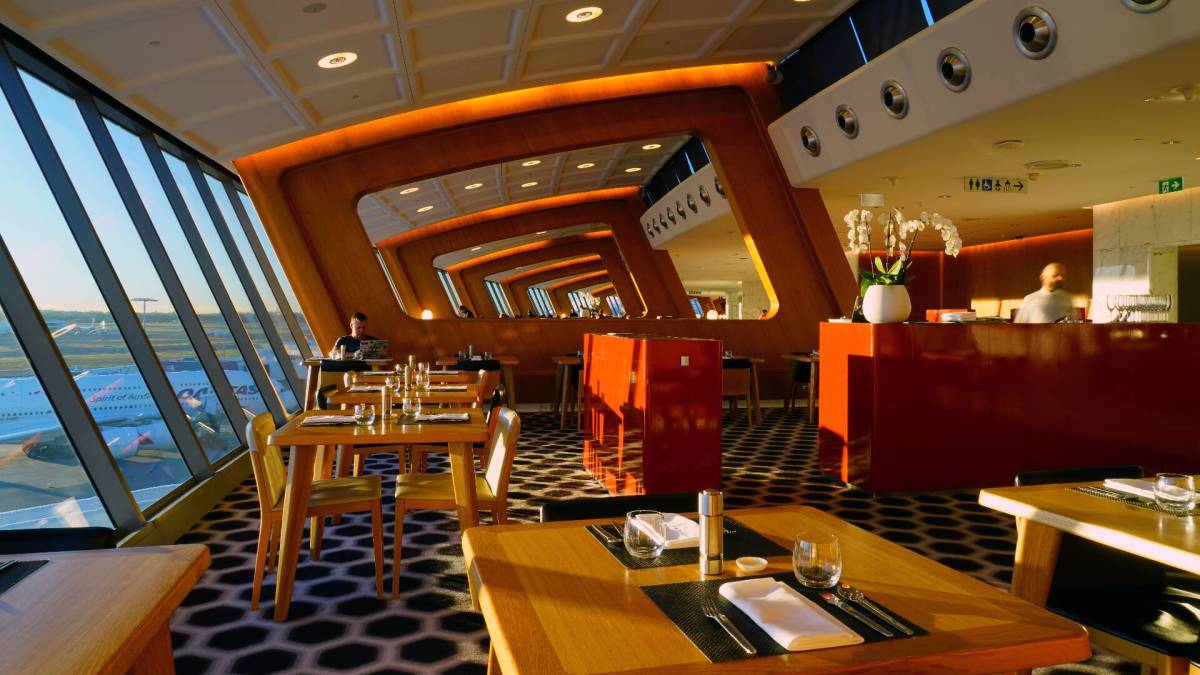
Over the last two years, multiple airlines have dealt with crowding in their lounges. While they are designed as a luxury experience for a small subset of travelers, high numbers of people taking a trip post-pandemic as well as the different ways they are able to gain access through status or certain credit cards made it difficult for some airlines to keep up with keeping foods stocked, common areas clean and having enough staff to serve bar drinks at the rate that customers expect them.
In the fall of 2023, Delta Air Lines (DAL) caught serious traveler outcry after announcing that it was cracking down on crowding by raising how much one needs to spend for lounge access and limiting the number of times one can enter those lounges.
Related: Competitors pushed Delta to backtrack on its lounge and loyalty program changes
Some airlines saw the outcry with Delta as their chance to reassure customers that they would not raise their fees while others waited for the storm to pass to quietly implement their own increases.
Shutterstock
This is how much more you'll have to pay for Qantas lounge access
Australia's flagship carrier Qantas Airways (QUBSF) is the latest airline to announce that it would raise the cost accessing the 24 lounges across the country as well as the 600 international lounges available at airports across the world through partner airlines.
More Travel:
- A new travel term is taking over the internet (and reaching airlines and hotels)
- The 10 best airline stocks to buy now
- Airlines see a new kind of traveler at the front of the plane
Unlike other airlines which grant access primarily after reaching frequent flyer status, Qantas also sells it through a membership — starting from April 18, 2024, prices will rise from $600 Australian dollars ($392 USD) to $699 AUD ($456 USD) for one year, $1,100 ($718 USD) to $1,299 ($848 USD) for two years and $2,000 AUD ($1,304) to lock in the rate for four years.
Those signing up for lounge access for the first time also currently pay a joining fee of $99 AUD ($65 USD) that will rise to $129 AUD ($85 USD).
The airline also allows customers to purchase their membership with Qantas Points they collect through frequent travel; the membership fees are also being raised by the equivalent amount in points in what adds up to as much as 17% — from 308,000 to 399,900 to lock in access for four years.
Airline says hikes will 'cover cost increases passed on from suppliers'
"This is the first time the Qantas Club membership fees have increased in seven years and will help cover cost increases passed on from a range of suppliers over that time," a Qantas spokesperson confirmed to Simple Flying. "This follows a reduction in the membership fees for several years during the pandemic."
The spokesperson said the gains from the increases will go both towards making up for inflation-related costs and keeping existing lounges looking modern by updating features like furniture and décor.
While the price increases also do not apply for those who earned lounge access through frequent flyer status or change what it takes to earn that status, Qantas is also introducing even steeper increases for those renewing a membership or adding additional features such as spouse and partner memberships.
In some cases, the cost of these features will nearly double from what members are paying now.
stocks pandemicUncategorized
Star Wars icon gives his support to Disney, Bob Iger
Disney shareholders have a huge decision to make on April 3.
Share this:
Disney's (DIS) been facing some headwinds up top, but its leadership just got backing from one of the company's more prominent investors.
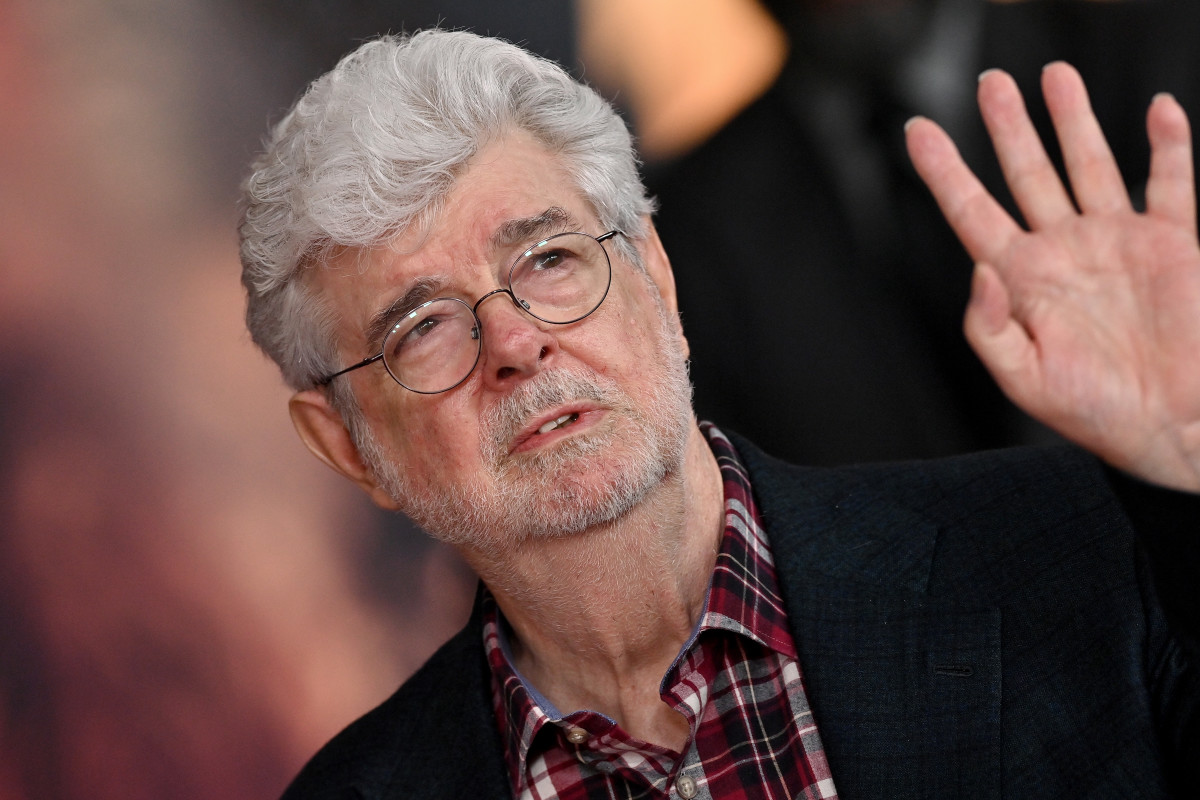
Star Wars creator George Lucas put out of statement in support of the company's current leadership team, led by CEO Bob Iger, ahead of the April 3 shareholders meeting which will see investors vote on the company's 12-member board.
"Creating magic is not for amateurs," Lucas said in a statement. "When I sold Lucasfilm just over a decade ago, I was delighted to become a Disney shareholder because of my long-time admiration for its iconic brand and Bob Iger’s leadership. When Bob recently returned to the company during a difficult time, I was relieved. No one knows Disney better. I remain a significant shareholder because I have full faith and confidence in the power of Disney and Bob’s track record of driving long-term value. I have voted all of my shares for Disney’s 12 directors and urge other shareholders to do the same."
Related: Disney stands against Nelson Peltz as leadership succession plan heats up
Lucasfilm was acquired by Disney for $4 billion in 2012 — notably under the first term of Iger. He received over 37 million in shares of Disney during the acquisition.
Lucas' statement seems to be an attempt to push investors away from the criticism coming from The Trian Partners investment group, led by Nelson Peltz. The group, owns about $3 million in shares of the media giant, is pushing two candidates for positions on the board, which are Peltz and former Disney CFO Jay Rasulo.
Peltz and Co. have called out a pair of Disney directors — Michael Froman and Maria Elena Lagomasino — for their lack of experience in the media space.
Related: Women's basketball is gaining ground, but is March Madness ready to rival the men's game?
Blackwells Capital is also pushing three of its candidates to take seats during the early April shareholder meeting, though Reuters has reported that the firm has been supportive of the company's current direction.
Disney has struggled in recent years amid the changes in media and the effects of the pandemic — which triggered the return of Iger at the helm in late 2022. After going through mass layoffs in the spring of 2023 and focusing on key growth brands, the company has seen a steady recovery with its stock up over 25% year-to-date and around 40% for the last six months.
Related: Veteran fund manager picks favorite stocks for 2024
stocks pandemic recoveryUncategorized
Another airline is making lounge fees more expensive
Qantas Airways is increasing the price of accessing its network of lounges by as much as 17%.
Share this:

Over the last two years, multiple airlines have dealt with crowding in their lounges. While they are designed as a luxury experience for a small subset of travelers, high numbers of people taking a trip post-pandemic as well as the different ways they are able to gain access through status or certain credit cards made it difficult for some airlines to keep up with keeping foods stocked, common areas clean and having enough staff to serve bar drinks at the rate that customers expect them.
In the fall of 2023, Delta Air Lines (DAL) caught serious traveler outcry after announcing that it was cracking down on crowding by raising how much one needs to spend for lounge access and limiting the number of times one can enter those lounges.
Related: Competitors pushed Delta to backtrack on its lounge and loyalty program changes
Some airlines saw the outcry with Delta as their chance to reassure customers that they would not raise their fees while others waited for the storm to pass to quietly implement their own increases.
Shutterstock
This is how much more you'll have to pay for Qantas lounge access
Australia's flagship carrier Qantas Airways (QUBSF) is the latest airline to announce that it would raise the cost accessing the 24 lounges across the country as well as the 600 international lounges available at airports across the world through partner airlines.
More Travel:
- A new travel term is taking over the internet (and reaching airlines and hotels)
- The 10 best airline stocks to buy now
- Airlines see a new kind of traveler at the front of the plane
Unlike other airlines which grant access primarily after reaching frequent flyer status, Qantas also sells it through a membership — starting from April 18, 2024, prices will rise from $600 Australian dollars ($392 USD) to $699 AUD ($456 USD) for one year, $1,100 ($718 USD) to $1,299 ($848 USD) for two years and $2,000 AUD ($1,304) to lock in the rate for four years.
Those signing up for lounge access for the first time also currently pay a joining fee of $99 AUD ($65 USD) that will rise to $129 AUD ($85 USD).
The airline also allows customers to purchase their membership with Qantas Points they collect through frequent travel; the membership fees are also being raised by the equivalent amount in points in what adds up to as much as 17% — from 308,000 to 399,900 to lock in access for four years.
Airline says hikes will 'cover cost increases passed on from suppliers'
"This is the first time the Qantas Club membership fees have increased in seven years and will help cover cost increases passed on from a range of suppliers over that time," a Qantas spokesperson confirmed to Simple Flying. "This follows a reduction in the membership fees for several years during the pandemic."
The spokesperson said the gains from the increases will go both towards making up for inflation-related costs and keeping existing lounges looking modern by updating features like furniture and décor.
While the price increases also do not apply for those who earned lounge access through frequent flyer status or change what it takes to earn that status, Qantas is also introducing even steeper increases for those renewing a membership or adding additional features such as spouse and partner memberships.
In some cases, the cost of these features will nearly double from what members are paying now.
stocks pandemic

Manufacturing and construction vs. the still-inverted yield curve


When words make you sick


Default: San Francisco Four Seasons Hotel Investors $3 Million Late On Loan As Foreclosure Looms


How much stress is too much? A psychiatrist explains the links between toxic stress and poor health − and how to get help


Caitlin Clark, Coach Prime, and Linsanity: The Anatomy of a Viewership ‘Craze’


Half Of Downtown Pittsburgh Office Space Could Be Empty In 4 Years


US Economic Conditions Scream “Buy Gold”


Wall Street Bonuses Fall For Second Year To 2019 Lows Amid Capital Markets Freeze


Airline, travel companies face Chapter 11 bankruptcy, default risk


One more airline cracks down on lounge crowding in a way you won’t like
-

 Spread & Containment6 days ago
IFM’s Hat Trick and Reflections On Option-To-Buy M&A
-

 Uncategorized4 weeks ago
All Of The Elements Are In Place For An Economic Crisis Of Staggering Proportions
-

 International2 weeks ago
EyePoint poaches medical chief from Apellis; Sandoz CFO, longtime BioNTech exec to retire
-

 Uncategorized1 month ago
California Counties Could Be Forced To Pay $300 Million To Cover COVID-Era Program
-

 Uncategorized4 weeks ago
Apparel Retailer Express Moving Toward Bankruptcy
-

 Uncategorized1 month ago
Industrial Production Decreased 0.1% in January
-

 International2 weeks ago
Walmart launches clever answer to Target’s new membership program
-

 Uncategorized1 month ago
RFK Jr: The Wuhan Cover-Up & The Rise Of The Biowarfare-Industrial Complex