International
Aurora Cannabis Announces Fiscal 2021 Fourth Quarter Results
NASDAQ | TSX: ACB
#1 Canadian LP in Global Medical Cannabis; Total Medical Cannabis Net Revenue Rose 9% Compared to Prior Year; Strong Adjusted Gross Margin before FVA of 68%
Business Transformation Plan on Track; Reiterates Annual Cost Savings.
Share this:


NASDAQ | TSX: ACB
- #1 Canadian LP in Global Medical Cannabis; Total Medical Cannabis Net Revenue Rose 9% Compared to Prior Year; Strong Adjusted Gross Margin before FVA of 68%
- Business Transformation Plan on Track; Reiterates Annual Cost Savings of $60 Million to $80 Million , Providing Clear Pathway to Adjusted EBITDA Profitability
- Balance Sheet Remains Strong with $440.9 Million of Cash at June 30, 2021 ; Working Capital Improves by $404.3 Million Compared to Prior Year
- Adjusted EBITDA Loss, Excluding Restructuring Costs, Narrows to $13.9 Million , a $17.6 Million Improvement Compared to Prior Year
- Total Cannabis Net Revenue, Net of Provisions, of $54.8 Million Compared to $55.2 Million in the Prior Quarter, and $67.5 Million in the Year-Ago Period
Aurora Cannabis Inc. (the “Company” or “Aurora”) (NASDAQ: ACB) (TSX: ACB), the Canadian company defining the future of cannabinoids worldwide, today announced its financial and operational results for the fourth quarter and full year fiscal 2021 ended June 30, 2021 .
“We are very pleased with our strategic and financial progress in growing our high-margin medical revenue, rationalizing expenses, strengthening our balance sheet, and reducing our cash burn during fiscal year 2021. Given ongoing challenges in the Canadian adult recreational market, our broad diversification across domestic medical, international medical, and adult recreational segments provides us with underlying strength, stability, and growth opportunities in an evolving industry for global cannabinoids. Additionally, our enviable leadership position as the #1 Canadian LP in global medical cannabis by revenue on a trailing twelve-month basis, supported by regulatory and compliance expertise, is a tailwind that we expect to enable us to ultimately expand into global adult recreational as medical regimes evolve” stated Miguel Martin , Chief Executive Officer of Aurora Cannabis.
“During the quarter, we delivered another strong yet steady performance in domestic medical, the largest federally regulated medical market globally, exceptional year-over-year growth in our high-margin international medical segment, where we remain the #2 Canadian LP by revenue on a trailing twelve-month basis, and quarterly sequential growth in adult recreational which included higher sales of premium cultivars. We are now delighted to announce a long-term supply agreement with Cantek in Israel that we expect to provide us with a steady stream of high-margin revenue that could also evolve into a larger partnership over time. We further believe our Canadian adult recreational segment is poised for recovery due to our product portfolio enhancements coupled with an acceleration of new store openings and rising consumer demand,” he continued.
“We have positioned ourselves for long-term success by delivering further improvement in our industry-leading Adjusted gross margin and substantially narrowing our Adjusted EBITDA loss compared to the year-ago period. With annual cost savings of approximately $60 to $80 million across selling, general and administrative (“SG&A”), production cost, facility and logistic expenses, we have a clear pathway to achieve Adjusted EBITDA profitability. Importantly, our considerable cash balance of $440.9 million , substantial improvement in working capital, and strong balance sheet support our organic growth and can be utilized for opportunistic M&A, particularly in the U.S,” he concluded.
Fourth Quarter 2021 Highlights
(Unless otherwise stated, comparisons are made between fiscal Q4 2021 and Q4 2020 results and are in Canadian dollars)
Medical cannabis:
- Medical cannabis net revenue 1 was $35.0 million , a 9% increase from the prior year period. The increase was primarily attributable to continued growth in the international medical business, 88% over the prior year comparative period, as the Company continued to grow new, high margin medical markets.
- Adjusted gross margin before fair value adjustments on medical cannabis net revenue 1 was 68% versus 64% in the prior year, as a result of overall reduction in production costs due to the closure of non-core facilities as part of our business transformation plan and higher sales coming from our international sales, which yield higher margins.
Consumer cannabis:
- Consumer cannabis net revenue 1 was $19.5 million ( $20.2 million excluding provisions), a 45% decrease from $35.3 million ( $37.1 million excluding provisions) in the prior year. This was due primarily to a reduction in orders from Provinces in response to slower consumer demand, reflecting the impact of lockdown restrictions related to COVID-19. Sequentially, consumer cannabis net revenue increased 8% over the prior quarter mainly due to completion of the transition of our fixed sales force to Great North and a $2.5 million reduction in actual net returns, price adjustments and provisions as the company completed its product swap initiative to replace low quality product with higher potency product at the provinces.
- Adjusted gross margin before fair value adjustments on consumer cannabis net revenue[1] was 31% vs 36% in the prior year period. This was primarily driven by an increase in cost of sales due to under-utilized capacity at Aurora Sky as a result of the scaling back production (expected to partially reverse in future quarters), offset by an increase in the consumer cannabis sales mix attributed to our core and premium brands, contributing to an increase in our average net selling price per gram of dried cannabis.
Consolidated:
- Adjusted gross margin before fair value adjustments on cannabis net revenue1 was 54% in Q4 2021 versus 49% in the prior year period and 44% in Q3 2021. The increase in Adjusted gross margin compared to Q4 2020 is due primarily to a shift in sales mix towards the medical market which commands higher average net selling prices and margins.
- Adjusted EBITDA 1 loss improved to $19.3 million in Q4 2021 ( $13.9 million loss excluding restructuring charges) compared to the prior year Adjusted EBITDA loss 1 of $33.3 million ( $31.5 million loss excluding restructuring charges) primarily driven by the substantial decrease in SG&A and R&D expenses and an increase in gross margins.
- Q4 2021 total cannabis net revenue 1 was $54.8 million , essentially flat sequentially, and a 19% decrease in over fiscal Q4 of the prior year.
- Reflecting the shift in mix toward our medical businesses, the Q4 2021 average net selling price per gram of dried cannabis 1 increased to $5.11 per gram from $3.60 in Q4 2020 and $5.00 in Q3 2021. This excludes the impact of bulk wholesale of excess mid-potency cannabis flower at clear-out pricing.
Selling, General and Administrative (“SG&A”) :
- SG&A, including Research and Development (“R&D”), was $44.8 million , excluding $5.2 million in severance and restructuring costs ( $49.9 million reported), down $19.1 million or 30% from the prior year as a result of our business transformation plan.
Operational Efficiency Plan, Balance Sheet Strength, & Working Capital Improvement
Aurora has identified cash savings of $60 million to $80 million . We expect to deliver $30 million to $40 million of annualized cash savings within the next year, and the remainder by the end of Q2 fiscal 2023.
|
___________________________________ |
|
|
1 |
These terms are non-GAAP measures, see “Non-GAAP Measures” below. |
Approximately 60% of the savings are expected to be driven out of our network through asset consolidation, and operational and supply chain efficiencies. In fact, last week we announced the centralization of much of our Canadian manufacturing processes to our River facility in Bradford, Ontario and the resultant closure of our western Canada manufacturing facility. The remaining 40% of savings are intended to be sourced through SG&A a portion of those savings will be via insurance structures that are already partially executed.
These cash savings will be reflected in our P&L either as they occur for SG&A savings, or as inventory is drawn down for production-related savings. These efficiencies are incremental to the approximately $300 million of total cost reductions achieved since the announcement of the Company’s business transformation plan in February 2020 .
Aurora materially improved its balance sheet during fiscal year 2021 through a number of purposeful actions including repaying the credit facility in full in June 2021 , which resulted in interest and principal repayment reductions of approximately $25 million annually. The Company views a strong balance sheet as critical to operating the business, executing its strategic plans, and pursuing growth opportunities in an unconstrained manner, including within the U.S.
At June 30, 2021 Aurora has a cash balance of approximately $440.9 million , comprised of $421.5 million of cash and cash equivalents and $19.4 million in restricted cash, no secured term debt, and access to US$1 billion of capital under its shelf prospectus.
The Company’s focus on realizing operational efficiencies and ability to manage cash has greatly improved operating cash flow; reducing the need for incremental capital. In Q4 2021, Aurora managed cash flow tightly using $7.8 million in cash to fund operations, including working capital investments and restructuring and severance payments of $5.1 million . Cash inflow from capital expenditures, net of $17.5 million disposals and government grant income, in Q4 2021 was $6.2 million versus $32.8 million of cash used in Q4 2020 and $12.2 million of cash used in Q3 2021. Cash used in operations and for capital expenditures are crucial metrics in Aurora’s drive toward generating sustainable positive free cash flow, and both have improved significantly over the past year. The Company’s ongoing business transformation, with the additional cost efficiency savings described earlier, is expected to move the operating cash flow metric in a positive direction over the coming quarters.
Fiscal Q4 2021 Cash Use
The main components of cash source and use in Q4 2021 were as follows:
|
($ thousands) |
Q4 2021 |
Q4 2020 (4) |
Q3 2021 (4) |
|
Cash Flow |
|||
|
Cash, Opening |
$520,238 |
$230,208 |
$434,386 |
|
Cash used in operations including working |
($7,840) |
($64,199) |
($66,215) |
|
Capital expenditures, net of disposals and |
$6,230 |
($32,789) |
($12,320) |
|
Debt and interest payments |
($90,141) (3) |
($52,979) |
($7,766) |
|
Cash use |
($91,751) |
($149,967) |
($86,301) |
|
Proceeds raised from sale of marketable |
11,929 |
33,673 |
$- |
|
Proceeds raised through debt |
– |
– |
– |
|
Proceeds raised through equity financing |
$435 |
$48,265 |
$172,153 (1) |
|
Cash raised |
$12,364 |
$81,938 |
$172,153 |
|
Cash, Ending |
$440,851 |
$162,179 |
$520,238 (2) |
|
(1) |
Includes impact of foreign exchange rates on USD cash raised from financing |
|
(2) |
Includes restricted cash of $50.0M for Q3 2021 held as cash collateral under the BMO Credit Facility. |
|
(3) |
Includes $88.7 million full principal repayment on the BMO Credit Facility. As of June 30, 2021, the BMO Credit Facility has been fully settled and discharged. |
|
(4) |
Previously reported amounts have been retroactively recast for the biological assets and inventory non-material prior period error. Refer to the ” Significant Accounting Policies and Judgments ” section in Note 2(h) of the Financial Statements. |
Refer to the “Consolidated Statement of Cash Flows” in the “Consolidated Financial Statements” for our cash flow statements prepared in accordance with IAS 7 – Statement of Cash Flows.
|
($ thousands, except Operational Results) |
Q4 2021 |
Q4 2020 (5)(6) |
$ Change |
% Change |
Q3 2021 (5)(6) |
$ Change |
% Change |
|||||||
|
Financial Results |
||||||||||||||
|
Total net revenue (1) |
$54,825 |
$68,426 |
($13,601) |
(20) |
% |
$55,161 |
($336) |
(1) |
% |
|||||
|
Cannabis net revenue (1)(2a) |
$54,825 |
$67,492 |
($12,667) |
(19) |
% |
$55,161 |
($336) |
(1) |
% |
|||||
|
Medical cannabis net revenue (2a) |
$35,022 |
$32,226 |
$2,796 |
9 |
% |
$36,378 |
($1,356) |
(4) |
% |
|||||
|
Consumer cannabis net revenue (1)(2a) |
$19,514 |
$35,266 |
($15,752) |
(45) |
% |
$18,023 |
$1,491 |
8 |
% |
|||||
|
Adjusted gross margin before FV adjustments |
54 |
% |
49 |
% |
N/A |
5 |
% |
44 |
% |
N/A |
10 |
% |
||
|
Adjusted gross margin before FV adjustments |
68 |
% |
64 |
% |
N/A |
4 |
% |
53 |
% |
N/A |
15 |
% |
||
|
Adjusted gross margin before FV adjustments |
31 |
% |
36 |
% |
N/A |
(5) |
% |
33 |
% |
N/A |
(2) |
% |
||
|
SG&A expense |
$46,902 |
$57,969 |
($11,067) |
(19) |
% |
$41,684 |
$5,218 |
13 |
% |
|||||
|
R&D expense |
$3,034 |
$7,645 |
($4,611) |
(60) |
% |
$3,398 |
($364) |
(11) |
% |
|||||
|
Adjusted EBITDA (2c) |
($19,256) |
($33,349) |
$14,093 |
42 |
% |
($23,853) |
$4,597 |
19 |
% |
|||||
|
Balance Sheet |
||||||||||||||
|
Working capital |
$549,517 |
$145,258 |
$404,259 |
278 |
% |
$646,310 |
($96,793) |
(15) |
% |
|||||
|
Cannabis inventory and biological assets (3) (2)(3)(7) |
$120,297 |
$135,973 |
($15,676) |
(12) |
% |
$102,637 |
$17,660 |
17 |
% |
|||||
|
Total assets |
$2,604,731 |
$2,779,921 |
($175,190) |
(6) |
% |
$2,839,155 |
($234,424) |
(8) |
% |
|||||
|
Operational Results – Cannabis |
||||||||||||||
|
Average net selling price of dried cannabis |
$5.11 |
$3.60 |
$1.51 |
42 |
% |
$5.00 |
$0.11 |
2 |
% |
|||||
|
Kilograms sold (4) |
11,346 |
16,748 |
(5,402) |
(32) |
% |
13,520 |
(2,174) |
(16) |
% |
|||||
|
(1) |
Includes the impact of actual and expected product returns and price adjustments (Q4 2021 – $0.7 million; Q3 2021 – $3.2 million; Q4 2020 – $1.9 million). |
|
|
(2) |
These terms are defined in the ” Cautionary Statement Regarding Certain Non-GAAP Performance Measures ” of the MD&A. Refer to the following MD&A sections for reconciliation of non-GAAP measures to the IFRS equivalent measure: |
|
|
a. Refer to the ” Revenue ” section for a reconciliation of cannabis net revenue to the IFRS equivalent. |
||
|
b. Refer to the ” Cost of Sales and Gross Margin ” section for reconciliation to the IFRS equivalent. |
||
|
c. Refer to the ” Adjusted EBITDA” section for reconciliation to the IFRS equivalent. |
||
|
(3) |
Represents total biological assets and cannabis inventory, exclusive of merchandise, accessories, supplies and consumables. |
|
|
(4) |
The kilograms sold is offset by the grams returned during the period. |
|
|
(5) |
As a result of the Company’s dissolution and divestment of its wholly owned subsidiaries, Hempco Food and Fiber Inc. (“Hempco”), Aurora Larssen Projects (“ALPS”), Aurora Hemp Europe (“AHE”), the operations of Hempco, ALPS and AHE have been presented as discontinued operations and the Company’s operational results have been retroactively restated, as required. Refer to Note 12(b) of the Financial Statements for more information about the divestitures. |
|
|
(6) |
Amounts have been retroactively recast for the biological assets and inventory non-material prior period error. Refer to the ” Significant Accounting Policies and Judgments ” section in Note 2(h) of the Financial Statements. |
|
Conference Call
Aurora will host a conference call today, September 27, 2021, to discuss these results. Miguel Martin, Chief Executive Officer, and Glen Ibbott , Chief Financial Officer, will host the call starting at 5:00 p.m. Eastern time / 3:00 p.m. Mountain Time . A question and answer session will follow management’s presentation.
Conference Call Details
|
DATE: |
Tuesday, September 27, 2021 |
|
|
TIME: |
5:00 p.m. Eastern Time | 3:00 p.m. Mountain Time |
|
|
WEBCAST: |
Investors may submit questions in advance or during the conference call itself through same weblink listed above. This weblink has also been posted to the Company’s “Investor Info” link at https://investor.auroramj.com/ under “News & Events”.
About Aurora
Aurora is a global leader in the cannabis industry serving both the medical and consumer markets. Headquartered in Edmonton, Alberta , Aurora is a pioneer in global cannabis dedicated to helping people improve their lives. The Company’s brand portfolio includes Aurora, Aurora Drift, San Rafael ’71, Daily Special, MedReleaf, CanniMed, Whistler, and Reliva CBD. Driven by science and innovation, and with a focus on high-quality cannabis products, Aurora’s brands continue to break through as industry leaders in the medical, performance, wellness and adult recreational markets wherever they are launched. For more information, please visit our website at www.auroramj.com .
Aurora’s common shares trade on the NASDAQ and TSX under the symbol “ACB” and is a constituent of the S&P/TSX Composite Index.
Forward Looking Statements
This news release contains certain statements which may constitute “forward-looking information” and “forward-looking statements” within the meaning of Canadian securities law requirements (collectively, “forward-looking statements”). These forward-looking statements are made as of the date of this news release and the Company does not intend, and does not assume any obligation, to update these forward-looking statements, except as required under applicable securities legislation. Forward-looking statements relate to future events or future performance and reflect Company management’s expectations or beliefs regarding future events. In certain cases, forward-looking statements can be identified by the use of words such as “plans”, “expects” or “does not expect”, “is expected”, “budget”, “scheduled”, “estimates”, “forecasts”, “intends”, “anticipates” or “does not anticipate”, or “believes”, or variations of such words and phrases or statements that certain actions, events or results “may”, “could”, “would”, “might” or “will be taken”, “occur” or “be achieved” or the negative of these terms or comparable terminology. In this document, certain forward-looking statements are identified by words including “may”, “future”, “expected”, “intends” and “estimates”. By their very nature forward-looking statements involve known and unknown risks, uncertainties and other factors which may cause the actual results, performance or achievements of the Company to be materially different from any future results, performance or achievements expressed or implied by the forward-looking statements. The Company provides no assurance that forward-looking statements will prove to be accurate, as actual results and future events could differ materially from those anticipated in such statements. Accordingly, readers should not place undue reliance on forward-looking statements. Forward-looking statements in this news release include, but are not limited to, statements with respect to: :
- pro forma measures including revenue, Adjusted gross margin before fair value adjustments, expected SG&A run-rates, and grams produced;
- the Company’s ability to execute on its business transformation plan and path to Adjusted EBITDA profitability;
- planned cost efficiencies, including the execution of the Company’s costs savings plan, including, but not limited to, asset consolidation, supply chain efficiency and other reductions in SG&A expenses;
- the recovery of the Company’s domestic adult recreational segment;
- growth opportunities, including the expansion into additional international adult recreational markets;
- the continued supply of product to Israel and associated revenue growth;
- product portfolio enhancements and innovation;
- future strategic plans and growth, including, but not limited to, M&A in the United States ;
- expectations regarding production capacity, costs and yields; and
- product sales expectations and corresponding forecasted increases in revenues.
The above and other aspects of the Company’s anticipated future operations are forward-looking in nature and, as a result, are subject to certain risks and uncertainties. Although the Company believes that the expectations reflected in these forward-looking statements are reasonable, undue reliance should not be placed on them as actual results may differ materially from the forward-looking statements. Such forward-looking statements are estimates reflecting the Company’s best judgment based upon current information and involve a number of risks and uncertainties, and there can be no assurance that other factors will not affect the accuracy of such forward-looking statements. These risks include, but are not limited to, the ability to retain key personnel, the ability to continue investing in infrastructure to support growth, the ability to obtain financing on acceptable terms, the continued quality of our products, customer experience and retention, the development of third party government and non-government consumer sales channels, management’s estimates of consumer demand in Canada and in jurisdictions where the Company exports, expectations of future results and expenses, the availability of additional capital to complete construction projects and facilities improvements, the risk of successful integration of acquired business and operations, management’s estimation that SG&A will grow only in proportion of revenue growth, the ability to expand and maintain distribution capabilities, the impact of competition, the general impact of financial market conditions, the yield from cannabis growing operations, product demand, changes in prices of required commodities, competition, and the possibility for changes in laws, rules, and regulations in the industry, epidemics, pandemics or other public health crises, including the current outbreak of COVID-19,and other risks as set out under “Risk Factors” contained herein. Readers are urged to consider the risks, uncertainties and assumptions carefully in evaluating the forward-looking statements and are cautioned not to place undue reliance on such information. The Company is under no obligation, and expressly disclaims any intention or obligation, to update or revise any forward-looking statements, whether as a result of new information, future events or otherwise, except as expressly required by applicable securities law.
Should one or more of these risks or uncertainties materialize, or should underlying factors or assumptions prove incorrect, actual results may vary materially from those described in forward looking statements. Material factors or assumptions involved in developing forward-looking statements include, without limitation, publicly available information from governmental sources as well as from market research and industry analysis and on assumptions based on data and knowledge of this industry which the Company believes to be reasonable.
Although the Company believes that the expectations conveyed by the forward-looking statements are reasonable based on the information available to the Company on the date hereof, no assurance can be given as to future results, approvals or achievements. Forward-looking statements contained in this news release and in the documents incorporated by reference herein are expressly qualified by this cautionary statement. The Company disclaims any duty to update any of the forward-looking statements after the date of this news release except as otherwise required by applicable law.
Non-GAAP Measures
This news release contains certain financial performance measures that are not recognized or defined under IFRS (termed “Non-GAAP Measures”). As a result, this data may not be comparable to data presented by other licensed producers of cannabis and cannabis companies. For an explanation of these measures to related comparable financial information presented in the consolidated financial statements prepared in accordance with IFRS, refer to the discussion below. The Company believes that these Non-GAAP Measures are useful indicators of operating performance and are specifically used by management to assess the financial and operational performance of the Company. These Non-GAAP Measures include, but are not limited, to the following:
- Cannabis net revenue represents revenue from the sale of cannabis products, excluding excise taxes. Cannabis net revenue is further broken down as follows:
- Medical cannabis net revenue represents Canadian and international cannabis net revenue for medical cannabis sales only.
- Consumer cannabis net revenue represents cannabis net revenue for consumer cannabis sales only.
- Wholesale bulk cannabis net revenue represents cannabis net revenue for wholesale bulk cannabis only.
- Ancillary net revenue represents non-cannabis net revenue for ancillary support functions only
Management believes the cannabis net revenue measures provide more specific information about the net revenue purely generated from our core cannabis business and by market type.
- Average net selling price per gram and gram equivalent is calculated by taking cannabis net revenue and removing the impact of cost of sales net against revenue in agency relationships, which is then divided by total grams and grams equivalent of cannabis sold in the period. Average net selling price per gram and gram equivalent is further broken down as follows:
- Average net selling price per gram of dried cannabis represents the average net selling price per gram for dried cannabis sales only, excluding wholesale bulk cannabis sold in the period.
- Average net selling price per gram of international dried cannabis represents the average net selling price per gram for international dried cannabis sales only, excluding wholesale bulk cannabis sold in the period.
- Average net selling price per gram and gram equivalent of Canadian medical cannabis represents the average net selling price per gram and gram equivalent for dried cannabis and cannabis derivatives sold in the Canadian medical market.
- Average net selling price per gram and gram equivalent of medical cannabis represents the average net selling price per gram and gram equivalent for dried cannabis and cannabis derivatives sold in the medical market.
- Average net selling price per gram and gram equivalent of consumer cannabis represents the average net selling price per gram and gram equivalent for dried cannabis and cannabis derivatives sold in the consumer market
Management believes the average net selling price per gram or gram equivalent measures provide more specific information about the pricing trends over time by product and market type. Under an agency relationship, revenue is recognized net of cost of sales in accordance with IFRS. Management believes the removal of agency cost of sales in determining the average net selling price per gram and gram equivalent is more reflective of our average net selling price generated in the marketplace.
- Gross profit before FV adjustments on cannabis net revenue is calculated by subtracting (i) cost of sales, before the effects of changes in FV of biological assets and inventory, and (ii) cost of sales from non-cannabis ancillary support functions, from total cannabis net revenue. Gross margin before FV adjustments on cannabis net revenue is calculated by dividing gross profit before FV adjustments on cannabis net revenue divided by cannabis net revenue. Management believes that these measures provide useful information to assess the profitability of our cannabis operations as it excludes the effects of non-cash FV adjustments on inventory and biological assets, which are required by IFRS.
- Adjusted gross profit before FV adjustments on cannabis net revenue represents cash gross profit and gross margin on cannabis net revenue and is calculated by subtracting from total cannabis net revenue (i) cost of sales, before the effects of changes in FV of biological assets and inventory; (ii) cost of sales from non-cannabis ancillary support functions; and removing (iii) depreciation in cost of sales; (iv) cannabis inventory impairment; and (v) out-of-period adjustments. Adjusted gross margin before FV adjustments on cannabis net revenue is calculated by dividing Adjusted gross profit before FV adjustments on cannabis net revenue divided by cannabis net revenue. Adjusted gross profit and gross margin before FV adjustments on cannabis net revenue is further broken down as follows:
- Adjusted gross profit and gross margin before FV adjustments on medical cannabis net revenue represents gross profit and gross margin before FV adjustments on sales generated in the medical market only.
- Adjusted gross profit and gross margin before FV adjustments on consumer cannabis net revenue represents gross profit and gross margin before FV adjustments on sales generated in the consumer market only.
- Adjusted gross profit and gross margin before FV adjustments on wholesale bulk cannabis net revenue represents gross profit and gross margin before FV adjustments on sales generated from wholesale bulk cannabis only.
- Adjusted gross profit and gross margin before FV adjustments on ancillary net revenue represents gross profit and gross margin before FV adjustments on sales generated from ancillary support functions onl
Management believes that these measures provide useful information to assess the profitability of our cannabis operations as it represents the cash gross profit and margin generated from cannabis operations and excludes (i) out-of-period adjustments to provide information that reflects current period results; and (ii) excludes the effects of non-cash FV adjustments on inventory and biological assets, which are required by IFRS.
- Adjusted EBITDA is calculated as net income (loss) excluding interest income (expense), accretion, income taxes, depreciation, amortization, changes in fair value of inventory sold, changes in fair value of biological assets, share-based compensation, acquisition costs, foreign exchange, share of income (losses) from investment in associates, government grant income, fair value gains and losses on financial instruments, gains and losses on deemed disposal, losses on disposal of assets, restructuring charges, onerous contract provisions, out-of-period adjustments, and non-cash impairments of deposits, property, plant and equipment, equity investments, intangibles, goodwill, and other assets. Adjusted EBITDA is intended to provide a proxy for the Company’s operating cash flow and is widely used by industry analysts to compare Aurora to its competitors, and derive expectations of future financial performance for Aurora, and excludes out-of-period adjustments that are not reflective of current operating results. Adjusted EBITDA increases comparability between comparative companies by eliminating variability resulting from differences in capital structures, management decisions related to resource allocation, and the impact of FV adjustments on biological assets and inventory and financial instruments, which may be volatile and fluctuate significantly from period to period.
Non-GAAP measures should be considered together with other data prepared accordance with IFRS to enable investors to evaluate the Company’s operating results, underlying performance and prospects in a manner similar to Aurora’s management. Accordingly, these non-GAAP measures are intended to provide additional information and should not be considered in isolation or as a substitute for measures of performance prepared in accordance with IFRS.
Reconciliation of Non-GAAP Measures
Net Revenue
|
Three months ended |
June 30, 2021 |
June 30, 2020 (1) |
March 31, 2021 |
|
|
Medical cannabis net revenue |
35,022 |
32,226 |
36,378 |
|
|
Consumer cannabis net revenue |
19,514 |
35,266 |
18,023 |
|
|
Wholesale bulk cannabis net revenue |
289 |
– |
760 |
|
|
Total cannabis net revenue |
54,825 |
67,492 |
55,161 |
|
|
Total net revenue |
54,825 |
68,426 |
55,161 |
|
|
(1) |
As a result of the Company’s dissolution and divestment of its wholly owned subsidiaries Hempco, ALPS and AHE, the operations of Hempco, ALPS and AHE have been presented as discontinued operations and the Company’s results have been retroactively restated, as required. Refer to Note 12(b) of the Financial Statements for information about the divestitures. |
Adjusted Gross Margin
|
($ thousands) |
Medical |
Consumer |
Wholesale Bulk Cannabis |
Ancillary |
Total |
||||||||||
|
Three months ended June 30, 2021 |
|||||||||||||||
|
Gross revenue |
38,076 |
26,037 |
289 |
— |
64,402 |
||||||||||
|
Excise taxes |
(3,054) |
(6,523) |
— |
— |
(9,577) |
||||||||||
|
Out-of-period revenue adjustments (4) |
— |
908 |
— |
— |
908 |
||||||||||
|
Net revenue |
35,022 |
20,422 |
289 |
— |
55,733 |
||||||||||
|
Cost of sales |
(17,558) |
(19,726) |
(331) |
— |
(37,615) |
||||||||||
|
Gross profit (loss) before FV adjustments (1) |
17,464 |
696 |
(42) |
— |
18,118 |
||||||||||
|
Depreciation |
5,245 |
3,587 |
40 |
— |
8,872 |
||||||||||
|
Inventory impairment and out-of-period adjustments in |
1,028 |
2,017 |
— |
— |
3,045 |
||||||||||
|
Adjusted gross profit (loss) before FV adjustments (1) |
23,737 |
6,300 |
(2) |
— |
30,035 |
||||||||||
|
Adjusted gross margin before FV adjustments (1) |
68 |
% |
31 |
% |
(1) |
% |
— |
% |
54 |
% |
|||||
|
Three months ended June 30, 2020 (2)(3) |
|||||||||||||||
|
Gross revenue |
35,494 |
48,299 |
— |
934 |
84,727 |
||||||||||
|
Excise taxes |
(3,268) |
(13,033) |
— |
— |
(16,301) |
||||||||||
|
Net revenue |
32,226 |
35,266 |
— |
934 |
68,426 |
||||||||||
|
Cost of sales |
(34,215) |
(98,262) |
— |
(2,910) |
(135,387) |
||||||||||
|
Gross loss before FV adjustments (1) |
(1,989) |
(62,996) |
— |
(1,976) |
(66,961) |
||||||||||
|
Depreciation |
3,283 |
4,468 |
— |
— |
7,751 |
||||||||||
|
Inventory impairment in cost of sales |
19,248 |
71,331 |
— |
1,177 |
91,756 |
||||||||||
|
Adjusted gross profit (loss) before FV adjustments (1) |
20,542 |
12,803 |
— |
(799) |
32,546 |
||||||||||
|
Adjusted gross margin before FV adjustments (1) |
64 |
% |
36 |
% |
— |
% |
(86) |
% |
48 |
% |
|||||
|
Three months ended March 31, 2021 (2)(3) |
|||||||||||||||
|
Gross revenue |
39,457 |
23,828 |
760 |
— |
64,045 |
||||||||||
|
Excise taxes |
(3,079) |
(5,805) |
— |
— |
(8,884) |
||||||||||
|
Net revenue |
36,378 |
18,023 |
760 |
— |
55,161 |
||||||||||
|
Cost of sales |
(50,672) |
(71,332) |
(1,708) |
— |
(123,712) |
||||||||||
|
Gross loss before FV adjustments (1) |
(14,294) |
(53,309) |
(948) |
— |
(68,551) |
||||||||||
|
Depreciation |
4,107 |
5,781 |
138 |
— |
10,026 |
||||||||||
|
Inventory impairment in cost of sales |
29,466 |
53,446 |
— |
— |
82,912 |
||||||||||
|
Adjusted gross profit (loss) before FV adjustments (1) |
19,279 |
5,918 |
(810) |
— |
24,387 |
||||||||||
|
Adjusted gross margin before FV adjustments (1) |
53 |
% |
33 |
% |
(107) |
% |
— |
% |
44 |
% |
|||||
|
(1) |
These terms are defined in the “Cautionary Statement Regarding Certain Non-GAAP Performance Measures” of the MD&A. |
|
(2) |
Amounts have been retroactively recast for the biological assets and inventory non-material prior period error. Refer to the ” Significant Accounting Policies and Judgments ” section in Note 2(h) of the Financial Statements. |
|
(3) |
As a result of the Company’s dissolution and divestment of its wholly owned subsidiaries Hempco, ALPS and AHE, the operations of Hempco, ALPS and AHE have been presented as discontinued operations and the Company’s results have been retroactively restated, as required. Refer to Note 12(b) of the Financial Statements for information about the divestitures. |
|
(4) |
Included in out-of-period adjustments is a $5.5 million Q4 2021 cost of sales adjustment related to a catch-up of prior year raw material count reconciliations and a $0.9 million out-of-period revenue adjustment to reclassify prior period rebates against net revenue. |
Adjusted EBITDA
|
($ thousands) |
Three months ended |
Year ended |
|||||||||
|
June 30, 2021 |
March 31, 2021 (1)(2) |
June 30, 2020 (1)(2) |
June 30, 2021 |
June 30, 2020 (1)(2) |
|||||||
|
Net (loss) income from continuing operations |
(133,969) |
(160.625) |
(1,843,978) |
(693,477) |
(3,257,499) |
||||||
|
Finance costs |
15,973 |
16,990 |
28,369 |
66,437 |
76,115 |
||||||
|
Interest (income) expense |
(1,295) |
(1,467) |
627 |
(5,745) |
(5,913) |
||||||
|
Income tax expense (recovery) |
(9,970) |
(129) |
(61,436) |
(6,321) |
(82,235) |
||||||
|
Depreciation and amortization |
22,956 |
17,206 |
22,321 |
87,276 |
95,444 |
||||||
|
EBITDA |
(106,305) |
(128,025) |
(1,854,097) |
(551,830) |
(3,174,088) |
||||||
|
Changes in fair value of inventory sold |
20,111 |
50,368 |
60,131 |
118,707 |
149,099 |
||||||
|
Unrealized gain on changes in fair value of |
(15,546) |
(37,483) |
(37,732) |
(109,178) |
(125,448) |
||||||
|
Share-based compensation |
2,162 |
5,233 |
6,021 |
20,243 |
59,176 |
||||||
|
Acquisition costs |
4,657 |
— |
2,170 |
5,761 |
6,493 |
||||||
|
Foreign exchange loss (gain) |
3,248 |
7,035 |
(3,003) |
3,383 |
13,141 |
||||||
|
Share of loss from investment in associates |
10 |
9 |
2,601 |
509 |
11,534 |
||||||
|
Government grant income |
(4,119) |
(4,692) |
— |
(32,489) |
— |
||||||
|
Losses (gains) on financial instruments (3) |
(12,640) |
(2,566) |
(3,265) |
9,469 |
27,148 |
||||||
|
Loss on loss of control of subsidiary |
— |
— |
— |
— |
(500) |
||||||
|
Losses (gains) on deemed disposal of |
— |
(204) |
(11,955) |
1,239 |
(11,955) |
||||||
|
Gains (losses) on disposal of assets held for |
(9,685) |
(1,595) |
— |
(11,119) |
— |
||||||
|
Restructuring charges |
— |
801 |
1,947 |
1,011 |
1,947 |
||||||
|
Onerous contract provision |
— |
— |
— |
2,000 |
— |
||||||
|
Out-of-period adjustments (4) |
66 |
(194) |
— |
1,325 |
— |
||||||
|
Impairment of deposit, inventory, investment in |
98,785 |
87,460 |
1,803,833 |
426,844 |
2,854,873 |
||||||
|
Adjusted EBITDA (5) |
(19,256) |
(23,853) |
(33,349) |
(114,125) |
(188,580) |
||||||
|
(1) |
Amounts have been retroactively recast for the biological assets and inventory non-material prior period error. Refer to the ” Significant Accounting Policies and Judgments ” section in Note 2(h) of the Financial Statements. |
|
(2) |
As a result of the Company’s dissolution and divestment of its wholly owned subsidiaries Hempco, ALPS and AHE, the operations of Hempco, ALPS and AHE have been presented as discontinued operations and the Company’s results have been retroactively restated, as required. Refer to Note 12(b) of the Financial Statements for information about the divestitures. Including the results of Hempco, AHE, and ALPS, Adjusted EBITDA loss would have been $19.5 million and $115.4 million for the three and twelve months ended June 30, 2021, respectively, and $36.5 million and $205.2 million for the three and twelve months ended June 30, 2020, respectively. |
|
(3) |
Includes fair value changes on derivative investments, derivative liabilities, contingent consideration, loss on induced conversion of debentures, and (gain) loss on the modification and settlement of debt. Refer to Note 22 of the Financial Statements. |
|
(4) |
Included in out-of-period adjustments in Q4 2021 is (i) a $5.5 million cost of sales adjustment related to a catch-up of prior year raw material count reconciliations, (ii) a $0.9 million out-of-period 2021 revenue adjustment to reclassify prior period rebates against net revenue; offset by (iii) a $6.4 million other gain relating to prior periods identified through our period end reconciliations (year ended June 30, 2021 – $5.5 million raw materials cost of sales adjustment; offset by a $4.2 million other gain relating to prior periods identified through our period end reconciliations). |
|
(5) |
Adjusted EBITDA is a non-GAAP financial measure and is not a recognized, defined, or standardized measure under IFRS. Refer to ” Cautionary Statement Regarding Certain Non-GAAP Performance Measures ” section of the MD&A. |
Included in the Q4 2021 Adjusted EBITDA loss is $5.1 million (Q3 2021 – $3.2 million ; Q4 2020 – $1.0 million ) related to restructuring charges, severance and benefits associated with the business transformation plan, $nil (Q3 2021 – $2.2 million ; Q4 2020 – $0.8 million ) legal settlement and contract termination fees, and $0.3 million (Q3 2021 – $1.9 million ; Q4 2020 – nil) in revenue provisions as a result of our Company initiated product swap to replace low quality product with higher potency product at the provinces. Excluding these impacts, Adjusted EBITDA loss is $13.9 million (Q3 2021 – $16.5 million ; Q4 2020 – $31.5 million ).
View original content to download multimedia: https://www.prnewswire.com/news-releases/aurora-cannabis-announces-fiscal-2021-fourth-quarter-results-301385769.html
SOURCE Aurora Cannabis Inc.

News Provided by PR Newswire via QuoteMedia

Cannabis Market Could Reach $5.5B By End Of Year
Experts Weigh In On Our Exclusive FREE Report. Can You Afford To Miss Out?
International
A popular vacation destination is about to get much more expensive
The entry fee to this destination known for its fauna has been unchanged since 1998.
Share this:


When visiting certain islands and other remote parts of the world, travelers need to be prepared to pay more than just the plane ticket and accommodation costs.
Particularly for smaller places grappling with overtourism, local governments will often introduce "tourist taxes" to go toward things like reversing ecological degradation and keeping popular attractions clean and safe.
Related: A popular European city is introducing the highest 'tourist tax' yet
Located 900 kilometers off the coast of Ecuador and often associated with the many species of giant turtles who call it home, the Galápagos Islands are not easy to get to (visitors from the U.S. often pass through Quito and then get on a charter flight to the islands) but are often a dream destination for those interested in seeing rare animal species in an unspoiled environment.
Shutterstock
This is how much you'll have to pay to visit the Galápagos Islands
While local authorities have been charging a $100 USD entry fee for all visitors to the islands since 1998, Ecuador's Ministry of Tourism announced that this number would rise to $200 for adults starting from August 1, 2024.
More Travel:
- A new travel term is taking over the internet (and reaching airlines and hotels)
- The 10 best airline stocks to buy now
- Airlines see a new kind of traveler at the front of the plane
According to the local tourism board, the increase has been prompted by the fact that record numbers of visitors since the pandemic have started taking a toll on the local environment. The islands are home to just 30,000 people but have been seeing nearly 300,000 visitors each year.
"It is our collective responsibility to protect and preserve this unparalleled ecosystem for future generations," Ecuador's Minister of Tourism Niels Olsen said in a statement. "The adjustment in the entry fee, the first in 26 years, is a necessary measure to ensure that tourism in the Galápagos remains sustainable and mutually beneficial to both the environment and our local communities."
These are the other countries which are raising (or adding) their tourist taxes
While the $200 applies to most international adult arrivals, there are some exceptions that can make one eligible for a lower rate. Adult citizens of the countries that make up the South American treaty bloc Mercosur will pay a $100 fee while children from any country will also get a discounted rate that is currently set at $50. Children under the age of two will continue to get free access.
In recent years, multiple countries and destinations have either raised or introduced new taxes for visitors. Thailand recently started charging all international visitors between 150 and 300 baht (up to $9 USD) that are put toward a sustainability budget while the Italian city of Venice is running a test in which it charges those coming into the city during the most popular summer weekends five euros.
Places such as Bali, the Maldives and New Zealand have been charging international arrivals a fee for years while Iceland's Prime Minister Katrín Jakobsdóttir hinted at plans to introduce something similar at the United Nations Climate Ambition Summit in 2023.
"Tourism has really grown exponentially in Iceland in the last decade and that obviously is not just creating effects on the climate," Jakobsdóttir told a Bloomberg reporter. "Most of our guests visit our unspoiled nature and obviously that creates a pressure."
stocks pandemic europeanInternational
Merck’s six-year deal strategy could deliver a blockbuster if hypertension drug is OK’d this month
With an FDA decision expected next week for its blood pressure drug sotatercept, Merck is hoping that its bundle of acquisitions in recent years will lead…
Share this:


With an FDA decision expected next week for its blood pressure drug sotatercept, Merck is hoping that its bundle of acquisitions in recent years will lead to multiple approvals and late-stage clinical wins.
The regulator is set to decide whether to approve the pulmonary arterial hypertension drug known as sotatercept by March 26. If approved, the drug could generate $1.9 billion in sales in 2025, according to Leerink Partners analyst Daina Graybosch.
The subcutaneous treatment came to Merck by way of its $11.5 billion acquisition of Acceleron in 2021.
“We viewed [Acceleron] as a great Merck-type company to own, especially with their legacy of R&D,” Sunil Patel, Merck’s head of corporate development and business development & licensing, said in an interview.
For the past few years, the pharma giant has been amassing help from external biotechs to broaden its pipeline and prepare for the looming patent deadline for Keytruda, the cancer immunotherapy that had $25 billion in sales last year. It’s Merck’s most notable treatment to come from external innovation; Organon made the drug, known then as pembrolizumab, and was bought by Schering-Plough, which merged with Merck in 2009.
Now, Merck is once again hoping a drug that it bet billions of dollars on will lead a spate of approvals out of its promising late-stage pipeline. The company has put at least $50 billion toward business development since 2018. Aside from Covid-19 treatment Lagevrio, which was authorized in late 2021 and developed with Ridgeback Biotherapeutics, Merck’s dealmaking over the past few years has not produced another blockbuster medicine.
In three months, Merck could have another approval in patritumab deruxtecan, an antibody-drug conjugate it’s developing with Daiichi Sankyo, in certain forms of non-small cell lung cancer. The FDA set a decision date of June 26. As part of the $4 billion upfront deal, Merck is co-developing and co-commercializing three antibody-drug conjugates with the ADC powerhouse.
Merck also expects a late-stage race with Roche in the inflammatory market, stemming from its $10.8 billion acquisition of Prometheus Biosciences last year. It began a Phase III of Prometheus’ lead drug, now called tulisokibart or MK-7240, in ulcerative colitis last fall. Meanwhile, the company also bagged a Phase I/II cancer drug via its more relatively modest $680 million acquisition of Harpoon Therapeutics earlier this year.
The acquisitions are likely to keep coming. Merck CEO Rob Davis said earlier this year the pharma is willing to spend as much as $15 billion on M&A.
It’s made more than 20 biotech acquisitions in the past 10 years, and that has led to at least 17 compounds that have been approved or are in mid- and late-stage development, Patel said.

“This current management team is deeply rooted in the legacy of this company. They understand the importance of building a long-term sustainable future, and they’re just not afraid to make the bold scientific bets,” he said.
Last year, Merck adjusted the way it calculates R&D spending to factor in M&A and licensing costs, and doing so catapulted the company to the top of Endpoints News’ 2023 pharma R&D expenditure list.
But not all deals have been smooth. Merck discontinued a Covid-19 treatment candidate from its 2020 acquisition of OncoImmune. And a chronic cough drug that it gained through its 2016 acquisition of Afferent Pharmaceuticals has twice been rejected by the FDA. The drug has been approved in Europe, Switzerland and Japan.
All told, Merck inks about 80 to 100 business development transactions per year, Patel said. That includes licensing pacts and early-stage collaborations, like a $1 billion biobuck-loaded deal for new biologics with Pearl Bio that it announced last week.
“Once we get through the science, we act decisively and very rapidly to bring the right type of BD structure,” said Patel, who’s been at Merck Research Laboratories for 25 years.
 Dean Li
About 80 employees search and evaluate potential transactions, which are then presented to a committee led by Dean Li, president of Merck Research Laboratories. Li joined Merck in 2017 from the University of Utah Health, where he co-founded biotechs such as Recursion and Hydra Biosciences.
“It’s seamless between Merck Research Labs and the BD unit. We’re just one simple group that operates with the one pipeline mentality,” Patel said.
About 60% of the Acceleron team remains at Merck.
“That’s a testament to how we can integrate these teams and how we embrace the science that we’re acquiring,” he said.
treatment fda covid-19 japan europeInternational
Key Events This Week: Central Banks Galore Including A Historic Rate Hike By The BOJ
Key Events This Week: Central Banks Galore Including A Historic Rate Hike By The BOJ
According to DB’s Jim Reid, "this could be a landmark…
Share this:

According to DB's Jim Reid, "this could be a landmark week in markets as the last global holdout on negative rates looks set to be removed as the BoJ likely hikes rates from -0.1% tomorrow." That will likely overshadow the FOMC that concludes on Wednesday that will have its own signalling intrigue given recent strong inflation. We also have the RBA meeting tomorrow and the SNB and BoE meetings on Thursday to close out a big week for global central bankers with many EM countries also deciding on policy. We’ll preview the main meetings in more depth below but outside of this we have the global flash PMIs on Thursday as well as inflation reports in Japan (Thursday) and the UK (Wednesday). US housing data also permeates through the week as you'll see in the full global day-by-day week ahead at the end as usual.
Let’s go into detail now, starting with the BoJ tomorrow. We’ve had negative base rates now for 8 years which if is the longest run ever seen for any country in the history of mankind. In fact it is doubtful that pre-historic man was as generous as to charge negative interest rates on lending money prior to this! It also might be one of the longest global runs without any interest rate hikes given the 17 year run that could end tomorrow. So, as Reid puts it, a landmark event.
DB's Chief Japan economist expects the central bank to revise its policy and abandon both NIRP and the multi-tiered current account structure and set rates on all excess reserves at 0.1%. He also sees both the yield curve control (YCC) and the inflation-overshooting commitment ending, replaced by a benchmark for the pace of the bank’s JGB purchasing activity. The house view forecast of 50bps of hikes through 2025 is more hawkish than the market but risks are still tilted to the upside. On Friday, the Japan Trade Union Confederation (Rengo) announced the first tally of the results of this year's shunto spring wage negotiation. The wage increase rate, including the seniority-based wage hike, is 5.28%, which was significantly higher than expected. This year will probably see the highest wage settlements since 1991 which given Japan’s recent history is an incredible turnaround. This wage data news has firmed up expectations for tomorrow.
With regards to the FOMC which concludes on Wednesday, DB economists expect only minor revisions to the meeting statement that saw an overhaul last meeting. With regards to the SEP, the growth and unemployment forecasts are unlikely to change but the 2024 inflation forecasts potentially could; elsewhere, expect the Fed to revise up their 2024 core PCE inflation forecast by a tenth to 2.5%, although they see meaningful risks that it gets revised up even higher to 2.6%. In our economists' view, a 2.5% core PCE reading would allow just enough wiggle room to keep the 2024 fed funds rate at 4.6% (75bps of cuts). However, if core PCE inflation were revised up to 2.6%, it would likely entail the Fed moving their base case back to 50bps of cuts, as this would essentially reflect the same forecasts as the September 2023 SEP.
Beyond 2024, DB expect officials to build in less policy easing due to a higher r-star. If two of the eight officials currently at 2.5% move up by 25bps, then the long-run median forecast would edge up to 2.6%. This could be justified by a one-tenth upgrade to the long-run growth forecast. After all this information is released the presser from Powell will of course be heavily scrutinised, especially on how Powell sees recent inflation data. Powell should also provide an update on discussions around QT but it is unlikely they are ready yet to release updated guidance.
One additional global highlight this week might be a big fall in UK inflation on Wednesday, suggesting that headline CPI will slow to 3.4% (vs 4% in January) and core to 4.5% (5.1%). Elsewhere there is plenty of ECB speaker appearances including President Lagarde on Wednesday. They are all highlighted in the day-by-day guide at the end.
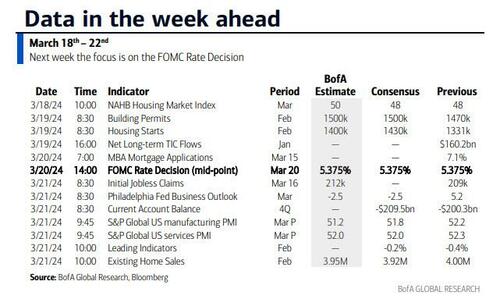
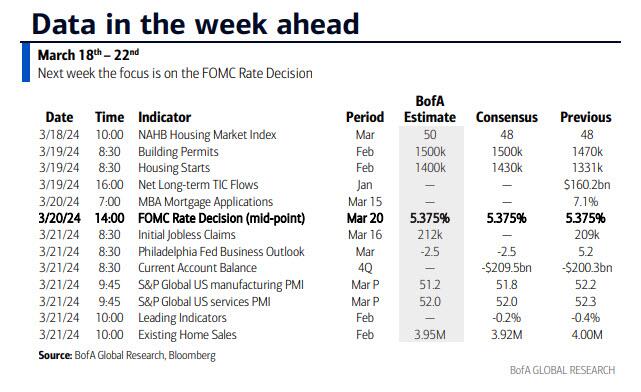
Courtesy of DB, here is a day-by-day calendar of events
Monday March 18
- Data: US March New York Fed services business activity, NAHB housing market index, China February retail sales, industrial production, property investment, Eurozone January trade balance, Canada February raw materials, industrial product price index, existing home sales
Tuesday March 19
- Data: US January total net TIC flows, February housing starts, building permits, Japan January capacity utilization, Germany and Eurozone March Zew survey, Eurozone Q4 labour costs, Canada February CPI
- Central banks: BoJ decision, ECB's Guindos speaks, RBA decision
- Auctions: US 20-yr Bond ($13bn, reopening)
Wednesday March 20
- Data: UK February CPI, PPI, RPI, January house price index, China 1-yr and 5-yr loan prime rates, Japan February trade balance, Italy January industrial production, Germany February PPI, Eurozone March consumer confidence, January construction output
- Central banks: Fed's decision, ECB's Lagarde, Lane, De Cos, Schnabel, Nagel and Holzmann speak, BoC summary of deliberations
- Earnings: Tencent, Micron
Thursday March 21
- Data: US, UK, Japan, Germany, France and Eurozone March PMIs, US March Philadelphia Fed business outlook, February leading index, existing home sales, Q4 current account balance, initial jobless claims, UK February public finances, Japan February national CPI, Italy January current account balance, France March manufacturing confidence, February retail sales, ECB January current account, EU27 February new car registrations
- Central banks: BoE decision, SNB decision
- Earnings: Nike, FedEx, Lululemon, BMW, Enel
- Auctions: US 10-yr TIPS ($16bn, reopening)
- Other: European Union summit, through March 22
Friday March 22
- Data: UK March GfK consumer confidence, February retail sales, Germany March Ifo survey, January import price index, Canada January retail sales
* * *
Finally, looking at just the US, Goldman notes that the key economic data releases this week are the Philadelphia Fed manufacturing index and existing home sales reports on Thursday. The March FOMC meeting is on Wednesday. The post-meeting statement will be released at 2:00 PM ET, followed by Chair Powell’s press conference at 2:30 PM. There are several speaking engagements from Fed officials this week, including Chair Powell, Vice Chair for Supervision Barr, and President Bostic.
Monday, March 18
- There are no major economic data releases scheduled.
Tuesday, March 19
- 08:30 AM Housing starts, February (GS +9.4%, consensus +7.4%, last -14.8%); Building permits, February (consensus +2.0%, last -0.3%)
Wednesday, March 20
- 02:00 PM FOMC statement, March 19 – March 20 meeting: As discussed in our FOMC preview, we continue to expect the committee to target a first cut in June, but we now expect 3 cuts in 2024 in June, September, and December (vs. 4 previously) given the slightly higher inflation path. We continue to expect 4 cuts in 2025 and now expect 1 final cut in 2026 to an unchanged terminal rate forecast of 3.25-3.5%. The main risk to our expectation is that FOMC participants might be more concerned about the recent inflation data and less convinced that inflation will resume its earlier soft trend. In that case, they might bump up their 2024 core PCE inflation forecast to 2.5% and show a 2-cut median.
Thursday, March 21
- 08:30 AM Current account balance, Q4 (consensus -$209.5bn, last -$200.3bn)
- 08:30 AM Philadelphia Fed manufacturing index, March (GS 3.2, consensus -1.3, last 5.2): We estimate that the Philadelphia Fed manufacturing index fell 2pt to 3.2 in March. While the measure is elevated relative to other surveys, we expect a boost from the rebound in foreign manufacturing activity and the pickup in US production and freight activity.
- 08:30 AM Initial jobless claims, week ended March 16 (GS 210k, consensus 215k, last 209k): Continuing jobless claims, week ended March 9 (consensus 1,815k, last 1,811k)
- 09:45 AM S&P Global US manufacturing PMI, March preliminary (consensus 51.8, last 52.2): S&P Global US services PMI, March preliminary (consensus 52.0, last 52.3)
- 10:00 AM Existing home sales, February (GS +1.2%, consensus -1.6%, last +3.1%)
- 02:00 PM Federal Reserve Vice Chair for Supervision Barr speaks: Federal Reserve Vice Chair Michael for Supervision Barr will participate in a fireside chat in Ann Arbor, MI with students and faculty. A moderated Q&A is expected. On February 14, Barr said the Fed is “confident we are on a path to 2% inflation,” but the recent report showing prices rose faster than anticipated in January “is a reminder that the path back to 2% inflation may be a bumpy one.” Barr also noted that “we need to see continued good data before we can begin the process of reducing the federal funds rate.”
Friday, March 22
- 09:00 AM Fed Reserve Chair Powell speaks: The Federal Reserve Board will host a Fed Listens event in Washington D.C. on “Transitioning to the Post-Pandemic Economy.” Chair Powell will deliver opening remarks. Vice Chair Phillip Jefferson and Fed Governor Michelle Bowman will moderate conversations with leaders from various organizations. On March 6, Chair Powell noted in his congressional testimony that if the economy evolves broadly as expected, it will likely be appropriate to begin dialing back policy restraint at some point this year.
- 12:00 PM Federal Reserve Vice Chair for Supervision Barr speaks: Federal Reserve Vice Chair for Supervision Michael Barr will participate in a virtual event on “International Economic and Monetary Design.” A moderated Q&A is expected.
- 04:00 PM Atlanta Fed President Bostic (FOMC voter) speaks: Atlanta Fed President Raphael Bostic will participate in a moderated conversation at the 2024 Household Finance Conference in Atlanta. On March 4, Bostic said, “I need to see more progress to feel fully confident that inflation is on a sure path to averaging 2% over time.” Bostic also noted, “I expect the first interest rate cut, which I have penciled in for the third quarter, will be followed by a pause in the following meeting.”
Source: DB, Goldman, BofA


Mistakes Were Made


Home buyers must now navigate higher mortgage rates and prices


“Extreme Events”: US Cancer Deaths Spiked In 2021 And 2022 In “Large Excess Over Trend”


Harvard Medical School Professor Was Fired Over Not Getting COVID Vaccine


Germany Is Running Out Of Money And Debt Levels Are Exploding, Finance Minister Warns


TikTok Ban Obscures Chinese Stock Gold Rush


You can strike gold and silver investment opportunities at Costco


AI vs. elections: 4 essential reads about the threat of high-tech deception in politics


Free school meals for all may reduce childhood obesity, while easing financial and logistical burdens for families and schools


Supreme Court To Hear Arguments In Biden Admin’s Censorship Of Social Media Posts
-

 Uncategorized4 weeks ago
All Of The Elements Are In Place For An Economic Crisis Of Staggering Proportions
-

 Spread & Containment5 days ago
IFM’s Hat Trick and Reflections On Option-To-Buy M&A
-

 International1 week ago
EyePoint poaches medical chief from Apellis; Sandoz CFO, longtime BioNTech exec to retire
-

 Uncategorized1 month ago
California Counties Could Be Forced To Pay $300 Million To Cover COVID-Era Program
-

 Uncategorized3 weeks ago
Apparel Retailer Express Moving Toward Bankruptcy
-

 Uncategorized1 month ago
Industrial Production Decreased 0.1% in January
-

 International1 week ago
Walmart launches clever answer to Target’s new membership program
-

 Uncategorized1 month ago
RFK Jr: The Wuhan Cover-Up & The Rise Of The Biowarfare-Industrial Complex