Uncategorized
Apple’s Magic – Are Buybacks Worth Paying Up For?
Apple’s Magic – Are Buybacks Worth Paying Up For?
Authored by Michael Lebowitz via RealInvestmentAdvice.com,
Apple’s valuations are near…
Share this:

Authored by Michael Lebowitz via RealInvestmentAdvice.com,
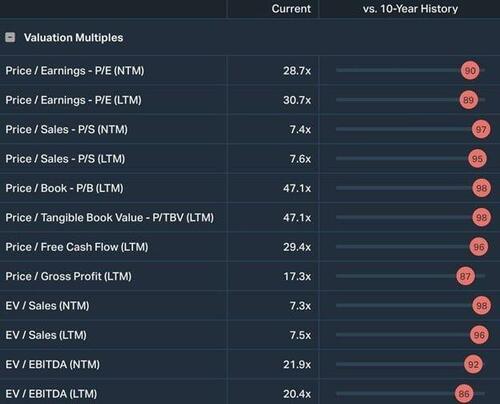
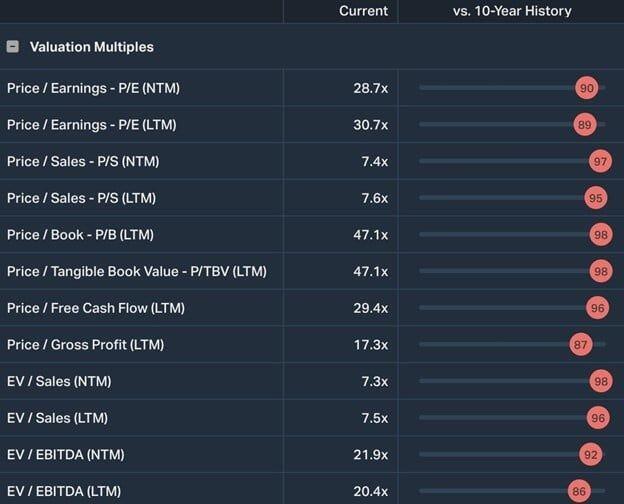
Apple’s valuations are near their most expensive levels of the last ten years. Now consider that today’s valuation premiums are amidst a much higher risk-free bond yield than during most of the previous ten years.
Apple has a market cap of $2.8 trillion. Assuming its price-to-earnings ratio and margins remain stable, Apple must sell nearly $400 billion of products and services each year to keep its share price stable. To fathom that, consider that every man, woman, and child on planet Earth must spend about $45 on Apple products yearly.
The point of sharing those statistics and the valuation premium is to contextualize whether Apple can grow at the growth rate implied by its investors. Further, if its earnings growth alone doesn’t support a valuation premium to the market’s valuation, can the continued use of stock buybacks support the premium?
Apple’s Track Record
The graph below shows Apple shares have provided its investors with a fantastic 20% annualized growth rate for the last 39 years. That is more than double the 8.7% growth rate for the S&P 500 over the same period.
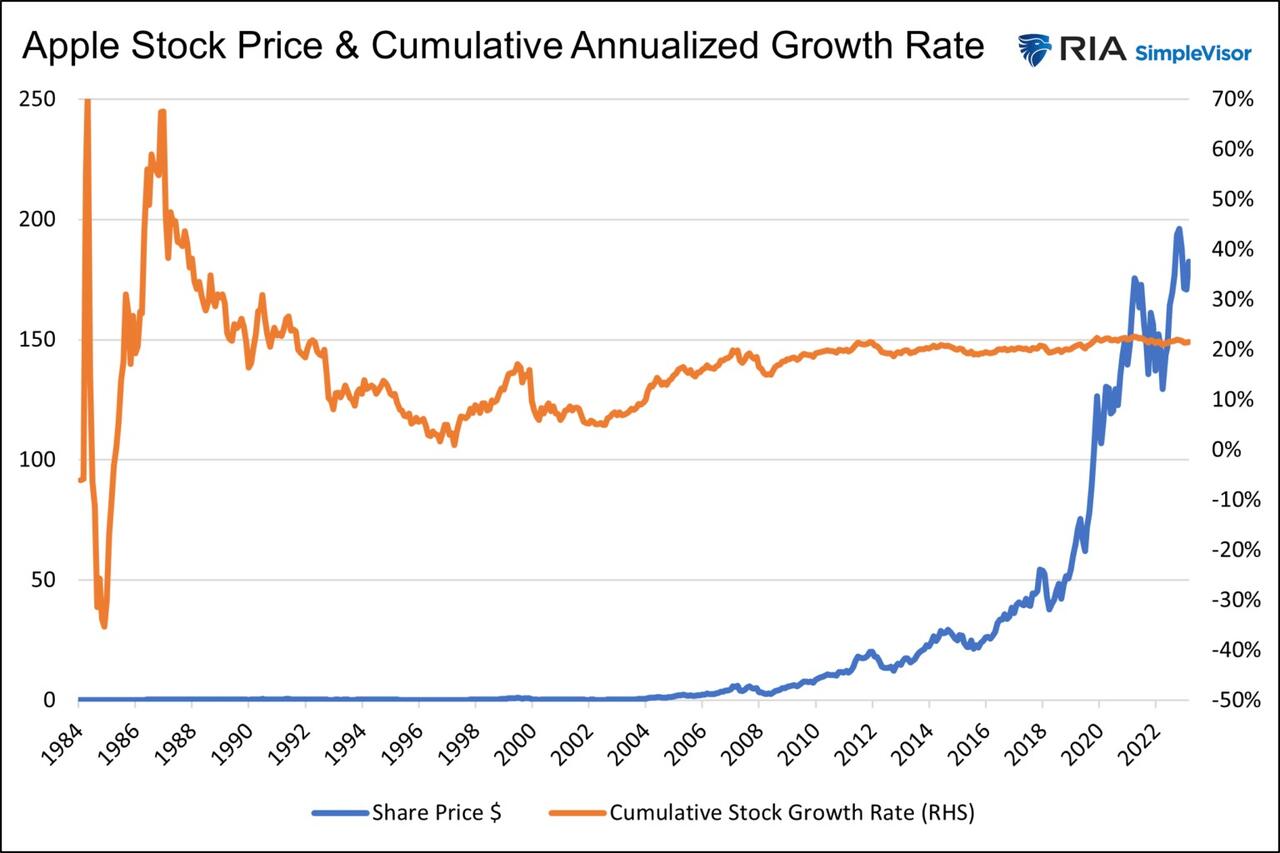
Its exceptional outperformance versus the market is warranted. Since 1993, Apple’s earnings per share have grown at over 3x the rate of the S&P 500.
Apple’s Recent Trends
While Apple may have an incredible record of earnings growth and share price appreciation, current investors must avoid the temptation to rest on prior trends. Instead, their focus should be on what may lie ahead.
The following graph shows the running 3-year annualized growth rates for sales, net earnings, and earnings per share. Recent growth rates are much lower than they have been. We truncated the graph to the last ten years to better highlight the more recent trends.
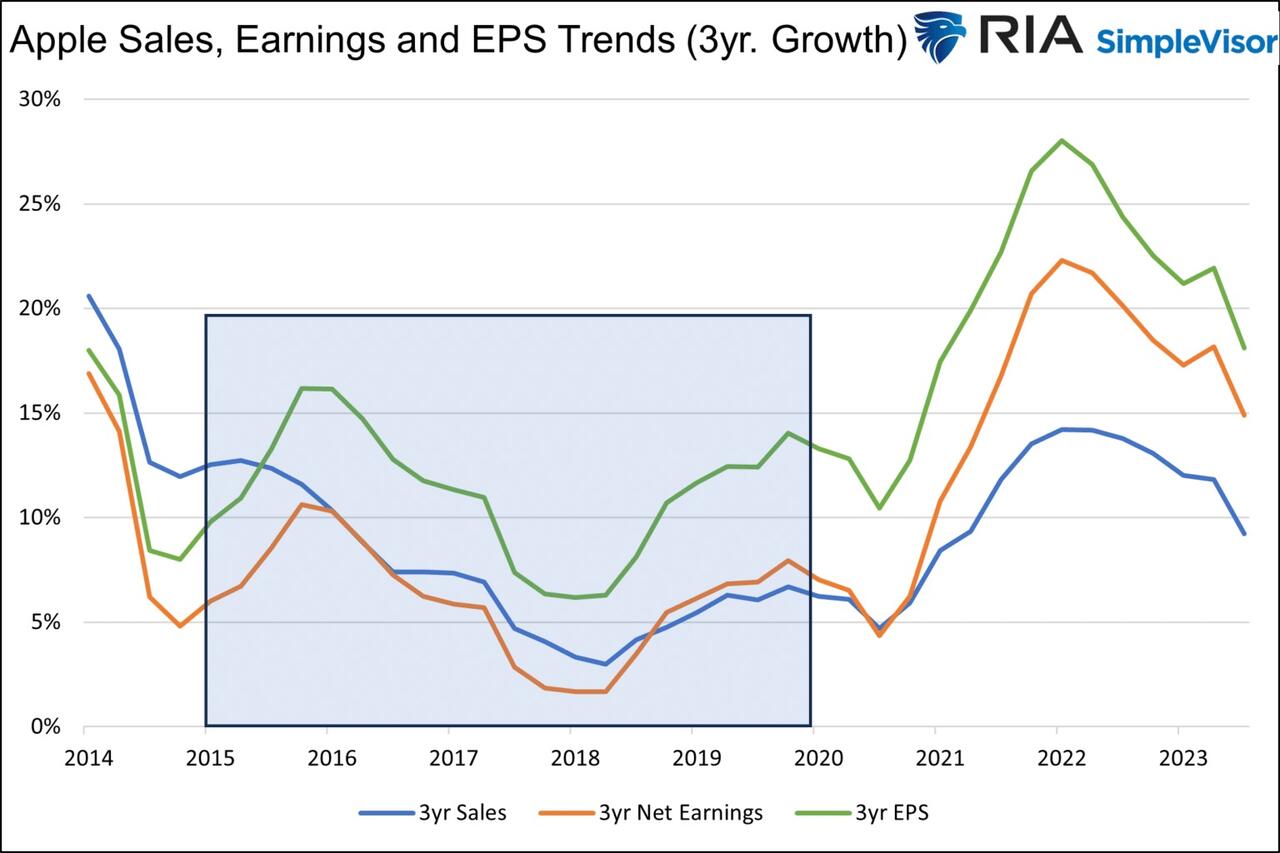
Earnings and sales were boosted in 2021 and 2022 by the stimulus-related spending and inflation caused by the massive pandemic-related fiscal stimulus. Many companies, including Apple, saw demand increase and could expand profit margins, as inflation was easy to pass on to customers.
However, Apple’s earnings and sales growth are returning to pre-pandemic levels. To better appreciate what the future may hold, consider the five pre-pandemic years highlighted in blue. During that period, sales grew by 4.2% annually. Net earnings grew by 4.3% and EPS by 10.4%
The Magic of Stock Buybacks
The price of a stock is not meaningful. Apple stock trades for $182 a share. Its market cap is roughly $2.85 trillion. If the company repurchased all but one share, its market cap would be unchanged, but its share price would be $2.85 trillion.
That simple example highlights how valuable buying back shares can be for investors.
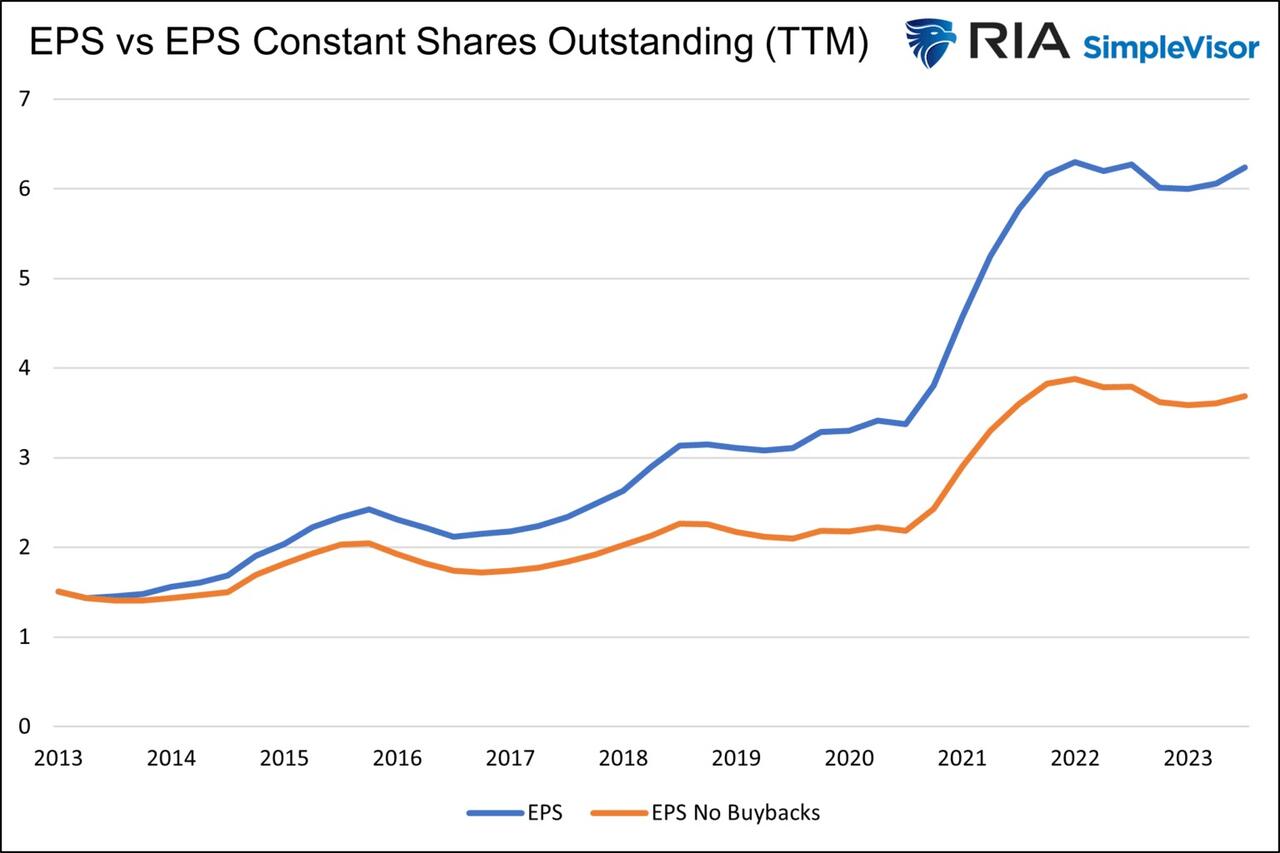
Back to Apple’s recent EPS, net earnings and sales trends. Its EPS grew roughly double that of sales or net earnings. The graph below helps explain how they pulled off such a feat. Once Apple started buying back shares in late 2013, its EPS grew 4-6% more than its actual earnings.
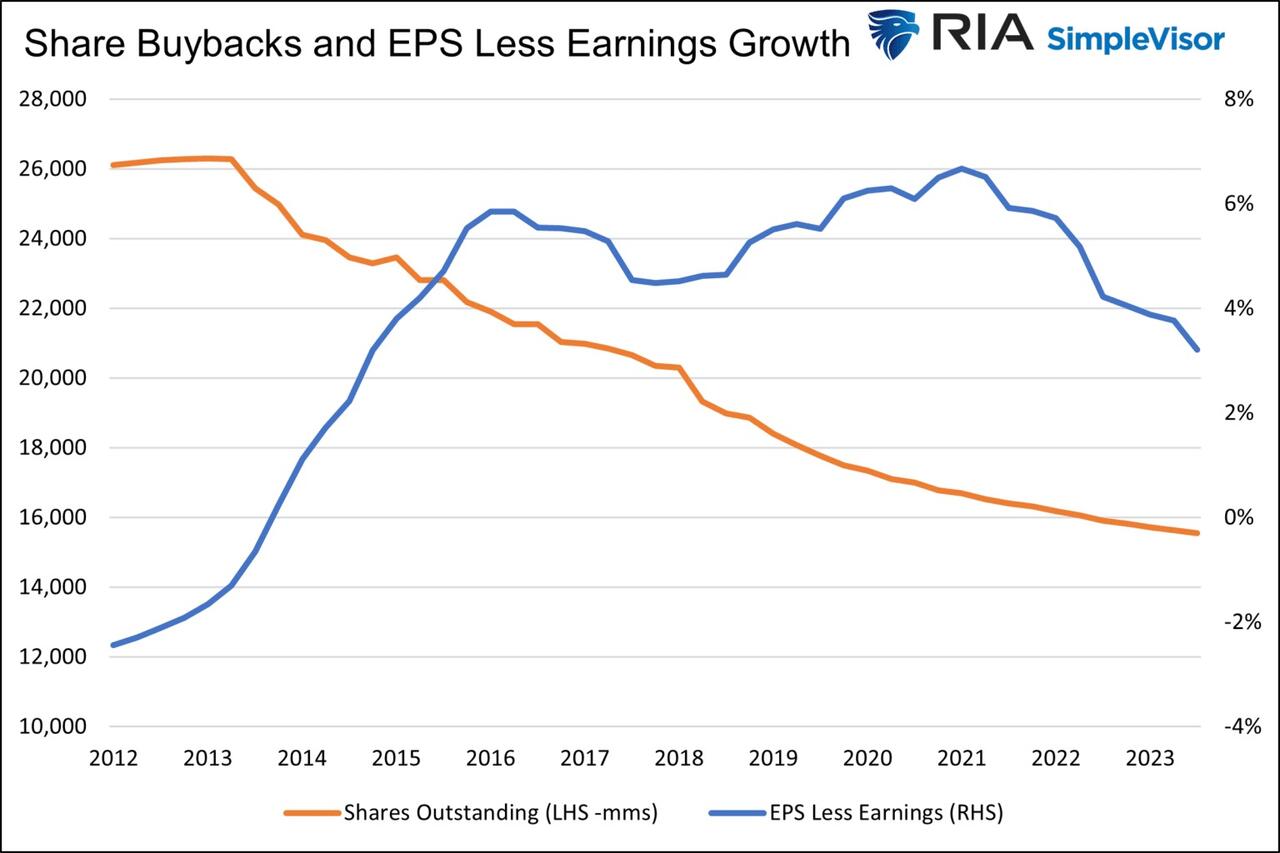
The following graph compares Apple’s annual EPS versus its EPS if it had not repurchased shares. The graph starts in 2013 when Apple began to aggressively buy back shares.
Why The Premium Versus The Market?
Apple has recently grown its earnings and sales at an approximate 5% growth rate. This is only about 1% higher than the approximate 4% nominal GDP growth from 2017 to 2019. But less than the approximate 9% EPS and sales per share growth of the S&P 500.
So why are Apple investors willing to pay a premium for subpar growth?
Apple is an incredibly successful and innovative company with a long history of rewarding investors. Investors are willing to pay for the future potential of new products and services with enormous income potential. Such investor goodwill is hard to put a price on.
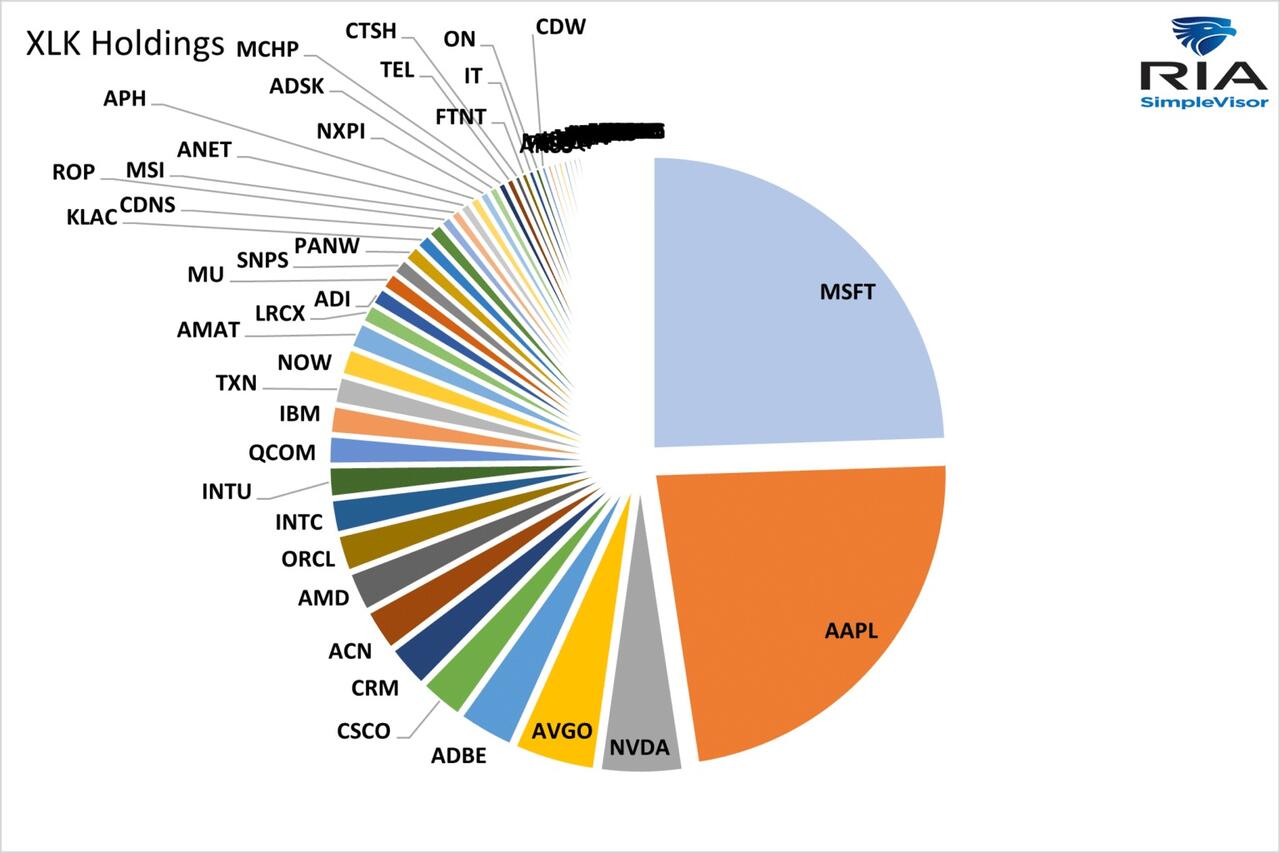
Passive investment strategies are a second reason. Apple and Microsoft are the two largest stocks by market cap. The increased popularity of passive investment strategies feeds the most extensive market cap stocks disproportionately to smaller companies.
Consider the holdings of XLK, the $52 billion tech sector ETF. Apple and Microsoft make up almost 50% of the ETF. If an investor buys $1,000 of XLK, approximately $500 will go to Apple and Microsoft, and the remaining 62 companies will get the rest.
Finally, and most importantly, are share buybacks. While we can’t quantify what future innovation, goodwill, and passive investment strategies are worth, we can grasp Apple’s ability to continue forward with buybacks.
Future Buyback Funding
The chart below shows Apple has been spending between $60 and $80 billion per year on stock buybacks. Keep that figure in mind as we walk through its sources of cash to continue buying back shares.
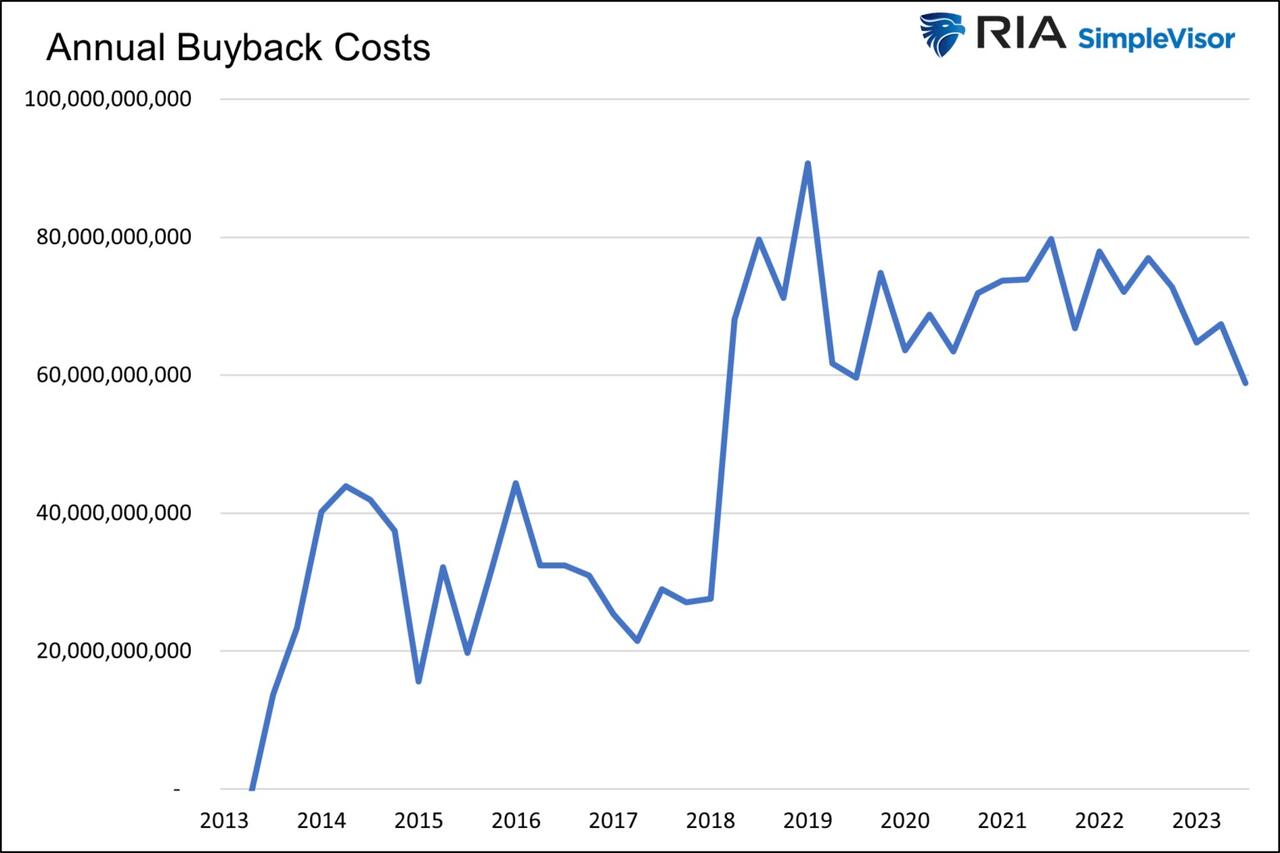
Debt, cash, and earnings are their predominant sources to fund buybacks.
Debt Funded Buybacks
Apple came to market with its first long-term debt offering in 2013, commensurate with its initiation of share buybacks. Apple’s debt peaked eight years later at $109 billion. Using debt to fund share buybacks made sense, with borrowing rates in the very low single digits. However, the calculus has changed, with rates now at 4% and higher.
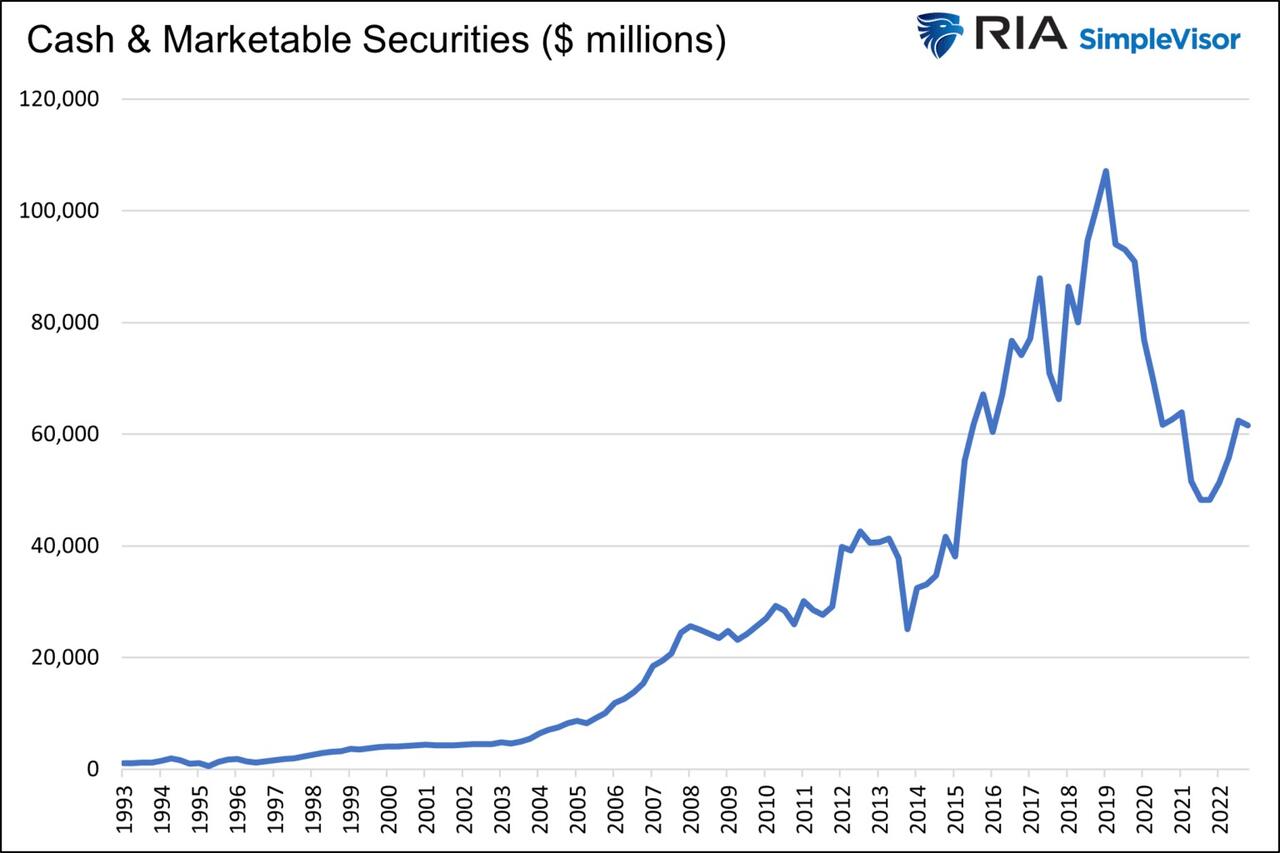
Cash and Marketable Securities on Apple’s balance sheet are at $61.5 billion, about a year’s worth of buyback potential. While a massive amount of money, it is off its peak of $107 billion.
Lastly are earnings. Apple has been earning about $100 billion a year since 2021. Even if they regress to pre-pandemic levels ($50-$60 billion), earnings are enough to continue supporting its buyback program. However, if earnings are employed to buy back shares, it comes at the expense of investments toward innovations and product upgrades. Furthermore, Apple pays about $15 billion yearly in dividends, which also requires funding.
The graph below shows that from 2018 to 2020, Apple spent more on buybacks than it made. It was relying on debt and cash to make up the difference.
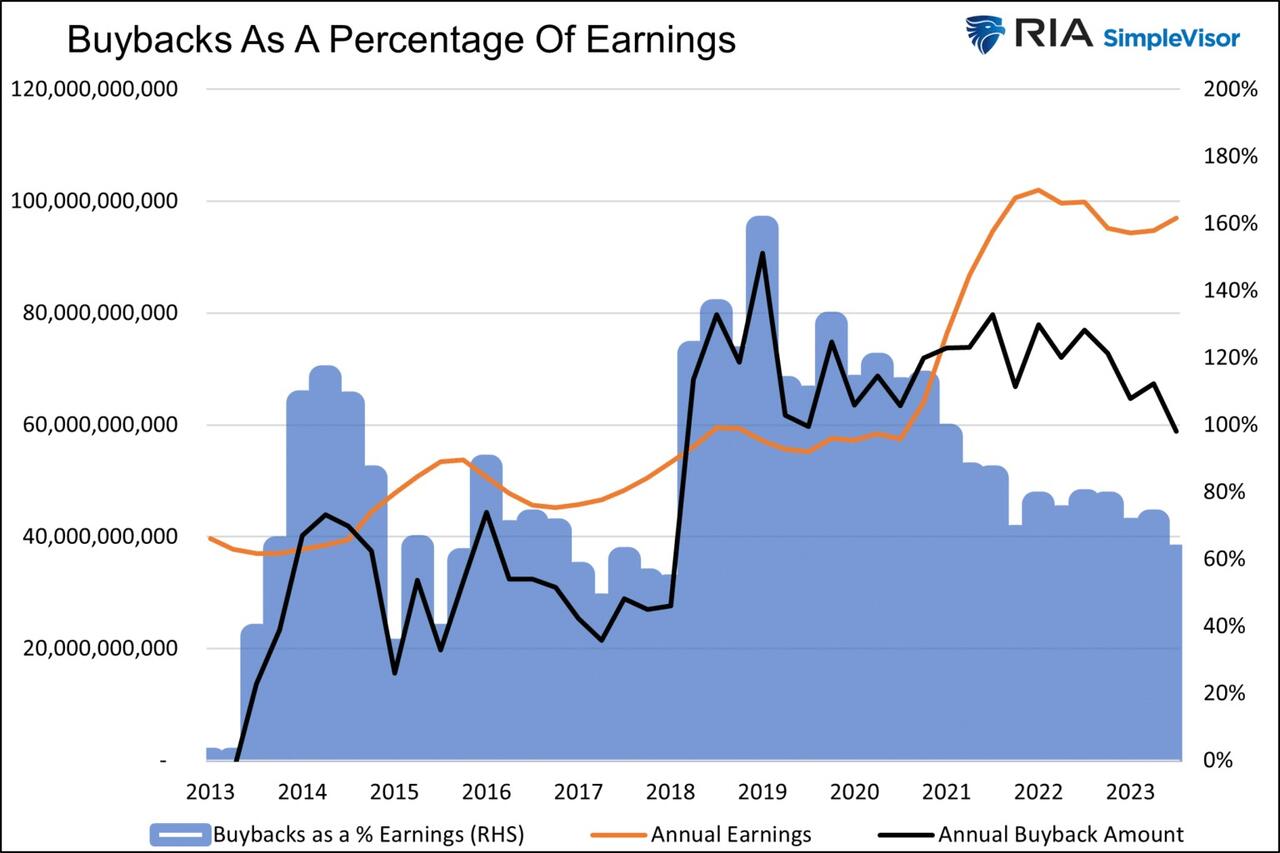
Over the last two years, buybacks only account for 60% of earnings, allowing cash to grow for future buybacks and investments. Hence, if $100 billion a year in earnings is sustainable, even without growth, $60 to $80 billion a year in buybacks is entirely possible. If earnings retreat to their pre-pandemic level, debt and cash will be required. If interest rates stay at their current levels, debt may not be financially sensible.
Summary
Unlike most “growth” companies, a bet on Apple is a bet on their ability to buy back shares. It appears that Apple can continue to buy back its shares with earnings and cash. Such would maintain their higher-than-market EPS growth with or without above-market earnings growth.
Other than negative earnings growth and high-interest rates, a buyback tax on corporations, as is being proposed, could also reduce or eliminate their buyback program. If such a bill were to pass or Apple cuts back on buybacks for another reason, its premium valuation may wither away.
Uncategorized
One city held a mass passport-getting event
A New Orleans congressman organized a way for people to apply for their passports en masse.
Share this:


While the number of Americans who do not have a passport has dropped steadily from more than 80% in 1990 to just over 50% now, a lack of knowledge around passport requirements still keeps a significant portion of the population away from international travel.
Over the four years that passed since the start of covid-19, passport offices have also been dealing with significant backlog due to the high numbers of people who were looking to get a passport post-pandemic.
Related: Here is why it is (still) taking forever to get a passport
To deal with these concurrent issues, the U.S. State Department recently held a mass passport-getting event in the city of New Orleans. Called the "Passport Acceptance Event," the gathering was held at a local auditorium and invited residents of Louisiana’s 2nd Congressional District to complete a passport application on-site with the help of staff and government workers.
'Come apply for your passport, no appointment is required'
"Hey #LA02," Rep. Troy A. Carter Sr. (D-LA), whose office co-hosted the event alongside the city of New Orleans, wrote to his followers on Instagram (META) . "My office is providing passport services at our #PassportAcceptance event. Come apply for your passport, no appointment is required."
More Travel:
- A new travel term is taking over the internet (and reaching airlines and hotels)
- The 10 best airline stocks to buy now
- Airlines see a new kind of traveler at the front of the plane
The event was held on March 14 from 10 a.m. to 1 p.m. While it was designed for those who are already eligible for U.S. citizenship rather than as a way to help non-citizens with immigration questions, it helped those completing the application for the first time fill out forms and make sure they have the photographs and identity documents they need. The passport offices in New Orleans where one would normally have to bring already-completed forms have also been dealing with lines and would require one to book spots weeks in advance.
These are the countries with the highest-ranking passports in 2024
According to Carter Sr.'s communications team, those who submitted their passport application at the event also received expedited processing of two to three weeks (according to the State Department's website, times for regular processing are currently six to eight weeks).
While Carter Sr.'s office has not released the numbers of people who applied for a passport on March 14, photos from the event show that many took advantage of the opportunity to apply for a passport in a group setting and get expedited processing.
Every couple of months, a new ranking agency puts together a list of the most and least powerful passports in the world based on factors such as visa-free travel and opportunities for cross-border business.
In January, global citizenship and financial advisory firm Arton Capital identified United Arab Emirates as having the most powerful passport in 2024. While the United States topped the list of one such ranking in 2014, worsening relations with a number of countries as well as stricter immigration rules even as other countries have taken strides to create opportunities for investors and digital nomads caused the American passport to slip in recent years.
A UAE passport grants holders visa-free or visa-on-arrival access to 180 of the world’s 198 countries (this calculation includes disputed territories such as Kosovo and Western Sahara) while Americans currently have the same access to 151 countries.
stocks pandemic covid-19 grantsUncategorized
Fast-food chain closes restaurants after Chapter 11 bankruptcy
Several major fast-food chains recently have struggled to keep restaurants open.
Share this:


Competition in the fast-food space has been brutal as operators deal with inflation, consumers who are worried about the economy and their jobs and, in recent months, the falling cost of eating at home.
Add in that many fast-food chains took on more debt during the covid pandemic and that labor costs are rising, and you have a perfect storm of problems.
It's a situation where Restaurant Brands International (QSR) has suffered as much as any company.
Related: Wendy's menu drops a fan favorite item, adds something new
Three major Burger King franchise operators filed for bankruptcy in 2023, and the chain saw hundreds of stores close. It also saw multiple Popeyes franchisees move into bankruptcy, with dozens of locations closing.
RBI also stepped in and purchased one of its key franchisees.
"Carrols is the largest Burger King franchisee in the United States today, operating 1,022 Burger King restaurants in 23 states that generated approximately $1.8 billion of system sales during the 12 months ended Sept. 30, 2023," RBI said in a news release. Carrols also owns and operates 60 Popeyes restaurants in six states."
The multichain company made the move after two of its large franchisees, Premier Kings and Meridian, saw multiple locations not purchased when they reached auction after Chapter 11 bankruptcy filings. In that case, RBI bought select locations but allowed others to close.
Image source: Chen Jianli/Xinhua via Getty
Another fast-food chain faces bankruptcy problems
Bojangles may not be as big a name as Burger King or Popeye's, but it's a popular chain with more than 800 restaurants in eight states.
"Bojangles is a Carolina-born restaurant chain specializing in craveable Southern chicken, biscuits and tea made fresh daily from real recipes, and with a friendly smile," the chain says on its website. "Founded in 1977 as a single location in Charlotte, our beloved brand continues to grow nationwide."
Like RBI, Bojangles uses a franchise model, which makes it dependent on the financial health of its operators. The company ultimately saw all its Maryland locations close due to the financial situation of one of its franchisees.
Unlike. RBI, Bojangles is not public — it was taken private by Durational Capital Management LP and Jordan Co. in 2018 — which means the company does not disclose its financial information to the public.
That makes it hard to know whether overall softness for the brand contributed to the chain seeing its five Maryland locations after a Chapter 11 bankruptcy filing.
Bojangles has a messy bankruptcy situation
Even though the locations still appear on the Bojangles website, they have been shuttered since late 2023. The locations were operated by Salim Kakakhail and Yavir Akbar Durranni. The partners operated under a variety of LLCs, including ABS Network, according to local news channel WUSA9.
The station reported that the owners face a state investigation over complaints of wage theft and fraudulent W2s. In November Durranni and ABS Network filed for bankruptcy in New Jersey, WUSA9 reported.
"Not only do former employees say these men owe them money, WUSA9 learned the former owners owe the state, too, and have over $69,000 in back property taxes."
Former employees also say that the restaurant would regularly purchase fried chicken from Popeyes and Safeway when it ran out in their stores, the station reported.
Bojangles sent the station a comment on the situation.
"The franchisee is no longer in the Bojangles system," the company said. "However, it is important to note in your coverage that franchisees are independent business owners who are licensed to operate a brand but have autonomy over many aspects of their business, including hiring employees and payroll responsibilities."
Kakakhail and Durranni did not respond to multiple requests for comment from WUSA9.
bankruptcy pandemicUncategorized
Industrial Production Increased 0.1% in February
From the Fed: Industrial Production and Capacity Utilization
Industrial production edged up 0.1 percent in February after declining 0.5 percent in January. In February, the output of manufacturing rose 0.8 percent and the index for mining climbed 2.2 p…
Share this:


Industrial production edged up 0.1 percent in February after declining 0.5 percent in January. In February, the output of manufacturing rose 0.8 percent and the index for mining climbed 2.2 percent. Both gains partly reflected recoveries from weather-related declines in January. The index for utilities fell 7.5 percent in February because of warmer-than-typical temperatures. At 102.3 percent of its 2017 average, total industrial production in February was 0.2 percent below its year-earlier level. Capacity utilization for the industrial sector remained at 78.3 percent in February, a rate that is 1.3 percentage points below its long-run (1972–2023) average.Click on graph for larger image.
emphasis added
This graph shows Capacity Utilization. This series is up from the record low set in April 2020, and above the level in February 2020 (pre-pandemic).
Capacity utilization at 78.3% is 1.3% below the average from 1972 to 2022. This was below consensus expectations.
Note: y-axis doesn't start at zero to better show the change.
 The second graph shows industrial production since 1967.
Industrial production increased to 102.3. This is above the pre-pandemic level.
Industrial production was above consensus expectations.


Key shipping company files for Chapter 11 bankruptcy


These Cities Have The Highest (And Lowest) Share Of Unaffordable Neighborhoods In 2024


The Question You Should Ask Whenever You’re Wrong


Tight inventory and frustrated buyers challenge agents in Virginia


Walmart and Target make key self-checkout changes to fight theft


Industrial Production Increased 0.1% in February


Your financial plan may be riskier without bitcoin
Key shipping company files Chapter 11 bankruptcy


One city held a mass passport-getting event


Futures Rise To New Record High Ahead Of Data Deluge
-

 Uncategorized3 weeks ago
All Of The Elements Are In Place For An Economic Crisis Of Staggering Proportions
-

 International1 week ago
EyePoint poaches medical chief from Apellis; Sandoz CFO, longtime BioNTech exec to retire
-

 Uncategorized4 weeks ago
California Counties Could Be Forced To Pay $300 Million To Cover COVID-Era Program
-

 Uncategorized3 weeks ago
Apparel Retailer Express Moving Toward Bankruptcy
-

 Uncategorized4 weeks ago
Industrial Production Decreased 0.1% in January
-

 International1 week ago
Walmart launches clever answer to Target’s new membership program
-

 Spread & Containment3 days ago
IFM’s Hat Trick and Reflections On Option-To-Buy M&A
-

 Uncategorized4 weeks ago
RFK Jr: The Wuhan Cover-Up & The Rise Of The Biowarfare-Industrial Complex