Uncategorized
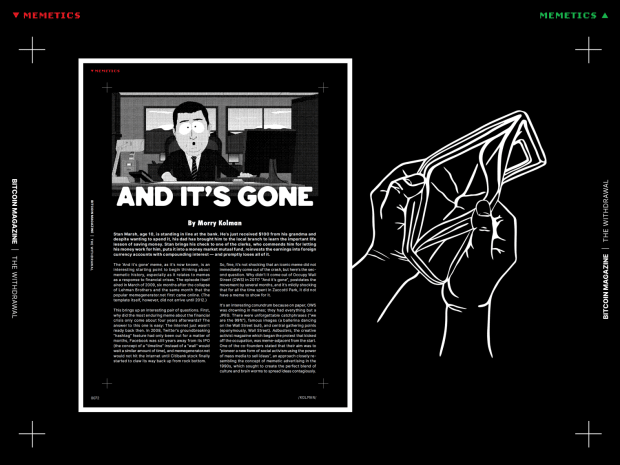
And It’s Gone
The line between politics and poasting has never been more blurry. Unpacking South Park’s “And it’s gone” meme in the context of Occupy Wall Street,…
Share this:

This article is featured in Bitcoin Magazine’s “The Withdrawal Issue”. Click here to subscribe now.
A PDF pamphlet of this article is available for download.
Stan Marsh, age 10, is standing in line at the bank. He’s just received $100 from his grandma and despite wanting to spend it, his dad has brought him to the local branch to learn the important life lesson of saving money. Stan brings his check to one of the clerks, who commends him for letting his money work for him, puts it into a money market mutual fund, reinvests the earnings into foreign currency accounts with compounding interest — and promptly loses all of it.
The “And it’s gone” meme, as it’s now known, is an interesting starting point to begin thinking about memetic history, especially as it relates to memes as a response to financial crises. The episode itself aired in March of 2009, six months after the collapse of Lehman Brothers and the same month that the popular memegenerator.net first came online. (The template itself, however, did not arrive until 2012.)
This brings up an interesting pair of questions. First, why did the most enduring meme about the financial crisis only come about four years afterwards? The answer to this one is easy: The internet just wasn’t ready back then. In 2008, Twitter’s groundbreaking “hashtag” feature had only been out for a matter of months, Facebook was still years away from its IPO (the concept of a “timeline” instead of a “wall” would wait a similar amount of time), and memegenerator.net would not hit the internet until Citibank stock finally started to claw its way back up from rock bottom.
So, fine, it’s not shocking that an iconic meme did not immediately come out of the crash, but here’s the second question. Why didn’t it come out of Occupy Wall Street (OWS) in 2011? “And it’s gone” postdates the movement by several months, and it’s mildly shocking that for all the time spent in Zuccotti Park, it did not have a meme to show for it.
It’s an interesting conundrum because on paper, OWS was drowning in memes; they had everything but a JPEG. There were unforgettable catchphrases (“we are the 99%”), famous images (a ballerina dancing on the Wall Street bull), and central gathering points (eponymously, Wall Street). Adbusters, the creative activist magazine which began the protest that kicked off the occupation, was meme-adjacent from the start. One of the co-founders stated that their aim was to “pioneer a new form of social activism using the power of mass media to sell ideas”, an approach closely resembling the concept of memetic advertising in the 1990s, which sought to create the perfect blend of culture and brain worms to spread ideas contagiously.
OWS also exhibited memetic tendencies in the way it carried its business. The “People’s Mic” is one such example. Denied a permit to use a microphone, the organizers used a unique form of communication that used the protestors to amplify their messaging, rather than a speaker. One person would stand in the middle of a crowd and give their speech broken up into soundbites of a few words at a time, the people closest to them would repeat it louder for those behind them, and so on. If the People’s Mic was a meme-like exercise in repetitive speech, the public services they ran were a performance of committing to the bit. Take the library for example. They set up makeshift shelving structures, developed lending systems, and in the middle of all the mayhem managed to set up a passable operation. Of course, it didn’t work very well — a protest is not an ideal space for a library — but Stephen Duncombe, Professor of Media and Culture at NYU, notes that the OWS library was never intended to function in a traditional manner. A large part of OWS protest tactic was to, in his words, “perform” what they were demanding; in the case of the library, a selfless devotion to the commons. In the case of the people’s mic — similarly plagued by clear logistical issues (like seven-word shouts being a bottleneck on communication) — a decentralized, cooperative public sphere. The world is watching, so if you’re not going to do it for the vine, at least do it for the people at home watching through the TV cameras.
But again, all this — the 99% chants, the spectacles of anarchist community, media attention 24/7, and still no memes…? It would be too far to say that OWS was a failure. Their strategies have left some lasting imagery and continued relevance in the way that similar movements, like the Tea Party, have not. That said, their approach is illustrative of the immaturity surrounding internet communications and viral media strategy in the early 2010s. There was little thought given to how to activate others beyond “come here or start your own there” and no attempt to cohere a message beyond complete inclusion (“we are the 99%, yes you, and you too”). Radical? Yes. Contentless? Also yes. OWS had a lot of virality, and it was all empty.
To be fair, this was only the earliest iteration in what would be a decade defined by the internet realizing itself. The next year, just a month before “And it’s gone” came out, Kony 2012 ripped through the internet becoming the first video to reach 1 million likes on YouTube and bringing about a public discussion on what viral movements meant in the face of lazy “clicktivism”. The next year, the Harlem Shake proved that with sufficient viral momentum, it was easy to get hundreds of people to show up and make an offline event happen for an online trend. As the years went on, the internet only got more and more proof, taught via an endless stream of examples, of just how effective it could be en masse. A British research ship was named Boaty McBoatface and Trump was elected President of the United States in the same year — both after significant online pushes behind their candidacy. Coincidence, or testament to the awakening power of the online swarm?
Fast-forward to 2020, where two men face each other, one of them in tears. Hair high and tight, sporting a black and yellow bowtie, the despondent man lashes out against the other’s choice of monetary policy. “No!” He says, “You can’t artificially inflate the economy by creating money to fight an economic downturn!” His opponent, an old man, stares back silently, hand hovering over a button connected to a large machine. “You can’t just change market signals by using monetary policy”, he continues, increasingly distraught. “You are distorting the natural rate of interest!” The old man takes a sage-like breath and, with all the force of a butterfly’s wing, presses the button. “Haha”, he says calmly, words cloaked in koan as the machine hums to life, green notes shooting around the room, “money printer go brrr”.
This is a more evolved meme, one that is more than just something ripped from a South Park episode; “money printer go brrr” has a number of markers of progress compared to “And it’s gone”. First of all, its characters are two Wojacks, an evolution from and improvement upon, the rage comic figures of old; much more template-like and customizable than having completely different characters for individual emotions. Second, the writing is no longer top-text/bottom-text, a format that at this point dates almost any meme. Since the days of classic meme generators like QuickMeme and the like, there has been an explosion in the breadth of memes, both in styles and all the possible ways to make them. Creators are no longer going to QuickMeme or posting their content on imgur. These days they’re cultured and use apps like Mematic or pirated copies of Photoshop. Lastly, it has an AnCap (anarcho-capitalist) flag as the complainant’s bowtie, insinuating via its popularity that there is enough latent political literacy among posters that they can identify a rather niche political identity and lampoon it and that, in general, there is now a much greater visual vocabulary for memes and politics than a decade ago.
The biggest change, however, might be the non-visual one. This meme did not have to wait three years to get made. “Money printer go brrr” came out in tandem with the growing COVID-19 economic anxiety and developed in tandem with it. No longer was there a near half-decade gap between financial collapse and responding memes. In the decade since OWS, the lag time between memes and politics had shrunk from eras to hours.
For the financial crisis identified in “money printer go brrr”, instead of coming after the resulting organized political rebellion, the memes actually preceded it. By the time the pot boiled over and there was a mass unloading of grievance directed at financial institutions, it almost seemed like the logic of OWS had been inverted; instead of using memetic tactics towards political goals, the main upheaval of the financial turmoil of COVID-19, WallStreetBets (WSB), used political tactics towards its memetic ones — politics, in other words, became a very engaging means of shitposting.

Many would be loath to call WSB mature. After all, the subreddit describes itself as “if 4chan found a Bloomberg terminal”. Nevertheless, its takedown of Citadel and Robinhood by driving the price of GameStop and AMC through the roof shows many improvements upon and remixings of OWS tactics. First, instead of approaching the decentralization of messaging and power as a dynamic of complete unique inclusion (the OWS philosophy that anybody can demand anything), WSB took it as a dynamic of collective responsibility and expression (post however you want, but in service of holding the bag). Second, WSB leveled up the OWS ethos of performing the type of change you want to see in the world by choosing a medium of expression that actually affected their targets. Occupy kneecapped itself as a movement when it took a model from the Arab Spring struggles against state violence to a financial battlefield. While it makes sense to occupy an area as a resistance to a state because a state is defined by its control of an area, it makes no sense to occupy Wall Street because the forces of fractional reserve banking and globalization do not have a physical presence in the same way. They do, however, have economic and technological presence, which the average redditor can interact with via a handy iPhone app. By choreographing stock buys and orchestrating short squeezes, WSB not only gave the world a show of what it looked like when tens of thousands of people agreed to say “screw the hedge funds”, but they did it in a way that was participatory and accessible to anyone who wanted skin in the game. Sure, there was a profit motive when the battle was in their favor, but in the same way that OWS’ library was meant to illustrate a point more than to be a long-term institution, WSB was happy to play chicken with firms as their portfolios dwindled closer and closer to zero just to show they could. In their words, “we can stay retarded longer than you can stay solvent”.
From the delayed response of "And it’s gone" and the internet ineffectuality of Occupy Wall Street to the swift reactions of "money printer go brrr" and the larger-than-life online experience of WallStreetBets, the online swarm has learned to harness its collective power in ways that both entertain and enact change. While Occupy Wall Street may have been a harbinger of this potential, it was ultimately a movement that struggled to find its footing in the digital age. Today, however, we see a new generation of activists and meme lords who have successfully blurred the lines between politics and posting, meaning and memeing. Whether this is for better or worse is a question for the next decade, but at least this one already has the humor down.
This article is featured in Bitcoin Magazine’s “The Withdrawal Issue”. Click here to subscribe now.
A PDF pamphlet of this article is available for download.
This is a guest post by Morry Kolman. Opinions expressed are entirely their own and do not necessarily reflect those of BTC Inc or Bitcoin Magazine.
bitcoin btc covid-19Uncategorized
Homes listed for sale in early June sell for $7,700 more
New Zillow research suggests the spring home shopping season may see a second wave this summer if mortgage rates fall
The post Homes listed for sale in…
Share this:


- A Zillow analysis of 2023 home sales finds homes listed in the first two weeks of June sold for 2.3% more.
- The best time to list a home for sale is a month later than it was in 2019, likely driven by mortgage rates.
- The best time to list can be as early as the second half of February in San Francisco, and as late as the first half of July in New York and Philadelphia.
Spring home sellers looking to maximize their sale price may want to wait it out and list their home for sale in the first half of June. A new Zillow® analysis of 2023 sales found that homes listed in the first two weeks of June sold for 2.3% more, a $7,700 boost on a typical U.S. home.
The best time to list consistently had been early May in the years leading up to the pandemic. The shift to June suggests mortgage rates are strongly influencing demand on top of the usual seasonality that brings buyers to the market in the spring. This home-shopping season is poised to follow a similar pattern as that in 2023, with the potential for a second wave if the Federal Reserve lowers interest rates midyear or later.
The 2.3% sale price premium registered last June followed the first spring in more than 15 years with mortgage rates over 6% on a 30-year fixed-rate loan. The high rates put home buyers on the back foot, and as rates continued upward through May, they were still reassessing and less likely to bid boldly. In June, however, rates pulled back a little from 6.79% to 6.67%, which likely presented an opportunity for determined buyers heading into summer. More buyers understood their market position and could afford to transact, boosting competition and sale prices.
The old logic was that sellers could earn a premium by listing in late spring, when search activity hit its peak. Now, with persistently low inventory, mortgage rate fluctuations make their own seasonality. First-time home buyers who are on the edge of qualifying for a home loan may dip in and out of the market, depending on what’s happening with rates. It is almost certain the Federal Reserve will push back any interest-rate cuts to mid-2024 at the earliest. If mortgage rates follow, that could bring another surge of buyers later this year.
Mortgage rates have been impacting affordability and sale prices since they began rising rapidly two years ago. In 2022, sellers nationwide saw the highest sale premium when they listed their home in late March, right before rates barreled past 5% and continued climbing.
Zillow’s research finds the best time to list can vary widely by metropolitan area. In 2023, it was as early as the second half of February in San Francisco, and as late as the first half of July in New York. Thirty of the top 35 largest metro areas saw for-sale listings command the highest sale prices between May and early July last year.
Zillow also found a wide range in the sale price premiums associated with homes listed during those peak periods. At the hottest time of the year in San Jose, homes sold for 5.5% more, a $88,000 boost on a typical home. Meanwhile, homes in San Antonio sold for 1.9% more during that same time period.
| Metropolitan Area | Best Time to List | Price Premium | Dollar Boost |
| United States | First half of June | 2.3% | $7,700 |
| New York, NY | First half of July | 2.4% | $15,500 |
| Los Angeles, CA | First half of May | 4.1% | $39,300 |
| Chicago, IL | First half of June | 2.8% | $8,800 |
| Dallas, TX | First half of June | 2.5% | $9,200 |
| Houston, TX | Second half of April | 2.0% | $6,200 |
| Washington, DC | Second half of June | 2.2% | $12,700 |
| Philadelphia, PA | First half of July | 2.4% | $8,200 |
| Miami, FL | First half of June | 2.3% | $12,900 |
| Atlanta, GA | Second half of June | 2.3% | $8,700 |
| Boston, MA | Second half of May | 3.5% | $23,600 |
| Phoenix, AZ | First half of June | 3.2% | $14,700 |
| San Francisco, CA | Second half of February | 4.2% | $50,300 |
| Riverside, CA | First half of May | 2.7% | $15,600 |
| Detroit, MI | First half of July | 3.3% | $7,900 |
| Seattle, WA | First half of June | 4.3% | $31,500 |
| Minneapolis, MN | Second half of May | 3.7% | $13,400 |
| San Diego, CA | Second half of April | 3.1% | $29,600 |
| Tampa, FL | Second half of June | 2.1% | $8,000 |
| Denver, CO | Second half of May | 2.9% | $16,900 |
| Baltimore, MD | First half of July | 2.2% | $8,200 |
| St. Louis, MO | First half of June | 2.9% | $7,000 |
| Orlando, FL | First half of June | 2.2% | $8,700 |
| Charlotte, NC | Second half of May | 3.0% | $11,000 |
| San Antonio, TX | First half of June | 1.9% | $5,400 |
| Portland, OR | Second half of April | 2.6% | $14,300 |
| Sacramento, CA | First half of June | 3.2% | $17,900 |
| Pittsburgh, PA | Second half of June | 2.3% | $4,700 |
| Cincinnati, OH | Second half of April | 2.7% | $7,500 |
| Austin, TX | Second half of May | 2.8% | $12,600 |
| Las Vegas, NV | First half of June | 3.4% | $14,600 |
| Kansas City, MO | Second half of May | 2.5% | $7,300 |
| Columbus, OH | Second half of June | 3.3% | $10,400 |
| Indianapolis, IN | First half of July | 3.0% | $8,100 |
| Cleveland, OH | First half of July | 3.4% | $7,400 |
| San Jose, CA | First half of June | 5.5% | $88,400 |
The post Homes listed for sale in early June sell for $7,700 more appeared first on Zillow Research.
federal reserve pandemic home sales mortgage rates interest ratesUncategorized
February Employment Situation
By Paul Gomme and Peter Rupert The establishment data from the BLS showed a 275,000 increase in payroll employment for February, outpacing the 230,000…
Share this:


By Paul Gomme and Peter Rupert
The establishment data from the BLS showed a 275,000 increase in payroll employment for February, outpacing the 230,000 average over the previous 12 months. The payroll data for January and December were revised down by a total of 167,000. The private sector added 223,000 new jobs, the largest gain since May of last year.

Temporary help services employment continues a steep decline after a sharp post-pandemic rise.


Average hours of work increased from 34.2 to 34.3. The increase, along with the 223,000 private employment increase led to a hefty increase in total hours of 5.6% at an annualized rate, also the largest increase since May of last year.

The establishment report, once again, beat “expectations;” the WSJ survey of economists was 198,000. Other than the downward revisions, mentioned above, another bit of negative news was a smallish increase in wage growth, from $34.52 to $34.57.

The household survey shows that the labor force increased 150,000, a drop in employment of 184,000 and an increase in the number of unemployed persons of 334,000. The labor force participation rate held steady at 62.5, the employment to population ratio decreased from 60.2 to 60.1 and the unemployment rate increased from 3.66 to 3.86. Remember that the unemployment rate is the number of unemployed relative to the labor force (the number employed plus the number unemployed). Consequently, the unemployment rate can go up if the number of unemployed rises holding fixed the labor force, or if the labor force shrinks holding the number unemployed unchanged. An increase in the unemployment rate is not necessarily a bad thing: it may reflect a strong labor market drawing “marginally attached” individuals from outside the labor force. Indeed, there was a 96,000 decline in those workers.


Earlier in the week, the BLS announced JOLTS (Job Openings and Labor Turnover Survey) data for January. There isn’t much to report here as the job openings changed little at 8.9 million, the number of hires and total separations were little changed at 5.7 million and 5.3 million, respectively.

As has been the case for the last couple of years, the number of job openings remains higher than the number of unemployed persons.

Also earlier in the week the BLS announced that productivity increased 3.2% in the 4th quarter with output rising 3.5% and hours of work rising 0.3%.

The bottom line is that the labor market continues its surprisingly (to some) strong performance, once again proving stronger than many had expected. This strength makes it difficult to justify any interest rate cuts soon, particularly given the recent inflation spike.
unemployment pandemic unemploymentUncategorized
Mortgage rates fall as labor market normalizes
Jobless claims show an expanding economy. We will only be in a recession once jobless claims exceed 323,000 on a four-week moving average.
Share this:


Everyone was waiting to see if this week’s jobs report would send mortgage rates higher, which is what happened last month. Instead, the 10-year yield had a muted response after the headline number beat estimates, but we have negative job revisions from previous months. The Federal Reserve’s fear of wage growth spiraling out of control hasn’t materialized for over two years now and the unemployment rate ticked up to 3.9%. For now, we can say the labor market isn’t tight anymore, but it’s also not breaking.
The key labor data line in this expansion is the weekly jobless claims report. Jobless claims show an expanding economy that has not lost jobs yet. We will only be in a recession once jobless claims exceed 323,000 on a four-week moving average.
From the Fed: In the week ended March 2, initial claims for unemployment insurance benefits were flat, at 217,000. The four-week moving average declined slightly by 750, to 212,250
Below is an explanation of how we got here with the labor market, which all started during COVID-19.
1. I wrote the COVID-19 recovery model on April 7, 2020, and retired it on Dec. 9, 2020. By that time, the upfront recovery phase was done, and I needed to model out when we would get the jobs lost back.
2. Early in the labor market recovery, when we saw weaker job reports, I doubled and tripled down on my assertion that job openings would get to 10 million in this recovery. Job openings rose as high as to 12 million and are currently over 9 million. Even with the massive miss on a job report in May 2021, I didn’t waver.
Currently, the jobs openings, quit percentage and hires data are below pre-COVID-19 levels, which means the labor market isn’t as tight as it once was, and this is why the employment cost index has been slowing data to move along the quits percentage.

3. I wrote that we should get back all the jobs lost to COVID-19 by September of 2022. At the time this would be a speedy labor market recovery, and it happened on schedule, too
Total employment data
4. This is the key one for right now: If COVID-19 hadn’t happened, we would have between 157 million and 159 million jobs today, which would have been in line with the job growth rate in February 2020. Today, we are at 157,808,000. This is important because job growth should be cooling down now. We are more in line with where the labor market should be when averaging 140K-165K monthly. So for now, the fact that we aren’t trending between 140K-165K means we still have a bit more recovery kick left before we get down to those levels.

From BLS: Total nonfarm payroll employment rose by 275,000 in February, and the unemployment rate increased to 3.9 percent, the U.S. Bureau of Labor Statistics reported today. Job gains occurred in health care, in government, in food services and drinking places, in social assistance, and in transportation and warehousing.
Here are the jobs that were created and lost in the previous month:

In this jobs report, the unemployment rate for education levels looks like this:
- Less than a high school diploma: 6.1%
- High school graduate and no college: 4.2%
- Some college or associate degree: 3.1%
- Bachelor’s degree or higher: 2.2%

Today’s report has continued the trend of the labor data beating my expectations, only because I am looking for the jobs data to slow down to a level of 140K-165K, which hasn’t happened yet. I wouldn’t categorize the labor market as being tight anymore because of the quits ratio and the hires data in the job openings report. This also shows itself in the employment cost index as well. These are key data lines for the Fed and the reason we are going to see three rate cuts this year.
recession unemployment covid-19 fed federal reserve mortgage rates recession recovery unemployment


-

 Uncategorized3 weeks ago
All Of The Elements Are In Place For An Economic Crisis Of Staggering Proportions
-

 Uncategorized1 month ago
Cathie Wood sells a major tech stock (again)
-

 Uncategorized3 weeks ago
California Counties Could Be Forced To Pay $300 Million To Cover COVID-Era Program
-

 Uncategorized2 weeks ago
Apparel Retailer Express Moving Toward Bankruptcy
-

 Uncategorized4 weeks ago
Industrial Production Decreased 0.1% in January
-

 International3 days ago
Walmart launches clever answer to Target’s new membership program
-

 International3 days ago
EyePoint poaches medical chief from Apellis; Sandoz CFO, longtime BioNTech exec to retire
-

 Uncategorized3 weeks ago
RFK Jr: The Wuhan Cover-Up & The Rise Of The Biowarfare-Industrial Complex