2022 Investment Outlook Part 2 – Stocks & Bonds
Stocks are priced for perfection. Bonds trade at historically low yields despite 7% inflation. What could go wrong?
As fiscal and monetary support for the economy and markets wane, valuation extremes are in the crosshairs. While the setup for 2022 is…
Share this:

Stocks are priced for perfection. Bonds trade at historically low yields despite 7% inflation. What could go wrong?
As fiscal and monetary support for the economy and markets wane, valuation extremes are in the crosshairs. While the setup for 2022 is not looking as friendly as 2021, we must realize the environment can change quickly.
For more on the macroeconomic drivers supporting this forecast, please read Part 1 of our 2022 Investment Outlook – Tailwinds Shift To Headwinds.
2022 Investment Outlook for Stocks
Valuations
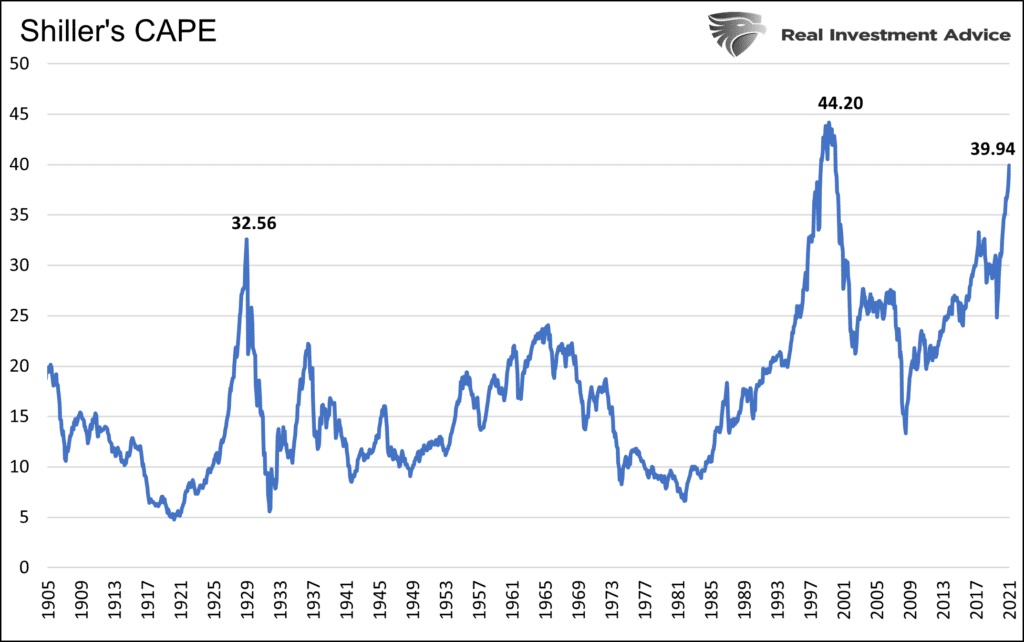
As shown below, as we have highlighted in many articles, valuations are at or near record levels. While nothing limits valuations from rising further, we must consider a reversion to the mean in many cases can result in losses of greater than 40%.

Complicating the valuation story is inflation. The graph below shows that historically periods of low inflation or deflation or inflation running greater than 5% are accompanied by CAPE readings of 25 or less. The current reading is 40.

The graph below uses three popular valuation techniques to quantify longer-term future returns. Based on the data, the ten-year outlook is for low single-digit returns at best. The second graph uses CAPE in a similar fashion to show the 20-year outlook is not much better. While our analysis may seem bearish, we reiterate that nothing says valuations cannot continue to stretch further.


Profit Margins
Corporate profit margins rose to record levels in 2021. Many companies were able to push higher costs onto consumers. At the same time, they were the ultimate beneficiaries of excessive government spending.
As we show below, corporate profits as a percentage of GDP are at the peak of the last decade and well above the 60-year trend leading to the financial crisis. A reversion back to the trend line would result in a 3% decline in profit margins. It is worth considering profit margins tend to revert to and through the trend line. A reversion back to the lows of 2009 and 2002 portends a 50% cut into profit margins. With valuations already at extremes, profit weakness would not support lofty expectations.

The Tail Wagging The Dog- Stock Options
This is where the analysis gets tricky. The graph below from Goldman Sachs shows more volume trading in stock options than the underlying stocks. Options are inherently highly leveraged and volatile. As the amount of options grows versus the shares outstanding, options become the tail wagging the dog.

As we learned over the last two years, dealer hedging of options positions can result in great rallies. Conversely, as we watched in the second half of 2021, the options expiration period was not an investor’s best friend.
Forecasting how options trading might affect stock prices is nearly impossible for a 2022 investment outlook. That said, options have and will continue to influence the market significantly.
One way to track potential volatility is with Gamma flip levels. Gamma helps us understand how dealers hedge options and react by buying or selling the underlying stocks to maintain hedges. SimpleVisor subscribers receive Viking Analytics weekly Gamma Band Update to help them with this task. The graph below from a recent edition shows recommended allocations based on the Gamma of S&P 500 options.

2022 Investment Outlook for Bonds
The outlook for bonds is equally tricky. If you had asked most bond traders a year ago where they thought bond yields would be if inflation approached 7%, most would have said much higher than current levels.
Inflation and Growth Drive Bond Yields
The graph below from Longview Economics show bond yields are abnormally low given the level of inflation. Per the historical relationship between 10-year UST yields and inflation, the 10-year yield should be 4-7%.

To help explain this anomaly, we must consider that bond traders tend to look at inflation beyond a year or two when determining value. Low expected inflation or deflation helps justify negative real yields today. Currently, TIPs markets imply 2.48% inflation for the next ten years. Bond traders must be confident inflation is transitory. If persistently high inflation becomes more likely, bond yields could rise quickly.
Economic growth over the next ten years is likely to be 2% or lower based on productivity and demographic trends. The Fed’s long-range forecast is 1.6-2.2%. The graph below shows the trends for GDP, and yields have been lower for the last 40 years. Note the declining yield trend is steeper than GDP. Some of this is due to the Fed’s influence on rates.

The Fed
As noted in Part 1 of the 2022 Investment outlook, the Fed has been buying nearly 100% of what the Treasury is issuing. To wit- “the Fed has bought nearly $5 trillion of bonds since the pandemic began. In doing so, it came close to absorbing 100% of the net new debt issuance from the government.”
Banks Are Flush With Cash
The graphs below help explain a third important factor keeping yields low. The bottom chart shows deposits at commercial banks are growing much faster than banks are lending money. The banks need to invest deposits, and since they are not lending them out, they frequently invest in U.S. Treasury securities. The upper graph shows the statistically strong correlation (R-squared .76) between the ratio of loans and leases to deposits versus ten-year Treasury yields. Unless the banks are going to start significantly ramping up lending, which we doubt, expect current trends to continue, thus supporting low yields.

Lower Yields
We think inflation is in the process of peaking. Shortages and supply line problems are slowly diminishing. At the same time, demand is normalizing, and there is little fiscal stimulus on the horizon to boost demand further. We offer a big disclaimer. The current environment is anything but typical. While we think inflation will ease, we are mindful that factors, such as rising wages may keep it elevated.
Yields have trended lower for the past 30 years, following economic growth. We think those trends continue in the year ahead.
Some will counter that if the Fed is not buying bonds who will? We do not know, but as we conclude in Taper is Coming: Got Bonds?: “Currently, yields are close to their cycle highs. If we believe the Fed is nearing tapering, yields could be peaking. Based on prior QE taper experiences, a yield decline of 1% or even more may be in store for the next six months to a year if the Fed is, in fact, on the doorsteps of tapering.”
The graph below from the article shows yields tend to fall after periods of QE and when they are reducing their balance sheet (QT) as circled. QT is currently being discussed by Fed members per the two headlines below.
- BOSTIC SAYS FED COULD EASILY PULL $1.5 TRILLION OF “EXCESS LIQUIDITY” FROM FINANCIAL SYSTEM, THEN WATCH MARKET REACTION FOR FURTHER BALANCE SHEET REDUCTIONS
- MESTER: ABLE TO LET BAL SHEET TO RUN DOWN FASTER THAN LAST TIME

An ISM Reading That May Make You Rethink Your Stock/Bond Allocations
In a recent daily Commentary we wrote the following. This quick note provides another reason yields may fall in the coming months.
The ISM Manufacturing Index was below expectations at 58.7, an 11-month low. Notably, the prices paid index fell sharply from 82.4 to 68.2, and supplier delivery times fell to a four-month low. The data provide signals that inflationary pressures are fading, at least for the time being.
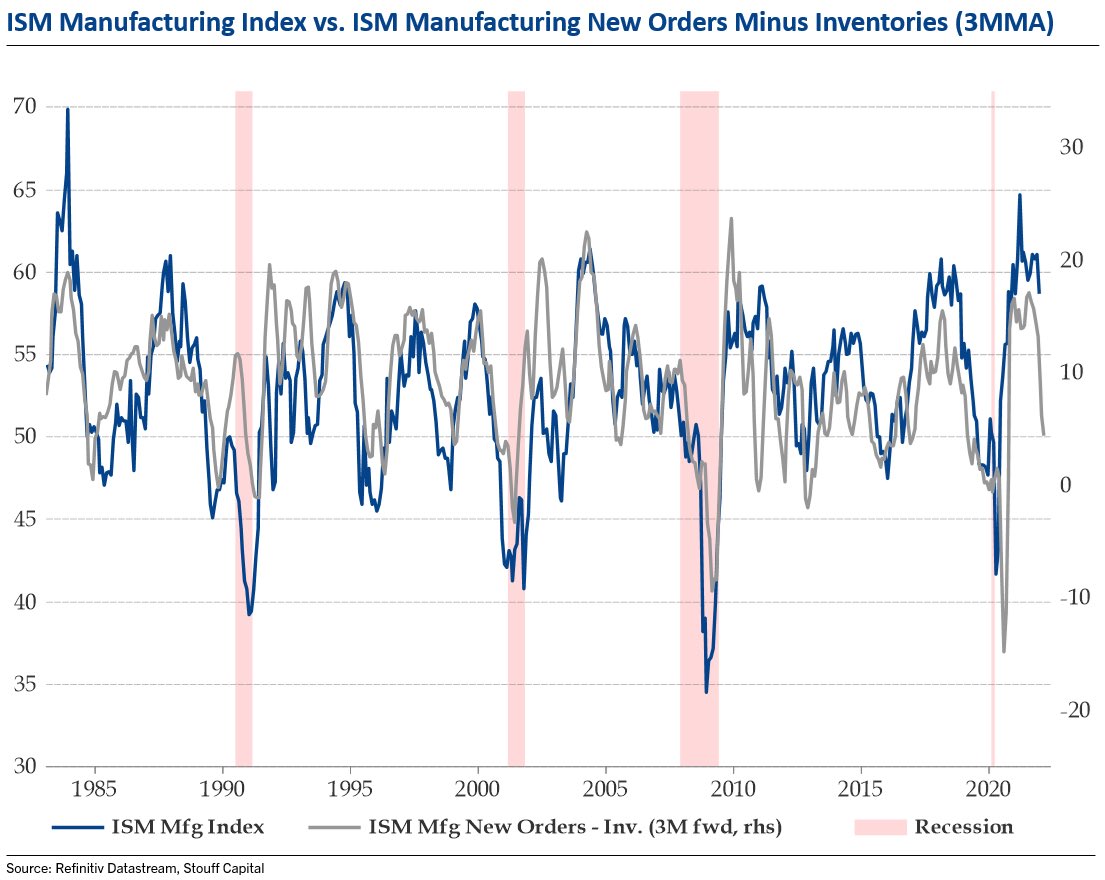
The first graph below, from Stouff Capital, shows the strong correlation between the difference of new orders and inventories compared to the ISM Index. The differential leads the ISM index by three months. If the correlation holds up, we should see a steep decline in ISM in the coming three months.

The following two graphs show how ISM’s decline may affect bond yields. The first graph below, courtesy of Brett Freeze, shows a statistically strong correlation between nominal ISM (inflation-adjusted) and ten-year UST yields. If the nominal ISM is reversing as it appears, we should expect lower yields. The second graph, courtesy of Mott Capital, charts the correlation of the ISM Prices paid index and inflation expectations. Assuming manufacturing inflation is finally cooling off, inflation expectations should follow. Lower inflation expectations will help reduce bond yields.


Rotations Matter
In 2021, the key to success was understanding when inflationary narratives would dictate market conditions and when deflation narratives drove investors. We do not think 2022 will be as simple.
It is quite possible that value versus growth and low beta versus high beta may be the rotations to key on. As we wrote in An Investment Playbook for Thriving During the Next Market Crash:
“We think it’s likely that value stocks will significantly outperform growth stocks in the event of a sizeable drawdown. Timing the transition from growth to value will be difficult, but such a rotation will likely prove invaluable. You may want to keep the 2000 investment playbook handy.”
Summary
If we learned anything from 2020, the future is far from certain. Not only should we expect the unexpected, but the market reactions to the unexpected may be vastly different than what many assume.
What we discuss above is our best guess as of today. We may be right in some areas and wrong in others. More importantly, we must adjust our expectations as political, economic, and monetary conditions and investor sentiment change.
Navigating 2021 in hindsight was easy. However, a year ago, the outlook was daunting. No doubt 2022 will offer us both risk and rewards. Limiting risks and reaping the rewards will help traverse what offers to be another tricky year.
Maybe, more importantly, relying on trusted economic and market models and not letting psychological biases hinder investment decisions may prove to be the best advice we can offer.
The post 2022 Investment Outlook Part 2 – Stocks & Bonds appeared first on RIA.
stimulus economic growth pandemic treasury securities bonds sp 500 stocks qe fed gdp stimulusInternational
There will soon be one million seats on this popular Amtrak route
“More people are taking the train than ever before,” says Amtrak’s Executive Vice President.
Share this:


While the size of the United States makes it hard for it to compete with the inter-city train access available in places like Japan and many European countries, Amtrak trains are a very popular transportation option in certain pockets of the country — so much so that the country’s national railway company is expanding its Northeast Corridor by more than one million seats.
Related: This is what it's like to take a 19-hour train from New York to Chicago
Running from Boston all the way south to Washington, D.C., the route is one of the most popular as it passes through the most densely populated part of the country and serves as a commuter train for those who need to go between East Coast cities such as New York and Philadelphia for business.
Veronika Bondarenko
Amtrak launches new routes, promises travelers ‘additional travel options’
Earlier this month, Amtrak announced that it was adding four additional Northeastern routes to its schedule — two more routes between New York’s Penn Station and Union Station in Washington, D.C. on the weekend, a new early-morning weekday route between New York and Philadelphia’s William H. Gray III 30th Street Station and a weekend route between Philadelphia and Boston’s South Station.
More Travel:
- A new travel term is taking over the internet (and reaching airlines and hotels)
- The 10 best airline stocks to buy now
- Airlines see a new kind of traveler at the front of the plane
According to Amtrak, these additions will increase Northeast Corridor’s service by 20% on the weekdays and 10% on the weekends for a total of one million additional seats when counted by how many will ride the corridor over the year.
“More people are taking the train than ever before and we’re proud to offer our customers additional travel options when they ride with us on the Northeast Regional,” Amtrak Executive Vice President and Chief Commercial Officer Eliot Hamlisch said in a statement on the new routes. “The Northeast Regional gets you where you want to go comfortably, conveniently and sustainably as you breeze past traffic on I-95 for a more enjoyable travel experience.”
Here are some of the other Amtrak changes you can expect to see
Amtrak also said that, in the 2023 financial year, the Northeast Corridor had nearly 9.2 million riders — 8% more than it had pre-pandemic and a 29% increase from 2022. The higher demand, particularly during both off-peak hours and the time when many business travelers use to get to work, is pushing Amtrak to invest into this corridor in particular.
To reach more customers, Amtrak has also made several changes to both its routes and pricing system. In the fall of 2023, it introduced a type of new “Night Owl Fare” — if traveling during very late or very early hours, one can go between cities like New York and Philadelphia or Philadelphia and Washington. D.C. for $5 to $15.
As travel on the same routes during peak hours can reach as much as $300, this was a deliberate move to reach those who have the flexibility of time and might have otherwise preferred more affordable methods of transportation such as the bus. After seeing strong uptake, Amtrak added this type of fare to more Boston routes.
The largest distances, such as the ones between Boston and New York or New York and Washington, are available at the lowest rate for $20.
stocks pandemic japan europeanInternational
The next pandemic? It’s already here for Earth’s wildlife
Bird flu is decimating species already threatened by climate change and habitat loss.
Share this:


I am a conservation biologist who studies emerging infectious diseases. When people ask me what I think the next pandemic will be I often say that we are in the midst of one – it’s just afflicting a great many species more than ours.
I am referring to the highly pathogenic strain of avian influenza H5N1 (HPAI H5N1), otherwise known as bird flu, which has killed millions of birds and unknown numbers of mammals, particularly during the past three years.
This is the strain that emerged in domestic geese in China in 1997 and quickly jumped to humans in south-east Asia with a mortality rate of around 40-50%. My research group encountered the virus when it killed a mammal, an endangered Owston’s palm civet, in a captive breeding programme in Cuc Phuong National Park Vietnam in 2005.
How these animals caught bird flu was never confirmed. Their diet is mainly earthworms, so they had not been infected by eating diseased poultry like many captive tigers in the region.
This discovery prompted us to collate all confirmed reports of fatal infection with bird flu to assess just how broad a threat to wildlife this virus might pose.
This is how a newly discovered virus in Chinese poultry came to threaten so much of the world’s biodiversity.
The first signs
Until December 2005, most confirmed infections had been found in a few zoos and rescue centres in Thailand and Cambodia. Our analysis in 2006 showed that nearly half (48%) of all the different groups of birds (known to taxonomists as “orders”) contained a species in which a fatal infection of bird flu had been reported. These 13 orders comprised 84% of all bird species.
We reasoned 20 years ago that the strains of H5N1 circulating were probably highly pathogenic to all bird orders. We also showed that the list of confirmed infected species included those that were globally threatened and that important habitats, such as Vietnam’s Mekong delta, lay close to reported poultry outbreaks.
Mammals known to be susceptible to bird flu during the early 2000s included primates, rodents, pigs and rabbits. Large carnivores such as Bengal tigers and clouded leopards were reported to have been killed, as well as domestic cats.
Our 2006 paper showed the ease with which this virus crossed species barriers and suggested it might one day produce a pandemic-scale threat to global biodiversity.
Unfortunately, our warnings were correct.
A roving sickness
Two decades on, bird flu is killing species from the high Arctic to mainland Antarctica.
In the past couple of years, bird flu has spread rapidly across Europe and infiltrated North and South America, killing millions of poultry and a variety of bird and mammal species. A recent paper found that 26 countries have reported at least 48 mammal species that have died from the virus since 2020, when the latest increase in reported infections started.
Not even the ocean is safe. Since 2020, 13 species of aquatic mammal have succumbed, including American sea lions, porpoises and dolphins, often dying in their thousands in South America. A wide range of scavenging and predatory mammals that live on land are now also confirmed to be susceptible, including mountain lions, lynx, brown, black and polar bears.
The UK alone has lost over 75% of its great skuas and seen a 25% decline in northern gannets. Recent declines in sandwich terns (35%) and common terns (42%) were also largely driven by the virus.
Scientists haven’t managed to completely sequence the virus in all affected species. Research and continuous surveillance could tell us how adaptable it ultimately becomes, and whether it can jump to even more species. We know it can already infect humans – one or more genetic mutations may make it more infectious.
At the crossroads
Between January 1 2003 and December 21 2023, 882 cases of human infection with the H5N1 virus were reported from 23 countries, of which 461 (52%) were fatal.
Of these fatal cases, more than half were in Vietnam, China, Cambodia and Laos. Poultry-to-human infections were first recorded in Cambodia in December 2003. Intermittent cases were reported until 2014, followed by a gap until 2023, yielding 41 deaths from 64 cases. The subtype of H5N1 virus responsible has been detected in poultry in Cambodia since 2014. In the early 2000s, the H5N1 virus circulating had a high human mortality rate, so it is worrying that we are now starting to see people dying after contact with poultry again.
It’s not just H5 subtypes of bird flu that concern humans. The H10N1 virus was originally isolated from wild birds in South Korea, but has also been reported in samples from China and Mongolia.
Recent research found that these particular virus subtypes may be able to jump to humans after they were found to be pathogenic in laboratory mice and ferrets. The first person who was confirmed to be infected with H10N5 died in China on January 27 2024, but this patient was also suffering from seasonal flu (H3N2). They had been exposed to live poultry which also tested positive for H10N5.
Species already threatened with extinction are among those which have died due to bird flu in the past three years. The first deaths from the virus in mainland Antarctica have just been confirmed in skuas, highlighting a looming threat to penguin colonies whose eggs and chicks skuas prey on. Humboldt penguins have already been killed by the virus in Chile.

How can we stem this tsunami of H5N1 and other avian influenzas? Completely overhaul poultry production on a global scale. Make farms self-sufficient in rearing eggs and chicks instead of exporting them internationally. The trend towards megafarms containing over a million birds must be stopped in its tracks.
To prevent the worst outcomes for this virus, we must revisit its primary source: the incubator of intensive poultry farms.
Diana Bell does not work for, consult, own shares in or receive funding from any company or organisation that would benefit from this article, and has disclosed no relevant affiliations beyond their academic appointment.
genetic pandemic mortality spread deaths south korea south america europe uk chinaUncategorized
NY Fed Finds Medium, Long-Term Inflation Expectations Jump Amid Surge In Stock Market Optimism
NY Fed Finds Medium, Long-Term Inflation Expectations Jump Amid Surge In Stock Market Optimism
One month after the inflation outlook tracked…
Share this:


One month after the inflation outlook tracked by the NY Fed Consumer Survey extended their late 2023 slide, with 3Y inflation expectations in January sliding to a record low 2.4% (from 2.6% in December), even as 1 and 5Y inflation forecasts remained flat, moments ago the NY Fed reported that in February there was a sharp rebound in longer-term inflation expectations, rising to 2.7% from 2.4% at the three-year ahead horizon, and jumping to 2.9% from 2.5% at the five-year ahead horizon, while the 1Y inflation outlook was flat for the 3rd month in a row, stuck at 3.0%.
The increases in both the three-year ahead and five-year ahead measures were most pronounced for respondents with at most high school degrees (in other words, the "really smart folks" are expecting deflation soon). The survey’s measure of disagreement across respondents (the difference between the 75th and 25th percentile of inflation expectations) decreased at all horizons, while the median inflation uncertainty—or the uncertainty expressed regarding future inflation outcomes—declined at the one- and three-year ahead horizons and remained unchanged at the five-year ahead horizon.
Going down the survey, we find that the median year-ahead expected price changes increased by 0.1 percentage point to 4.3% for gas; decreased by 1.8 percentage points to 6.8% for the cost of medical care (its lowest reading since September 2020); decreased by 0.1 percentage point to 5.8% for the cost of a college education; and surprisingly decreased by 0.3 percentage point for rent to 6.1% (its lowest reading since December 2020), and remained flat for food at 4.9%.

We find the rent expectations surprising because it is happening just asking rents are rising across the country.

At the same time as consumers erroneously saw sharply lower rents, median home price growth expectations remained unchanged for the fifth consecutive month at 3.0%.
Turning to the labor market, the survey found that the average perceived likelihood of voluntary and involuntary job separations increased, while the perceived likelihood of finding a job (in the event of a job loss) declined. "The mean probability of leaving one’s job voluntarily in the next 12 months also increased, by 1.8 percentage points to 19.5%."

Mean unemployment expectations - or the mean probability that the U.S. unemployment rate will be higher one year from now - decreased by 1.1 percentage points to 36.1%, the lowest reading since February 2022. Additionally, the median one-year-ahead expected earnings growth was unchanged at 2.8%, remaining slightly below its 12-month trailing average of 2.9%.
Turning to household finance, we find the following:
- The median expected growth in household income remained unchanged at 3.1%. The series has been moving within a narrow range of 2.9% to 3.3% since January 2023, and remains above the February 2020 pre-pandemic level of 2.7%.
- Median household spending growth expectations increased by 0.2 percentage point to 5.2%. The increase was driven by respondents with a high school degree or less.
- Median year-ahead expected growth in government debt increased to 9.3% from 8.9%.
- The mean perceived probability that the average interest rate on saving accounts will be higher in 12 months increased by 0.6 percentage point to 26.1%, remaining below its 12-month trailing average of 30%.
- Perceptions about households’ current financial situations deteriorated somewhat with fewer respondents reporting being better off than a year ago. Year-ahead expectations also deteriorated marginally with a smaller share of respondents expecting to be better off and a slightly larger share of respondents expecting to be worse off a year from now.
- The mean perceived probability that U.S. stock prices will be higher 12 months from now increased by 1.4 percentage point to 38.9%.
- At the same time, perceptions and expectations about credit access turned less optimistic: "Perceptions of credit access compared to a year ago deteriorated with a larger share of respondents reporting tighter conditions and a smaller share reporting looser conditions compared to a year ago."

Also, a smaller percentage of consumers, 11.45% vs 12.14% in prior month, expect to not be able to make minimum debt payment over the next three months

Last, and perhaps most humorous, is the now traditional cognitive dissonance one observes with these polls, because at a time when long-term inflation expectations jumped, which clearly suggests that financial conditions will need to be tightened, the number of respondents expecting higher stock prices one year from today jumped to the highest since November 2021... which incidentally is just when the market topped out during the last cycle before suffering a painful bear market.


Veterans Affairs Kept COVID-19 Vaccine Mandate In Place Without Evidence


The Coming Of The Police State In America


‘I couldn’t stand the pain’: the Turkish holiday resort that’s become an emergency dental centre for Britons who can’t get treated at home


Beloved mall retailer files Chapter 7 bankruptcy, will liquidate


Is the National Guard a solution to school violence?


Rand Paul Teases Senate GOP Leader Run – Musk Says “I Would Support”


The next pandemic? It’s already here for Earth’s wildlife


Vaccine-skeptical mothers say bad health care experiences made them distrust the medical system


Are Voters Recoiling Against Disorder?


The Great Replacement Loophole: Illegal Immigrants Score 5-Year Work Benefit While “Waiting” For Deporation, Asylum
-

 Uncategorized3 weeks ago
All Of The Elements Are In Place For An Economic Crisis Of Staggering Proportions
-

 Uncategorized1 month ago
Cathie Wood sells a major tech stock (again)
-

 Uncategorized3 weeks ago
California Counties Could Be Forced To Pay $300 Million To Cover COVID-Era Program
-

 Uncategorized2 weeks ago
Apparel Retailer Express Moving Toward Bankruptcy
-

 Uncategorized4 weeks ago
Industrial Production Decreased 0.1% in January
-

 International3 days ago
EyePoint poaches medical chief from Apellis; Sandoz CFO, longtime BioNTech exec to retire
-

 International3 days ago
Walmart launches clever answer to Target’s new membership program
-

 Uncategorized3 weeks ago
RFK Jr: The Wuhan Cover-Up & The Rise Of The Biowarfare-Industrial Complex