Work-From-Home Stocks – Room to Run or Due for Correction?
Work-From-Home Stocks – Room to Run or Due for Correction?
Share this:


The massive market sell-off and subsequent rebound in the wake of the coronavirus shutdown masked multiple different market movements - airlines, travel and banks tanked; large-cap tech (primarily the FANGs) dipped and then recovered with many setting new highs; and a select group of companies servicing the Work-From-Home (WFH) movement surged (most notably Zoom, which is up 260% for the year).
According to FirstRate Data, there has been a tenfold increase in customer demand for analytics on WFH stocks, with the central question being: should the rally in WFH stocks be chased or are they overextended and due for a correction?
Work-From-Home stocks - a low-risk investment opportunity?
Before considering the likely direction of the WFH stocks it is worth noting that these now exhibit the very interesting property of low (or even negative) betas. Beta is a measure of how volatile a stock is in relation to the broader market - with higher risk stocks having betas above one and low risk stocks such as utilities having betas below one.
Traditionally mid-cap tech stocks such as the WFH stocks would have very high betas, often close to 2, meaning the returns of these stocks are expected to be a multiple of the returns on the broader index. Since the Covid-19 crisis, however, these stocks are moving contrary to the broader indices and so have low betas often associated with low-risk stocks such as utilities.
For an investor holding a portfolio of diversified stocks, this means the stocks can be added to the portfolio and provide additional returns whilst at the same time reducing portfolio volatility (note that these low betas are likely a temporary phenomenon and would be unlikely to last over six months).
Are Work-From-Home stocks already overbought?
In terms of technicals, most WFH stocks look very stretched - for example the stochastic oscillator for Zoom, Slack, Peloton and Shopify are all above 80, indicating the stocks are extremely overbought. In addition, there is significant headline risk in the WFH cohort, note the 5-10% selloff on the mildly optimistic news of an early-stage vaccine in mid-May.
Fundamentals look even more precarious - valuations have already priced in dramatic growth and these companies will need to demonstrate extremely strong revenue growth to justify their valuations. For example, Zoom currently trades at a valuation of 66 times its sales, when a typical tech company would be expected to be 10-15 times sales.
It therefore appears that much of the hyper-growth from Covid-19 is already priced into the WFH stocks and risk is to the downside.
Opportunities for the second wave Work-From-Home movement
However, there is still significant opportunity in companies that will benefit from second-order effects of the WFH movement - i.e. companies that provide services to the 'core' WFH companies. These companies are typically technology vendors, supplying the key infrastructure components that the WFH companies rely on.
Many of these stocks are just beginning to be recognised now as the core WFH stocks were previously the primary focus of investor's attention. For example, Splunk (which provides a data-analytics service) had seen its stock price only recover to pre-Covid levels by mid-May, however its stock surged 12% after it's May 21 earnings release when it provided strong guidance due to onboarding key customers such as Zoom and Shopify.
Similarly Twilio surged 30% after it announced increased demand from telehealth and tech-education companies.

Source: Admiral Markets MT5 with MT5-SE Add-on #TWLO Weekly chart (between 24 Jun 2018 and 27 May 2020). Accessed: 27 May 2020, at 9:00am EEST - Please note: Past performance is not a reliable indicator of future results, or future performance.
There are numerous tech stocks still to report which are likely to benefit significantly from second-order effects of WFH whose stock has not seen a dramatic increase, such as ZenDesk (ZEN) which provides customer support tech for websites, RingCentral (RNG) which provides cloud-based communications solutions, SolarWinds (SWI) which proxies network monitoring technology.
Whilst the WFH rally may have further to run the risks of a major downside correction are mounting, there is still significant value in stocks of companies providing the infrastructure for the core WFH companies.
How can you get in on the action? Sign up for a trading account with Admiral Markets!
Did you know you can trade 4,000 plus stocks via CFDs with our Trade.MT5 account? This allows you to trade the changing prices of your favourite company shares without having to invest in the shares outright. Learn more and open an account by clicking the banner below.

INFORMATION ABOUT ANALYTICAL MATERIALS:
The given data provides additional information regarding all analysis, estimates, prognosis, forecasts, market reviews, weekly outlooks or other similar assessments or information (hereinafter "Analysis") published on the website of Admiral Markets. Before making any investment decisions please pay close attention to the following:
1.This is a marketing communication. The content is published for informative purposes only and is in no way to be construed as investment advice or recommendation. It has not been prepared in accordance with legal requirements designed to promote the independence of investment research, and that it is not subject to any prohibition on dealing ahead of the dissemination of investment research.
2.Any investment decision is made by each client alone whereas Admiral Markets AS (Admiral Markets) shall not be responsible for any loss or damage arising from any such decision, whether or not based on the content.
3.With view to protecting the interests of our clients and the objectivity of the Analysis, Admiral Markets has established relevant internal procedures for prevention and management of conflicts of interest.
4.The Analysis is prepared by an independent analyst Ryan Maxwell, Guest Contributor (hereinafter "Author") based on personal estimations.
5.Whilst every reasonable effort is taken to ensure that all sources of the content are reliable and that all information is presented, as much as possible, in an understandable, timely, precise and complete manner, Admiral Markets does not guarantee the accuracy or completeness of any information contained within the Analysis.
6.Any kind of past or modeled performance of financial instruments indicated within the content should not be construed as an express or implied promise, guarantee or implication by Admiral Markets for any future performance. The value of the financial instrument may both increase and decrease and the preservation of the asset value is not guaranteed.
7.Leveraged products (including contracts for difference) are speculative in nature and may result in losses or profit. Before you start trading, please ensure that you fully understand the risks involved.
Uncategorized
Correcting the Washington Post’s 11 Charts That Are Supposed to Tell Us How the Economy Changed Since Covid
The Washington Post made some serious errors or omissions in its 11 charts that are supposed to tell us how Covid changed the economy. Wages Starting with…
Share this:

The Washington Post made some serious errors or omissions in its 11 charts that are supposed to tell us how Covid changed the economy.
Wages
Starting with its second chart, the article gives us an index of average weekly wages since 2019. The index shows a big jump in 2020, which then falls off in 2021 and 2022, before rising again in 2023.
It tells readers:
“Many Americans got large pay increases after the pandemic, when employers were having to one-up each other to find and keep workers. For a while, those wage gains were wiped out by decade-high inflation: Workers were getting larger paychecks, but it wasn’t enough to keep up with rising prices.”
That actually is not what its chart shows. The big rise in average weekly wages at the start of the pandemic was not the result of workers getting pay increases, it was the result of low-paid workers in sectors like hotels and restaurants losing their jobs.
The number of people employed in the low-paying leisure and hospitality sector fell by more than 8 million at the start of the pandemic. Even at the start of 2021 it was still down by over 4 million.
Laying off low-paid workers raises average wages in the same way that getting the short people to leave raises the average height of the people in the room. The Washington Post might try to tell us that the remaining people grew taller, but that is not what happened.
The other problem with this chart is that it is giving us weekly wages. The length of the average workweek jumped at the start of the pandemic as employers decided to work the workers they had longer hours rather than hire more workers. In January of 2021 the average workweek was 34.9 hours, compared to 34.4 hours in 2019 and 34.3 hours in February.
This increase in hours, by itself, would raise weekly pay by 2.0 percent. As hours returned to normal in 2022, this measure would misleadingly imply that wages were falling.
It is also worth noting that the fastest wage gains since the pandemic have been at the bottom end of the wage distribution and the Black/white wage gap has fallen to its lowest level on record.
Saving Rates
The third chart shows the saving rate since 2019. It shows a big spike at the start of the pandemic, as people stopped spending on things like restaurants and travel and they got pandemic checks from the government. It then falls sharply in 2022 and is lower in the most recent quarters than in 2019.
The piece tells readers:
“But as the world reopened — and people resumed spending on dining out, travel, concerts and other things that were previously off-limits — savings rates have leveled off. Americans are also increasingly dip into rainy-day funds to pay more for necessities, including groceries, housing, education and health care. In fact, Americans are now generally saving less of their incomes than they were before the pandemic.
This is an incomplete picture due to a somewhat technical issue. As I explained in a blogpost a few months ago, there is an unusually large gap between GDP as measured on the output side and GDP measured on the income side. In principle, these two numbers should be the same, but they never come out exactly equal.
In recent quarters, the gap has been 2.5 percent of GDP. This is extraordinarily large, but it also is unusual in that the output side is higher than the income side, the opposite of the standard pattern over the last quarter century.
It is standard for economists to assume that the true number for GDP is somewhere between the two measures. If we make that assumption about the data for 2023, it would imply that income is somewhat higher than the data now show and consumption somewhat lower.
In that story, as I showed in the blogpost, the saving rate for 2023 would be 6.8 percent of disposable income, roughly the same as the average for the three years before the pandemic. This would mean that people are not dipping into their rainy-day funds as the Post tells us. They are spending pretty much as they did before the pandemic.
Credit Card Debt
The next graph shows that credit card debt is rising again, after sinking in the pandemic. The piece tells readers:
“But now, debt loads are swinging higher again as families try to keep up with rising prices. Total household debt reached a record $17.5 trillion at the end of 2023, according to the Federal Reserve Bank of New York. And, in a worrisome sign for the economy, delinquency rates on mortgages, car loans and credit cards are all rising, too.”
There are several points worth noting here. Credit card debt is rising, but measured relative to income it is still below where it was before the pandemic. It was 6.7 percent of disposable income at the end of 2019, compared to 6.5 percent at the end of last year.
The second point is that a major reason for the recent surge in credit card debt is that people are no longer refinancing mortgages. There was a massive surge in mortgage refinancing with the low interest rates in 2020-2021.
Many of the people who refinanced took additional money out, taking advantage of the increased equity in their home. This channel of credit was cut off when mortgage rates jumped in 2022 and virtually ended mortgage refinancing. This means that to a large extent the surge in credit card borrowing is simply a shift from mortgage debt to credit card debt.
The point about total household debt hitting a record can be said in most months. Except in the period immediately following the collapse of the housing bubble, total debt is almost always rising.
And the rise in delinquencies simply reflects the fact that they had been at very low levels in 2021 and 2022. For the most part, delinquency rates are just getting back to their pre-pandemic levels, which were historically low.
Grocery Prices and Gas Prices
The next two charts show the patterns in grocery prices and gas prices since the pandemic. It would have been worth mentioning that every major economy in the world saw similar run-ups in prices in these two areas. In other words, there was nothing specific to U.S. policy that led to a surge in inflation here.
The Missing Charts
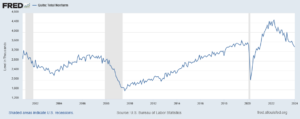
There are several areas where it would have been interesting to see charts which the Post did not include. It would have been useful to have a chart on job quitters, the number of people who voluntarily quit their jobs during the pandemic. In the tight labor markets of 2021 and 2022 the number of workers who left jobs they didn’t like soared to record levels, as shown below.
The vast majority of these workers took other jobs that they liked better. This likely explains another item that could appear as a graph, the record level of job satisfaction.
In a similar vein there has been an explosion in the number of people who work from home at least part-time. This has increased by more than 17 million during the pandemic. These workers are saving themselves thousands of dollars a year on commuting costs and related expenses, as well as hundreds of hours spent commuting.
Finally, there has been an explosion in the use of telemedicine since the pandemic. At the peak, nearly one in four visits with a health care professional was a remote consultation. This saved many people with serious health issues the time and inconvenience associated with a trip to a hospital or doctor’s office. The increased use of telemedicine is likely to be a lasting gain from the pandemic.
The World Has Changed
The pandemic will likely have a lasting impact on the economy and society. The Washington Post’s charts captured part of this story, but in some cases misrepr
The post Correcting the Washington Post’s 11 Charts That Are Supposed to Tell Us How the Economy Changed Since Covid appeared first on Center for Economic and Policy Research.
federal reserve pandemic mortgage rates gdp interest ratesInternational
“Extreme Events”: US Cancer Deaths Spiked In 2021 And 2022 In “Large Excess Over Trend”
"Extreme Events": US Cancer Deaths Spiked In 2021 And 2022 In "Large Excess Over Trend"
Cancer deaths in the United States spiked in 2021…
Share this:

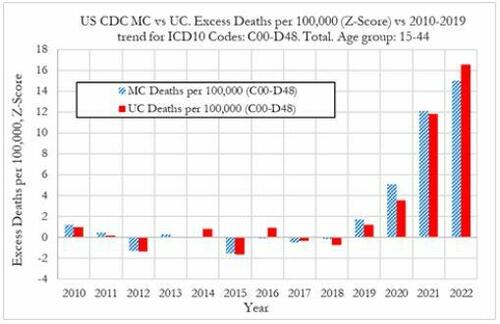
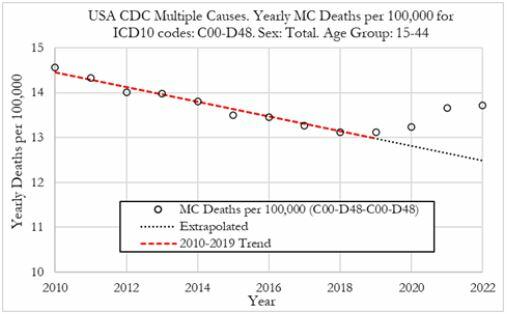
Cancer deaths in the United States spiked in 2021 and 2022 among 15-44 year-olds "in large excess over trend," marking jumps of 5.6% and 7.9% respectively vs. a rise of 1.7% in 2020, according to a new preprint study from deep-dive research firm, Phinance Technologies.
Extreme Events
The report, which relies on data from the CDC, paints a troubling picture.
"We show a rise in excess mortality from neoplasms reported as underlying cause of death, which started in 2020 (1.7%) and accelerated substantially in 2021 (5.6%) and 2022 (7.9%). The increase in excess mortality in both 2021 (Z-score of 11.8) and 2022 (Z-score of 16.5) are highly statistically significant (extreme events)," according to the authors.
That said, co-author, David Wiseman, PhD (who has 86 publications to his name), leaves the cause an open question - suggesting it could either be a "novel phenomenon," Covid-19, or the Covid-19 vaccine.
Cancer deaths in US in 2021 & 2022 in large excess over trend for 15-44 year-olds as extreme events. A novel phenomenon? C19? lockdowns? C19 vaccines? Honored to participate in this work. #CDC where are you? @DowdEdwardhttps://t.co/iUV5oQiWCW pic.twitter.com/uytzaIvvor
— David Wiseman PhD, MRPharmS (@AdhesionsOrg) March 12, 2024
"The results indicate that from 2021 a novel phenomenon leading to increased neoplasm deaths appears to be present in individuals aged 15 to 44 in the US," reads the report.
The authors suggest that the cause may be the result of "an unexpected rise in the incidence of rapidly growing fatal cancers," and/or "a reduction in survival in existing cancer cases."
They also address the possibility that "access to utilization of cancer screening and treatment" may be a factor - the notion that pandemic-era lockdowns resulted in fewer visits to the doctor. Also noted is that "Cancers tend to be slowly-developing diseases with remarkably stable death rates and only small variations over time," which makes "any temporal association between a possible explanatory factor (such as COVID-19, the novel COVID-19 vaccines, or other factor(s)) difficult to establish."
That said, a ZeroHedge review of the CDC data reveals that it does not provide information on duration of illness prior to death - so while it's not mentioned in the preprint, it can't rule out so-called 'turbo cancers' - reportedly rapidly developing cancers, the existence of which has been largely anecdotal (and widely refuted by the usual suspects).
While the Phinance report is extremely careful not to draw conclusions, researcher "Ethical Skeptic" kicked the barn door open in a Thursday post on X - showing a strong correlation between "cancer incidence & mortality" coinciding with the rollout of the Covid mRNA vaccine.
The argument is over.
— Ethical Skeptic ☀ (@EthicalSkeptic) March 14, 2024
The Covid mRNA Vaxx has cause a sizeable 2021 inflection, and now novel-trend elevation in terms of both cancer incidence & mortality.
Now you know who the liars were all along.
????Incidence = 14.8% excess
????UCoD Mortality = 5.3% excess (lags Incidence) pic.twitter.com/uwN9GMrHl1
Phinance principal Ed Dowd commented on the post, noting that "Cancer is suddenly an accelerating growth industry!"
????Indeed it is…Cancer is suddenly an accelerating growth industry! @EthicalSkeptic provides a chart below showing US Cancer treatment in constant dollars with a current growth rate of 14.8% (6.3% New CAGR) versus long term trend of 1.78% CAGR or $33.8 billion in excess cancer… https://t.co/RIn4R2YZZ7
— Edward Dowd (@DowdEdward) March 14, 2024
Continued:
As a former portfolio manager of of a $14 billion Large Cap Growth Equity portfolio I can definitively say Cancer treatments and the Disabilities have become growth industries that both have inflection points coincidental to the mRNA vaccine rollouts in 2021.
— Edward Dowd (@DowdEdward) March 14, 2024
Chart 1 from… pic.twitter.com/TCt4X1plnM
Bottom line - hard data is showing alarming trends, which the CDC and other agencies have a requirement to explore and answer truthfully - and people are asking #WhereIsTheCDC.
We aren't holding our breath.
Experts are sounding the alarm on a spike in cancer diagnosis worldwide. It is still a mystery. @DowdEdward from Phinance Technologies has also been sounding the alarm for months.
— dr.ir. Carla Peeters (@CarlaPeeters3) March 15, 2024
We are facing a dramatic degradation of the human immune system https://t.co/CPnwP3Oj9G
Wiseman, meanwhile, points out that Pfizer and several other companies are making "significant investments in cancer drugs, post COVID."
Pfizer among several companies making significant investments in cancer drugs, post COVID. @DowdEdward @Kevin_McKernan @JesslovesMJK @niki_kyrylenko https://t.co/nefEZYLW1o https://t.co/r505Sbbcq4
— David Wiseman PhD, MRPharmS (@AdhesionsOrg) March 15, 2024
Phinance
We've featured several of Phinance's self-funded deep dives into pandemic data that nobody else is doing. If you'd like to support them, click here.
List of our projects following disturbing tends in deaths, disabilities and absences.
— Edward Dowd (@DowdEdward) March 16, 2024
Link to projects at bottom.
✅ V-Damage Project
✅ Excess Mortality Project
✅ US Disabilities Project
✅ US BLS Absence rates Project
✅ US Cause of Death Project
✅ UK Cause of Death…
Government
Gen Z, The Most Pessimistic Generation In History, May Decide The Election
Gen Z, The Most Pessimistic Generation In History, May Decide The Election
Authored by Mike Shedlock via MishTalk.com,
Young adults are more…
Share this:

Authored by Mike Shedlock via MishTalk.com,
Young adults are more skeptical of government and pessimistic about the future than any living generation before them.
This is with reason, and it’s likely to decide the election.
Rough Years and the Most Pessimism Ever
The Wall Street Journal has an interesting article on The Rough Years That Turned Gen Z Into America’s Most Disillusioned Voters.
Young adults in Generation Z—those born in 1997 or after—have emerged from the pandemic feeling more disillusioned than any living generation before them, according to long-running surveys and interviews with dozens of young people around the country. They worry they’ll never make enough money to attain the security previous generations have achieved, citing their delayed launch into adulthood, an impenetrable housing market and loads of student debt.
And they’re fed up with policymakers from both parties.
Washington is moving closer to passing legislation that would ban or force the sale of TikTok, a platform beloved by millions of young people in the U.S. Several young people interviewed by The Wall Street Journal said they spend hours each day on the app and use it as their main source of news.
“It’s funny how they quickly pass this bill about this TikTok situation. What about schools that are getting shot up? We’re not going to pass a bill about that?” Gaddie asked. “No, we’re going to worry about TikTok and that just shows you where their head is…. I feel like they don’t really care about what’s going on with humanity.”
Gen Z’s widespread gloominess is manifesting in unparalleled skepticism of Washington and a feeling of despair that leaders of either party can help. Young Americans’ entire political memories are subsumed by intense partisanship and warnings about the looming end of everything from U.S. democracy to the planet. When the darkest days of the pandemic started to end, inflation reached 40-year highs. The right to an abortion was overturned. Wars in Ukraine and the Middle East raged.
Dissatisfaction is pushing some young voters to third-party candidates in this year’s presidential race and causing others to consider staying home on Election Day or leaving the top of the ticket blank. While young people typically vote at lower rates, a small number of Gen Z voters could make the difference in the election, which four years ago was decided by tens of thousands of votes in several swing states.
Roughly 41 million Gen Z Americans—ages 18 to 27—will be eligible to vote this year, according to Tufts University.
Gen Z is among the most liberal segments of the electorate, according to surveys, but recent polling shows them favoring Biden by only a slim margin. Some are unmoved by those who warn that a vote against Biden is effectively a vote for Trump, arguing that isn’t enough to earn their support.
Confidence
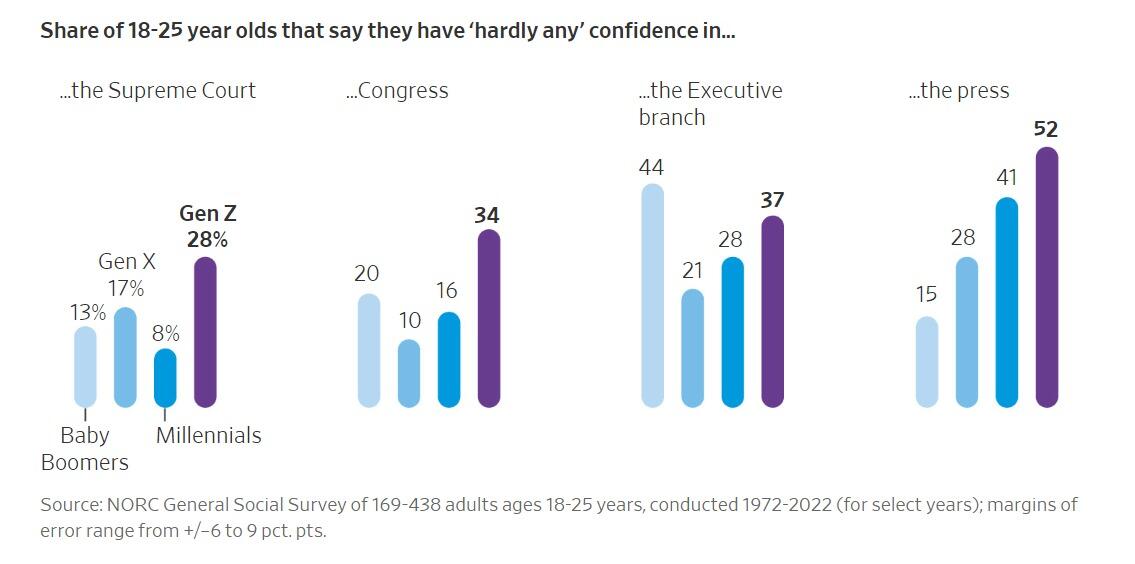
When asked if they had confidence in a range of public institutions, Gen Z’s faith in them was generally below that of the older cohorts at the same point in their lives.
One-third of Gen Z Americans described themselves as conservative, according to NORC’s 2022 General Social Survey. That is a larger share identifying as conservative than when millennials, Gen X and baby boomers took the survey when they were the same age, though some of the differences were small and within the survey’s margin of error.
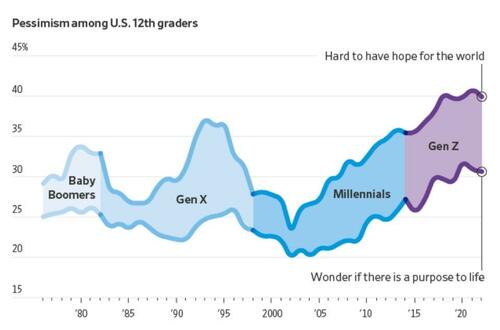
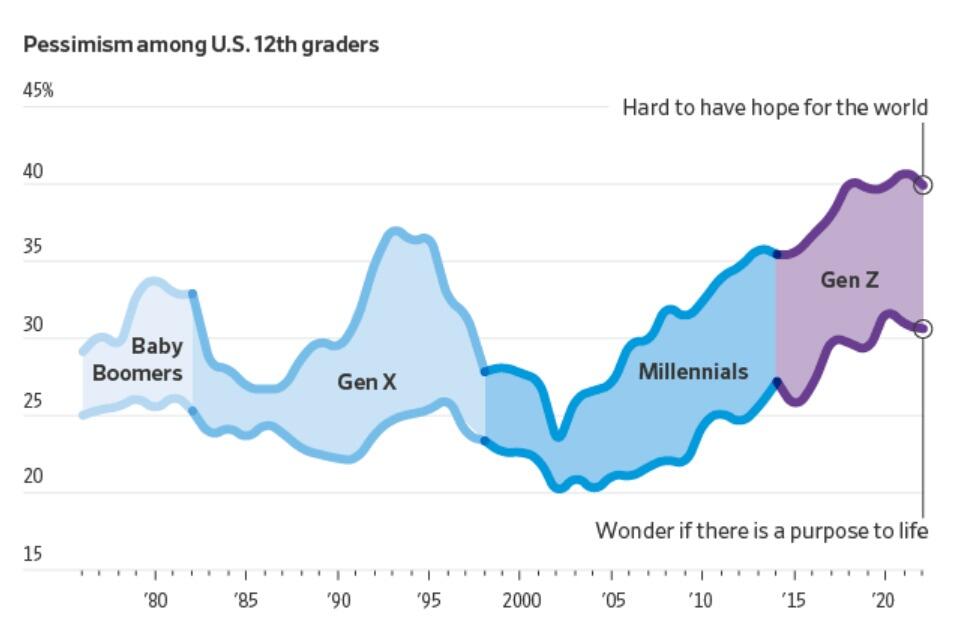
More young people now say they find it hard to have hope for the world than at any time since at least 1976, according to a University of Michigan survey that has tracked public sentiment among 12th-graders for nearly five decades. Young people today are less optimistic than any generation in decades that they’ll get a professional job or surpass the success of their parents, the long-running survey has found. They increasingly believe the system is stacked against them and support major changes to the way the country operates.
Gen Z future Outcome
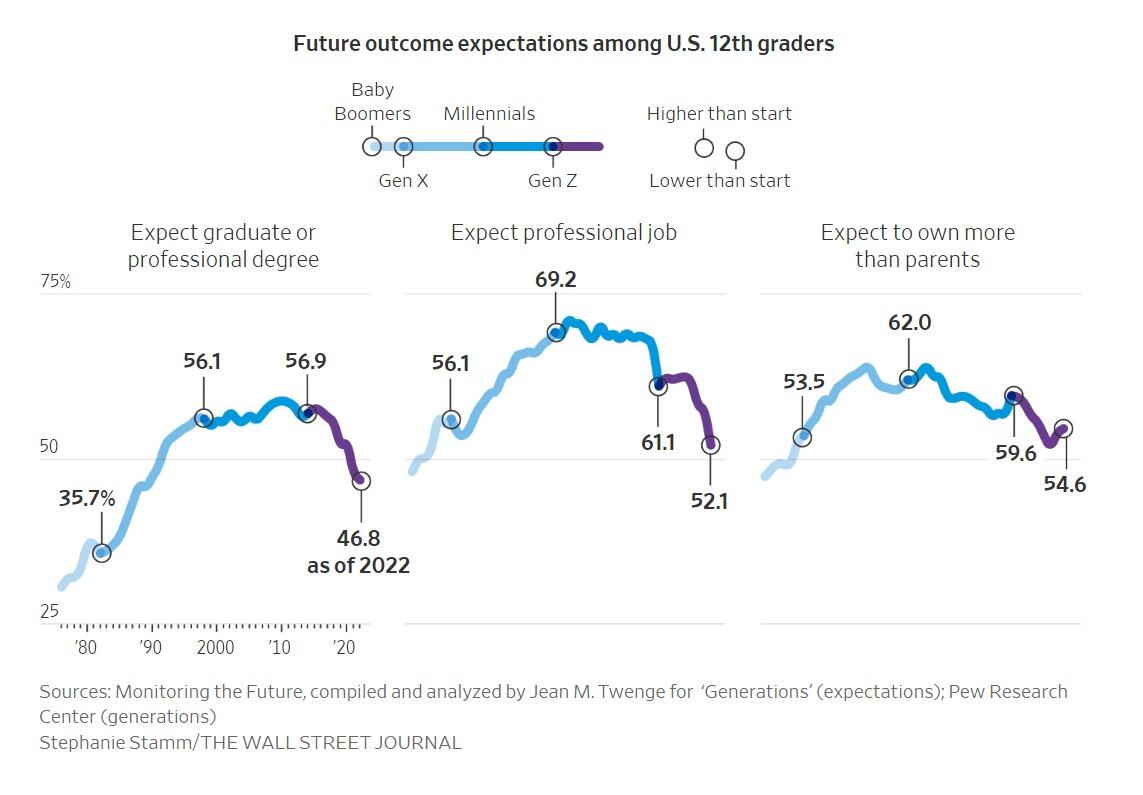
“It’s the starkest difference I’ve documented in 20 years of doing this research,” said Twenge, the author of the book “Generations.” The pandemic, she said, amplified trends among Gen Z that have existed for years: chronic isolation, a lack of social interaction and a propensity to spend large amounts of time online.
A 2020 study found past epidemics have left a lasting impression on young people around the world, creating a lack of confidence in political institutions and their leaders. The study, which analyzed decades of Gallup World polling from dozens of countries, found the decline in trust among young people typically persists for two decades.
Young people are more likely than older voters to have a pessimistic view of the economy and disapprove of Biden’s handling of inflation, according to the recent Journal poll. Among people under 30, Biden leads Trump by 3 percentage points, 35% to 32%, with 14% undecided and the remaining shares going to third-party candidates, including 10% to independent Robert F. Kennedy Jr.
Economic Reality
Gen Z may be the first generation in US history that is not better off than their parents.
Many have given up on the idea they will ever be able to afford a home.
The economy is allegedly booming (I disagree). Regardless, stress over debt is high with younger millennials and zoomers.
This has been a constant theme of mine for many months.
Credit Card and Auto Delinquencies Soar
Credit card debt surged to a record high in the fourth quarter. Even more troubling is a steep climb in 90 day or longer delinquencies.
![]()
Record High Credit Card Debt
Credit card debt rose to a new record high of $1.13 trillion, up $50 billion in the quarter. Even more troubling is the surge in serious delinquencies, defined as 90 days or more past due.
For nearly all age groups, serious delinquencies are the highest since 2011.
Auto Loan Delinquencies
![]()
Serious delinquencies on auto loans have jumped from under 3 percent in mid-2021 to to 5 percent at the end of 2023 for age group 18-29.Age group 30-39 is also troubling. Serious delinquencies for age groups 18-29 and 30-39 are at the highest levels since 2010.
For further discussion please see Credit Card and Auto Delinquencies Soar, Especially Age Group 18 to 39
Generational Homeownership Rates
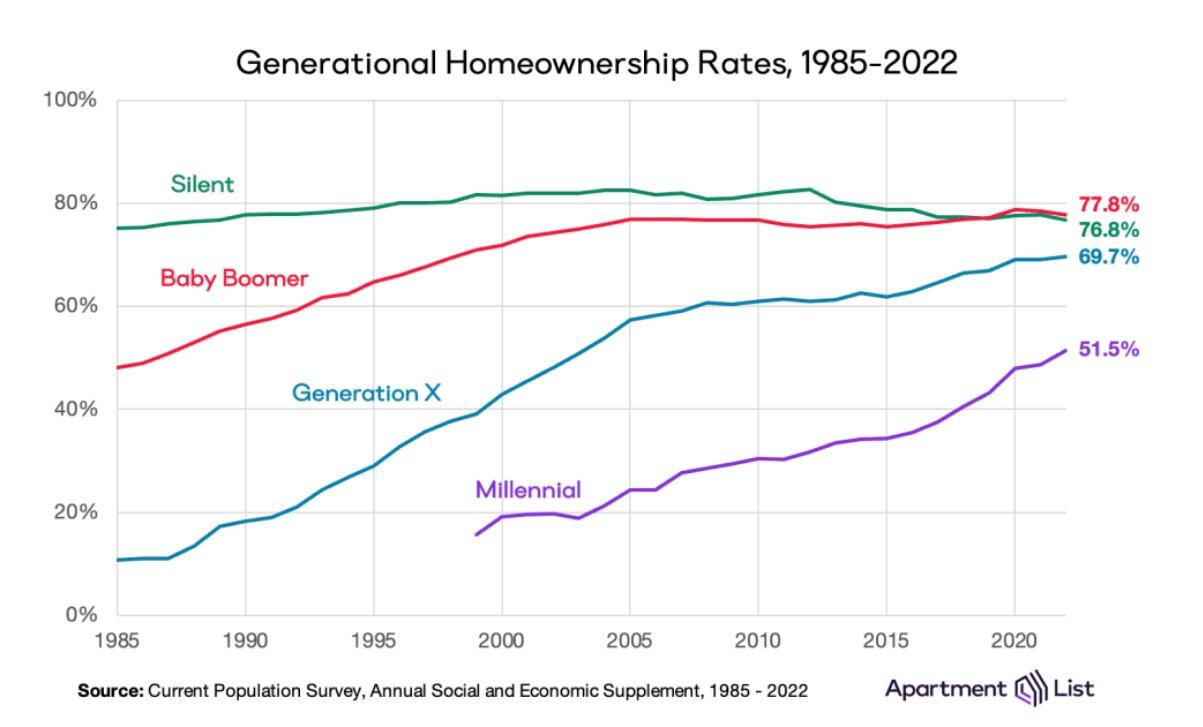
Home ownership rates courtesy of Apartment List
The above chart is from the Apartment List’s 2023 Millennial Homeownership Report
Those struggling with rent are more likely to be Millennials and Zoomers than Generation X, Baby Boomers, or members of the Silent Generation.
The same age groups struggling with credit card and auto delinquencies.
On Average Everything is Great
Average it up, and things look pretty good. This is why we have seen countless stories attempting to explain why people should be happy.
Krugman Blames Partisanship
With the recent rise in consumer sentiment, time to revisit this excellent Briefing Book paper. On reflection, I'd do it a bit differently; same basic conclusion, but I think partisan asymmetry explains even more of the remaining low numbers 1/ https://t.co/4lqm7X4472
— Paul Krugman (@paulkrugman) February 17, 2024
OK, there is a fair amount of partisanship in the polls.
However, Biden isn’t struggling from partisanship alone. If that was the reason, Biden would not be polling so miserably with Democrats in general, blacks, and younger voters.
OK, there is a fair amount of partisanship in the polls.
However, Biden isn’t struggling from partisanship alone. If that was the reason, Biden would not be polling so miserably with Democrats in general, blacks, and younger voters.
This allegedly booming economy left behind the renters and everyone under the age of 40 struggling to make ends meet.
Many Are Addicted to “Buy Now, Pay Later” Plans
Buy Now Pay Later, BNPL, plans are increasingly popular. It’s another sign of consumer credit stress.
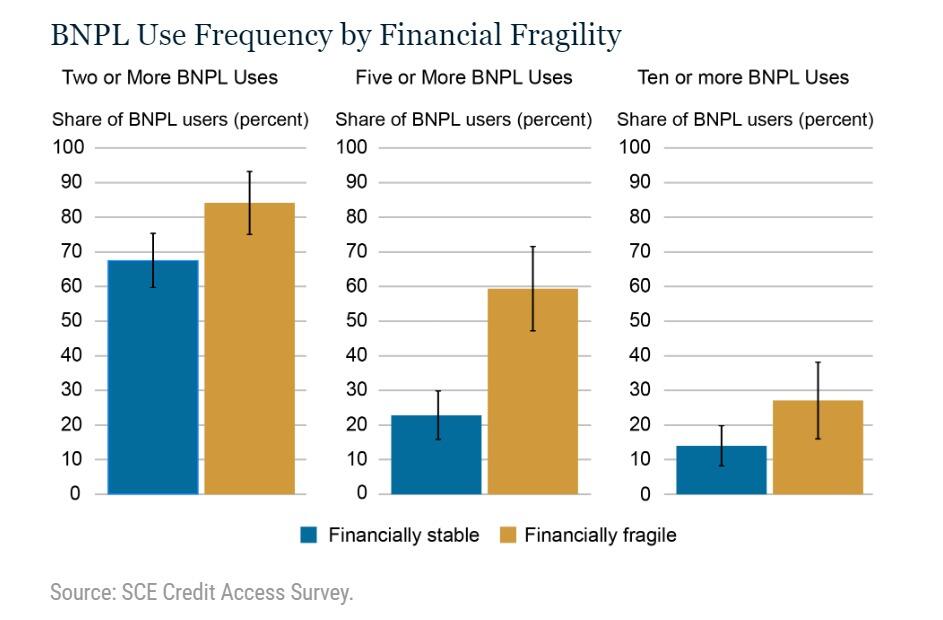
For discussion, please see Many Are Addicted to “Buy Now, Pay Later” Plans, It’s a Big Trap
The study did not break things down by home owners vs renters, but I strongly suspect most of the BNPL use is by renters.
What About Jobs?
Another seemingly strong jobs headline falls apart on closer scrutiny. The massive divergence between jobs and employment continued into February.
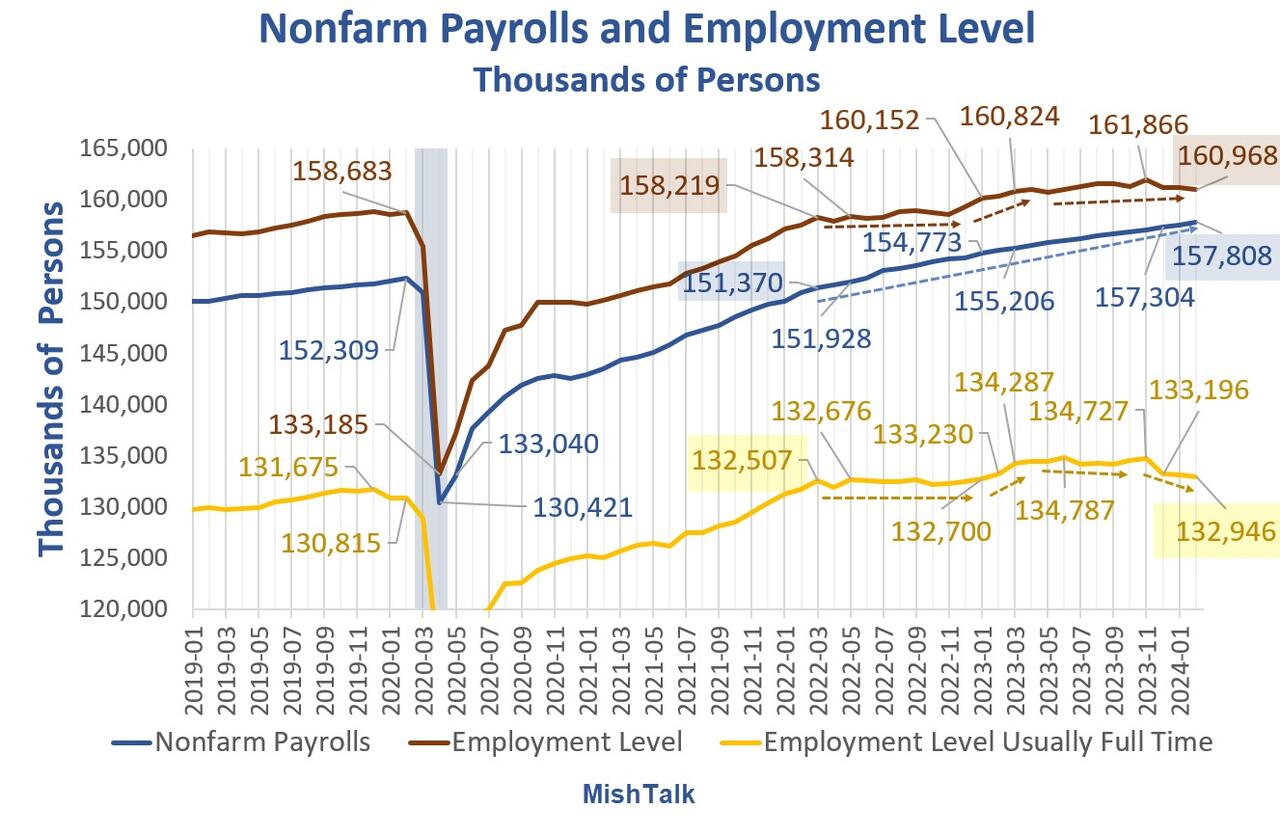
Nonfarm payrolls and employment levels from the BLS, chart by Mish.
Payrolls vs Employment Gains Since March 2023
-
Nonfarm Payrolls: 2,602,000
-
Employment Level: +144,000
-
Full Time Employment: -284,000
For more details of the weakening labor markets, please see Jobs Up 275,000 Employment Down 184,000
CPI Hot Again
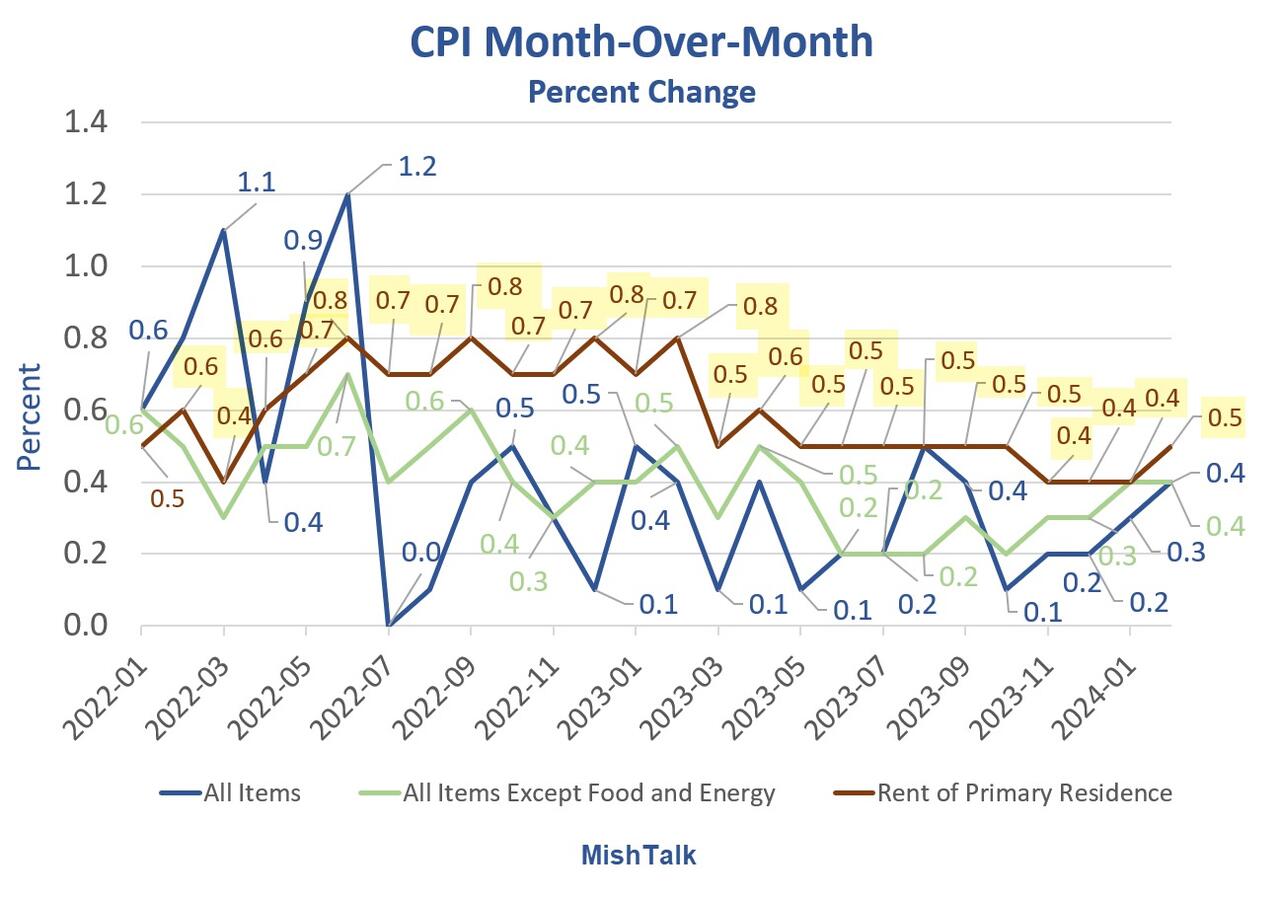
CPI Data from the BLS, chart by Mish.
For discussion of the CPI inflation data for February, please see CPI Hot Again, Rent Up at Least 0.4 Percent for 30 Straight Months
Also note the Producer Price Index (PPI) Much Hotter Than Expected in February
Major Economic Cracks
There are economic cracks in spending, cracks in employment, and cracks in delinquencies.
But there are no cracks in the CPI. It’s coming down much slower than expected. And the PPI appears to have bottomed.
Add it up: Inflation + Recession = Stagflation.
Election Impact
In 2020, younger voters turned out in the biggest wave in history. And they voted for Biden.
Younger voters are not as likely to vote in 2024, and they are less likely to vote for Biden.
Millions of voters will not vote for either Trump or Biden. Net, this will impact Biden more. The base will not decide the election, but the Trump base is far more energized than the Biden base.
If Biden signs a TikTok ban, that alone could tip the election.
If No Labels ever gets its act together, I suspect it will siphon more votes from Biden than Trump. But many will just sit it out.
“We’re just kind of over it,” Noemi Peña, 20, a Tucson, Ariz., resident who works in a juice bar, said of her generation’s attitude toward politics. “We don’t even want to hear about it anymore.” Peña said she might not vote because she thinks it won’t change anything and “there’s just gonna be more fighting.” Biden won Arizona in 2020 by just over 10,000 votes.
The Journal noted nearly one-third of voters under 30 have an unfavorable view of both Biden and Trump, a higher number than all older voters. Sixty-three percent of young voters think neither party adequately represents them.
Young voters in 2020 were energized to vote against Trump. Now they have thrown in the towel.
And Biden telling everyone how great the economy is only rubs salt in the wound.


The War Between Knowledge And Stupidity


Key shipping company files for Chapter 11 bankruptcy


Women’s basketball is gaining ground, but is March Madness ready to rival the men’s game?


Sylvester researchers, collaborators call for greater investment in bereavement care


Gen Z, The Most Pessimistic Generation In History, May Decide The Election


“I Can’t Even Save”: Americans Are Getting Absolutely Crushed Under Enormous Debt Load


Illegal Immigrants Leave US Hospitals With Billions In Unpaid Bills


“Extreme Events”: US Cancer Deaths Spiked In 2021 And 2022 In “Large Excess Over Trend”


Problems After COVID-19 Vaccination More Prevalent Among Naturally Immune: Study


Looking Back At COVID’s Authoritarian Regimes
-

 Uncategorized3 weeks ago
All Of The Elements Are In Place For An Economic Crisis Of Staggering Proportions
-

 International1 week ago
EyePoint poaches medical chief from Apellis; Sandoz CFO, longtime BioNTech exec to retire
-

 Uncategorized4 weeks ago
California Counties Could Be Forced To Pay $300 Million To Cover COVID-Era Program
-

 Uncategorized3 weeks ago
Apparel Retailer Express Moving Toward Bankruptcy
-

 Spread & Containment4 days ago
IFM’s Hat Trick and Reflections On Option-To-Buy M&A
-

 Uncategorized1 month ago
Industrial Production Decreased 0.1% in January
-

 International1 week ago
Walmart launches clever answer to Target’s new membership program
-

 Uncategorized4 weeks ago
RFK Jr: The Wuhan Cover-Up & The Rise Of The Biowarfare-Industrial Complex