Government
Why The Second Stimulus Won’t Have Much Economic Impact
In October, I discuss how the "2nd Derivative Effect" would mute the impact of future stimulus programs. With the passage of the $900 billion stimulus package, we can update the estimates for the economic impact heading into 2021.
While most hope more…
Share this:

In October, I discuss how the “2nd Derivative Effect” would mute the impact of future stimulus programs. With the passage of the $900 billion stimulus package, we can update the estimates for the economic impact heading into 2021.
While most hope more stimulus will cure the economy’s ills, the “2nd derivative effect” will be problematic. Of course, since vast portions of the stimulus package went to everything but “helping out the average American,” such ensures the impact will be far less.
Let me recap.
NOTE: This article was written prior to Trump’s rejection of the stimulus bill. The analysis is based on the bill as is currently written. I will update the analysis if the bill changes.
Making Some Assumptions
As the economy shut down due to the pandemic, the Federal Reserve flooded the system with liquidity in March. At the same time, Congress passed a massive fiscal stimulus bill that extended Unemployment Benefits by $600 per week and sent $1200 checks directly to households.
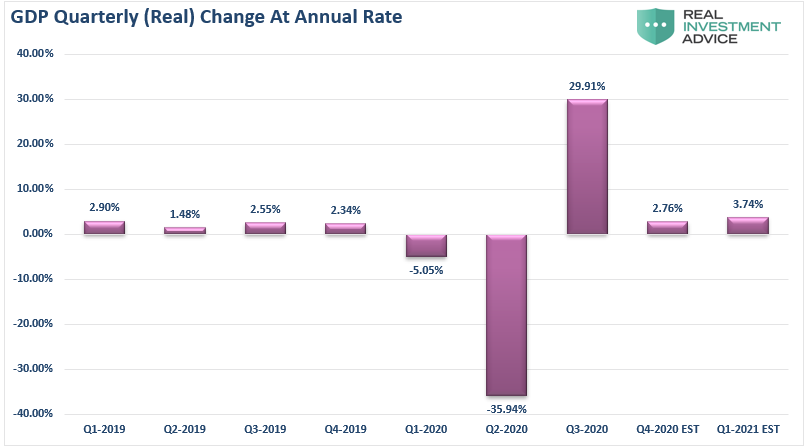
As shown in the chart below of GDP, it worked. In Q3, inflation-adjusted GDP surged 29.91% from the Q2 reading of 35.94%. If we assume that Q4 will increase according to the Atlanta Fed GDPNow estimate, GDP will slow to just a 2.76% advance.

Assuming the direct checks to households hit in January, GDP will rise slightly to 3.74%. In other words, the “2nd derivative effect” requires increasing amounts of Federal Expenditures to generate only marginally higher levels of economic growth.
The chart below adds the percentage change in Federal expenditures to the chart for comparison.

The spike in Q2 in Federal Expenditure was from the initial CARES Act. In Q1-2020, the Government spent $4.9 Trillion in total, which was up $85.3 Billion from Q4-2019. In Q2-2020, it increased sharply, including the passage of the CARES Act. Spending for Q2 jumped to $9.1 Trillion, which was a $4.2 Trillion increase over Q1-2020.
In Q3-2020, spending fell slightly to just $7.2 Trillion, which was down 20% from Q2. However, the $7.2 Trillion in expenditures was still $2.3 Trillion higher than in Q4-2019.
Those are the facts as published by the Federal Reserve. From this point forward, we have to start making some estimates and assumptions for Q4 and Q1-2021.
Impact Of CARES-2
During Q4-2020, not much happened as the Government was fighting over the next round of stimulus. As such, spending fell back to a more normal level of increase. However, if we assume the second CARES Act checks hit by January, it would represent a roughly 8.3% increase in Government spending over Q4-2020.

Such is the “second derivative” effect we mentioned previously.
“In calculus, the second derivative, or the second-order derivative, of a function f is the derivative of the derivative of f.” – Wikipedia
In English, the “second derivative” measures how the rate of change of a quantity is itself changing.
I know, still confusing.
Let’s run an example:
As Government spending grows sequentially larger, each additional round of expenditures will have less and less impact on the total. Going back to 2016, not including the CARES Act, the Government increased spending by roughly $50 billion each quarter on average. If we run a hypothetical model of Government expenditures at $50 billion per quarter, you can see the issue of the “second derivative.”

In this case, even though Federal expenditures are increasing at $50 Billion per quarter, the rate of change declines as the total spending increase.
More Leads To Less
The next chart shows how the “second derivative” is already undermining both fiscal and monetary stimulus. Using actual data going back to the Q1-2019, Federal Expenditures remained relatively stable through Q1-2020, along with real economic growth. However, in Q2-2020, with our estimates for Q3 and Q4, Federal Expenditures will almost double. However, the economy will not return to positive growth.

The chart below shows the inherent problem. While the additional fiscal stimulus may help stave off a more in-depth economic contraction, its impact becomes less over time.

However, this is ultimately the problem with all debt-supported fiscal and monetary programs.
Still In A Recession
As stated, even with the additional stimulus package, the outcome will be muted. If we assume our current estimates for GDP growth over the next 2-quarters, which align with mainstream consensus, we will still be in a recession.

At first glance, it appears that after one negative quarter of GDP, the economy is well back on track to normalcy. However, such an assumption would be incorrect. Given that we measure economic growth on an annualized basis, the three-quarters of positive change following such a steep decline still leaves the economy in a recession.

Yes, add a couple of more quarters of economic growth, and you will eventually be back into positive territory. However, therein lies an even bigger problem.
Dollars Of Growth Deteriorate
As noted above, it requires increasing levels of debt to generate lower rates of economic growth. The chart below shows the previous and estimated CARES Acts and their impact on GDP growth.

To understand this better, we can view it from how many dollars it requires to generate $1 of economic growth. Following the economic shutdown, when economic activity went to zero, each dollar of input had a more considerable impact as the economy restarted. However, in Q4, economic activity has already recovered and begun to stabilize at a slightly lower level than seen previously.
High-frequency data like credit card spending and main-street activity indicators tell us this is the case.

Given that stabilization of activity, it will require more dollars to generate economic growth in the future. As shown, it will need $7 of debt-supported expenditures to create $1 of economic growth.

Here is the exciting part. That is NOT a new thing. As I discussed just recently, “The One-Way Trip Of American Debt:”
The “COVID-19″ crisis led to a debt surge to new highs. Such will result in a retardation of economic growth to 1.5% or less, as discussed recently. Simultaneously, the stock market may rise due to massive Fed liquidity, but only the 10% of the population owning 88% of the market benefits. In the future, the economic bifurcation will deepen to the point where 5% of the population owns virtually all of it.
As I noted previously, it now requires $7.42 of debt to create $1 of economic growth, which will only worsen as the debt continues to expand at the expense of more robust rates of growth.

You Can’t Use Debt To Create Growth.
As noted above, more debt doesn’t lead to more robust rates of economic growth or prosperity. Since 1980, the overall increase in debt has surged to levels that currently usurp the entirety of economic growth. With economic growth rates now at the lowest levels on record, the change in debt continues to divert more tax dollars away from productive investments into the service of debt and social welfare.

Another way to view the impact of debt on the economy is to look at what “debt-free” economic growth would be. In other words, without debt, there has been no organic economic growth.

The economic deficit has never been more significant. For the 30 years from 1952 to 1982, the economic surplus fostered a rising economic growth rate, which averaged roughly 8% during that period. Such is why the Federal Reserve has found itself in a “liquidity trap.”
Interest rates MUST remain low, and debt MUST grow faster than the economy, just to keep the economy from stalling out.
The deterioration of economic growth is seen more clearly in the chart below.
From 1947 to 2008, the U.S. economy had real, inflation-adjusted economic growth than had a linear growth trend of 3.2%.
However, following the 2008 recession, the growth rate dropped to the exponential growth trend of roughly 2.2%. Unfortunately, instead of reducing outstanding debt problems, the Federal Reserve provided policies that fostered even greater unproductive debt and leverage levels.

Coming out of the 2020 recession, the economic trend of growth will be somewhere between 1.5% and 1.75%. Given the amount of debt added to the overall system, the ongoing debt service will continue to retard economic growth.
A Permanent Loss
As noted by Zerohedge, the permanent loss in output in the U.S. was shown by BofA previously. The bank laid out the pre-COVID trend growth and compared it to its base case recovery.

Such aligns closely with our analysis shown above. Given the permanent loss in output and rising unproductive debt levels, the recovery will be slower and more protracted than those hoping for a “V-shaped” recovery. The “Nike Swoosh,” while more realistic, might be overly optimistic as well.
However, this is the most critical point.
The U.S. economy will never return to either its long-term linear or exponential growth trends.
Read that again.
Pulling Forward Consumption Isn’t Sustainable.
If you read between the lines, policymakers are “spit-balling” solutions and making potentially erroneous monetary policy decisions on unreliable data.
However, the “trap” that lawmakers, along with the Fed, have now fallen into is that “stimulus” only pulls forward “future consumption.” As we saw after the initial CARES act, as soon as financial supports evaporated, so did economic growth.
The hope over the last decade was the economy would eventually “catch fire” grow organically. Such would allow Central Banks to reverse monetary supports. However, such has never occurred. Each time Central Banks reduce monetary supports, the economy stalls or worse.
It is likely that “something has gone wrong” for the Federal Reserve. The ability to pull-forward future consumption through monetary interventions has been reached. Despite ongoing hopes of “higher growth rates” in the future, such will likely not be the case until the debt overhang gets cleared.
We will likely remain constrained in the “spurt and sputter” growth cycle we have witnessed since 2009. We will continue to see volatile equity market returns and a stagflationary environment as wages remain suppressed while costs of living rise.
Due to the debt, demographics, and monetary and fiscal policy failures, the long-term economic growth rate will run well below long-term trends.
Such will ensure the widening of the wealth gap, increases in welfare dependency, and capitalism giving way to socialism.
The post Why The Second Stimulus Won’t Have Much Economic Impact appeared first on RIA.
recession unemployment pandemic covid-19 stimulus economic growth monetary policy fed federal reserve congress trump gdp recovery interest rates unemployment stimulusGovernment
Low Iron Levels In Blood Could Trigger Long COVID: Study
Low Iron Levels In Blood Could Trigger Long COVID: Study
Authored by Amie Dahnke via The Epoch Times (emphasis ours),
People with inadequate…
Share this:


Authored by Amie Dahnke via The Epoch Times (emphasis ours),
People with inadequate iron levels in their blood due to a COVID-19 infection could be at greater risk of long COVID.
A new study indicates that problems with iron levels in the bloodstream likely trigger chronic inflammation and other conditions associated with the post-COVID phenomenon. The findings, published on March 1 in Nature Immunology, could offer new ways to treat or prevent the condition.
Long COVID Patients Have Low Iron Levels
Researchers at the University of Cambridge pinpointed low iron as a potential link to long-COVID symptoms thanks to a study they initiated shortly after the start of the pandemic. They recruited people who tested positive for the virus to provide blood samples for analysis over a year, which allowed the researchers to look for post-infection changes in the blood. The researchers looked at 214 samples and found that 45 percent of patients reported symptoms of long COVID that lasted between three and 10 months.
In analyzing the blood samples, the research team noticed that people experiencing long COVID had low iron levels, contributing to anemia and low red blood cell production, just two weeks after they were diagnosed with COVID-19. This was true for patients regardless of age, sex, or the initial severity of their infection.
According to one of the study co-authors, the removal of iron from the bloodstream is a natural process and defense mechanism of the body.
But it can jeopardize a person’s recovery.
“When the body has an infection, it responds by removing iron from the bloodstream. This protects us from potentially lethal bacteria that capture the iron in the bloodstream and grow rapidly. It’s an evolutionary response that redistributes iron in the body, and the blood plasma becomes an iron desert,” University of Oxford professor Hal Drakesmith said in a press release. “However, if this goes on for a long time, there is less iron for red blood cells, so oxygen is transported less efficiently affecting metabolism and energy production, and for white blood cells, which need iron to work properly. The protective mechanism ends up becoming a problem.”
The research team believes that consistently low iron levels could explain why individuals with long COVID continue to experience fatigue and difficulty exercising. As such, the researchers suggested iron supplementation to help regulate and prevent the often debilitating symptoms associated with long COVID.
“It isn’t necessarily the case that individuals don’t have enough iron in their body, it’s just that it’s trapped in the wrong place,” Aimee Hanson, a postdoctoral researcher at the University of Cambridge who worked on the study, said in the press release. “What we need is a way to remobilize the iron and pull it back into the bloodstream, where it becomes more useful to the red blood cells.”
The research team pointed out that iron supplementation isn’t always straightforward. Achieving the right level of iron varies from person to person. Too much iron can cause stomach issues, ranging from constipation, nausea, and abdominal pain to gastritis and gastric lesions.
1 in 5 Still Affected by Long COVID
COVID-19 has affected nearly 40 percent of Americans, with one in five of those still suffering from symptoms of long COVID, according to the U.S. Centers for Disease Control and Prevention (CDC). Long COVID is marked by health issues that continue at least four weeks after an individual was initially diagnosed with COVID-19. Symptoms can last for days, weeks, months, or years and may include fatigue, cough or chest pain, headache, brain fog, depression or anxiety, digestive issues, and joint or muscle pain.
Government
Walmart joins Costco in sharing key pricing news
The massive retailers have both shared information that some retailers keep very close to the vest.
Share this:

As we head toward a presidential election, the presumed candidates for both parties will look for issues that rally undecided voters.
The economy will be a key issue, with Democrats pointing to job creation and lowering prices while Republicans will cite the layoffs at Big Tech companies, high housing prices, and of course, sticky inflation.
The covid pandemic created a perfect storm for inflation and higher prices. It became harder to get many items because people getting sick slowed down, or even stopped, production at some factories.
Related: Popular mall retailer shuts down abruptly after bankruptcy filing
It was also a period where demand increased while shipping, trucking and delivery systems were all strained or thrown out of whack. The combination led to product shortages and higher prices.
You might have gone to the grocery store and not been able to buy your favorite paper towel brand or find toilet paper at all. That happened partly because of the supply chain and partly due to increased demand, but at the end of the day, it led to higher prices, which some consumers blamed on President Joe Biden's administration.
Biden, of course, was blamed for the price increases, but as inflation has dropped and grocery prices have fallen, few companies have been up front about it. That's probably not a political choice in most cases. Instead, some companies have chosen to lower prices more slowly than they raised them.
However, two major retailers, Walmart (WMT) and Costco, have been very honest about inflation. Walmart Chief Executive Doug McMillon's most recent comments validate what Biden's administration has been saying about the state of the economy. And they contrast with the economic picture being painted by Republicans who support their presumptive nominee, Donald Trump.
Image source: Joe Raedle/Getty Images
Walmart sees lower prices
McMillon does not talk about lower prices to make a political statement. He's communicating with customers and potential customers through the analysts who cover the company's quarterly-earnings calls.
During Walmart's fiscal-fourth-quarter-earnings call, McMillon was clear that prices are going down.
"I'm excited about the omnichannel net promoter score trends the team is driving. Across countries, we continue to see a customer that's resilient but looking for value. As always, we're working hard to deliver that for them, including through our rollbacks on food pricing in Walmart U.S. Those were up significantly in Q4 versus last year, following a big increase in Q3," he said.
He was specific about where the chain has seen prices go down.
"Our general merchandise prices are lower than a year ago and even two years ago in some categories, which means our customers are finding value in areas like apparel and hard lines," he said. "In food, prices are lower than a year ago in places like eggs, apples, and deli snacks, but higher in other places like asparagus and blackberries."
McMillon said that in other areas prices were still up but have been falling.
"Dry grocery and consumables categories like paper goods and cleaning supplies are up mid-single digits versus last year and high teens versus two years ago. Private-brand penetration is up in many of the countries where we operate, including the United States," he said.
Costco sees almost no inflation impact
McMillon avoided the word inflation in his comments. Costco (COST) Chief Financial Officer Richard Galanti, who steps down on March 15, has been very transparent on the topic.
The CFO commented on inflation during his company's fiscal-first-quarter-earnings call.
"Most recently, in the last fourth-quarter discussion, we had estimated that year-over-year inflation was in the 1% to 2% range. Our estimate for the quarter just ended, that inflation was in the 0% to 1% range," he said.
Galanti made clear that inflation (and even deflation) varied by category.
"A bigger deflation in some big and bulky items like furniture sets due to lower freight costs year over year, as well as on things like domestics, bulky lower-priced items, again, where the freight cost is significant. Some deflationary items were as much as 20% to 30% and, again, mostly freight-related," he added.
bankruptcy pandemic trumpGovernment
Walmart has really good news for shoppers (and Joe Biden)
The giant retailer joins Costco in making a statement that has political overtones, even if that’s not the intent.
Share this:

As we head toward a presidential election, the presumed candidates for both parties will look for issues that rally undecided voters.
The economy will be a key issue, with Democrats pointing to job creation and lowering prices while Republicans will cite the layoffs at Big Tech companies, high housing prices, and of course, sticky inflation.
The covid pandemic created a perfect storm for inflation and higher prices. It became harder to get many items because people getting sick slowed down, or even stopped, production at some factories.
Related: Popular mall retailer shuts down abruptly after bankruptcy filing
It was also a period where demand increased while shipping, trucking and delivery systems were all strained or thrown out of whack. The combination led to product shortages and higher prices.
You might have gone to the grocery store and not been able to buy your favorite paper towel brand or find toilet paper at all. That happened partly because of the supply chain and partly due to increased demand, but at the end of the day, it led to higher prices, which some consumers blamed on President Joe Biden's administration.
Biden, of course, was blamed for the price increases, but as inflation has dropped and grocery prices have fallen, few companies have been up front about it. That's probably not a political choice in most cases. Instead, some companies have chosen to lower prices more slowly than they raised them.
However, two major retailers, Walmart (WMT) and Costco, have been very honest about inflation. Walmart Chief Executive Doug McMillon's most recent comments validate what Biden's administration has been saying about the state of the economy. And they contrast with the economic picture being painted by Republicans who support their presumptive nominee, Donald Trump.
Image source: Joe Raedle/Getty Images
Walmart sees lower prices
McMillon does not talk about lower prices to make a political statement. He's communicating with customers and potential customers through the analysts who cover the company's quarterly-earnings calls.
During Walmart's fiscal-fourth-quarter-earnings call, McMillon was clear that prices are going down.
"I'm excited about the omnichannel net promoter score trends the team is driving. Across countries, we continue to see a customer that's resilient but looking for value. As always, we're working hard to deliver that for them, including through our rollbacks on food pricing in Walmart U.S. Those were up significantly in Q4 versus last year, following a big increase in Q3," he said.
He was specific about where the chain has seen prices go down.
"Our general merchandise prices are lower than a year ago and even two years ago in some categories, which means our customers are finding value in areas like apparel and hard lines," he said. "In food, prices are lower than a year ago in places like eggs, apples, and deli snacks, but higher in other places like asparagus and blackberries."
McMillon said that in other areas prices were still up but have been falling.
"Dry grocery and consumables categories like paper goods and cleaning supplies are up mid-single digits versus last year and high teens versus two years ago. Private-brand penetration is up in many of the countries where we operate, including the United States," he said.
Costco sees almost no inflation impact
McMillon avoided the word inflation in his comments. Costco (COST) Chief Financial Officer Richard Galanti, who steps down on March 15, has been very transparent on the topic.
The CFO commented on inflation during his company's fiscal-first-quarter-earnings call.
"Most recently, in the last fourth-quarter discussion, we had estimated that year-over-year inflation was in the 1% to 2% range. Our estimate for the quarter just ended, that inflation was in the 0% to 1% range," he said.
Galanti made clear that inflation (and even deflation) varied by category.
"A bigger deflation in some big and bulky items like furniture sets due to lower freight costs year over year, as well as on things like domestics, bulky lower-priced items, again, where the freight cost is significant. Some deflationary items were as much as 20% to 30% and, again, mostly freight-related," he added.
bankruptcy pandemic trump

When Military Rule Supplants Democracy


Redefining Poverty: Towards a Transpartisan Approach


The Digest #187


Biden to call for first-time homebuyer tax credit, construction of 2 million homes


GBPINR: Analysis and Projections for 2024


Students lose out as cities and states give billions in property tax breaks to businesses − draining school budgets and especially hurting the poorest students


Is the United States overestimating China’s power?


Biden defends immigration policy during State of the Union, blaming Republicans in Congress for refusing to act


Jack Smith Says Trump Retention Of Documents “Starkly Different” From Biden


Low Iron Levels In Blood Could Trigger Long COVID: Study
-

 Uncategorized2 weeks ago
All Of The Elements Are In Place For An Economic Crisis Of Staggering Proportions
-

 Uncategorized1 month ago
Cathie Wood sells a major tech stock (again)
-

 Uncategorized3 weeks ago
California Counties Could Be Forced To Pay $300 Million To Cover COVID-Era Program
-

 Uncategorized2 weeks ago
Apparel Retailer Express Moving Toward Bankruptcy
-

 Uncategorized3 weeks ago
Industrial Production Decreased 0.1% in January
-

 International1 day ago
Walmart launches clever answer to Target’s new membership program
-

 Uncategorized3 weeks ago
RFK Jr: The Wuhan Cover-Up & The Rise Of The Biowarfare-Industrial Complex
-

 Uncategorized3 weeks ago
GOP Efforts To Shore Up Election Security In Swing States Face Challenges