Which metro areas have fared better in the COVID-19 rebound?
At the onset of the COVID-19 pandemic in the United States in March 2020, the U.S. economy was riding the crest of a decade-long expansion. The Brookings…
Share this:

By Alan Berube, Eli Byerly-Duke
At the onset of the COVID-19 pandemic in the United States in March 2020, the U.S. economy was riding the crest of a decade-long expansion. The Brookings Metro Monitor found that from 2009 to 2019, 179 of the nation’s 191 largest metro areas had posted growth in jobs, adult employment rates, and median earnings. While that growth did not consistently close significant economic gaps by race and place, a tightening labor market in the late 2010s seemed to finally be spurring more inclusive outcomes in many metro areas.
That momentum dissipated nearly overnight. Between February and April 2020, the U.S. economy shed 22 million jobs—nearly 15% of total employment. Shortly thereafter, Brookings Metro began to track the local impacts of the pandemic economic crisis in our Metro Recovery Index. Over the succeeding 12 months, the Index revealed significant differences in the pace of the economic rebound across metro areas, with local trends in the labor market and other indicators of economic activity often tracking the ups and downs of successive COVID-19 waves.
Now, a little more than two years removed from the pandemic’s onset, we are revisiting the data to see whether metro area economies are truly back on their feet, even as their residents continue to navigate the effects of a persistent virus and the more recent challenge of inflation. While the data does not yet tell us much about who is benefiting—or not—from the recovery (e.g., by race, gender, age, or other demographic characteristics), it does indicate where the recovery has been stronger and weaker. The picture, as ever, remains mixed.
Most metro areas still have fewer jobs and higher unemployment than before the pandemic
The U.S. economy has posted a stronger, faster jobs recovery than almost anyone anticipated in the spring of 2020. Starting in May 2020, the economy added an average of nearly 900,000 jobs per month over the subsequent 22 months. Nevertheless, there were still 1.2 million fewer jobs economy-wide in March 2022 versus just prior to the pandemic—equivalent to a 0.8% decline.
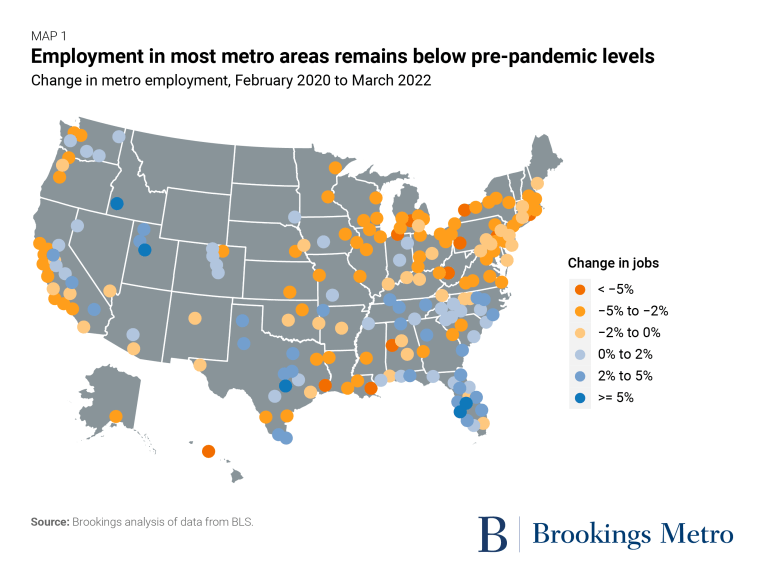
Not surprisingly, then, most of the nation’s largest metro areas still fall somewhat short of their pre-pandemic job totals (Map 1). Of 191 U.S. metro areas with populations of at least a quarter million, 121 (63%) had fewer jobs in March 2022 than in February 2020. In many of these metro areas, the jobs shortfall was relatively minor, similar to the national average. A dozen metro areas, however, had at least 5% fewer jobs than before the pandemic, including several in the Eastern Great Lakes area, and a couple (Honolulu and New Orleans) in which significant tourism sectors have not fully rebounded.
By the same token, there were a handful of metro areas that posted significant job gains over pre-pandemic levels. Most were in states whose economies and populations were growing quickly prior to the pandemic, such as Idaho, Florida, Texas, and Utah. Indeed, the rate of job growth a metro area experienced from 2010 to 2019 alone explained more than one-third of the variation in metro area job trends over the two-year recovery period.
However, patterns in metro area unemployment rates were quite different. Similar to the jobs trend, 116 metro areas (61%) overall had a higher unemployment rate in March 2022 than prior to the pandemic. However, the metro areas with the largest increases in unemployment included not only tourism-dependent economies (including Atlantic City, N.J. and Las Vegas, in addition to Honolulu and New Orleans), but also several in Texas. Texas metro areas were gaining working-age residents even as jobs increased, slowing the decline in local unemployment. By contrast, several metro areas in states such as Indiana, Minnesota, and Ohio, where jobs recovered more modestly, nonetheless experienced reductions in unemployment rates compared to pre-pandemic. This seemed to be because their labor forces grew more slowly—or in many cases, shrank—likely due to a mix of retirements, out-migration, and people dealing with sickness (such as long Covid) or caring for family members.
Trips to workplaces are still down everywhere, but retail vacancy has also dropped in many metro areas
In the early stages of the pandemic, mobility data from Google based on users’ geolocation data showed that fewer than half of workers in many metro areas were traveling to their usual place of work. Nearly anyone who could work from home did; only essential workers made daily trips to their workplaces, risking exposure to COVID-19 in the process. These rates of workplace visits began to rebound in many metro areas in the summer of 2020, as many cities and states reopened restaurants and entertainment venues.
Yet in metro areas with particularly large populations of office workers, trips to workplaces were slower to rebound, and remain well below pre-pandemic levels given the persistence of the virus and growing trends in remote/hybrid work. Not one of the 192 metro areas we analyzed had met or exceeded their January 2020 levels of workplace visits (Map 2). Yet that deficit ranged widely, from just 3% in Ocala, Fla. to 33% in the San Francisco Bay Area. In several other tech capitals—Boston, Los Angeles, New York, San Diego, San Jose, Calif., and Seattle—workplace visits were down at least 25%, reflecting what may be a permanent reduction in the prevalence of office work in tech industries. At the other extreme, a range of midsized metro areas around the country had workplace visits in March 2022 that neared pre-pandemic levels. This may indicate that these regions have relatively fewer office jobs that can be performed remotely, or a stronger cultural leaning toward in-person work.

Notwithstanding the across-the-board decline in regular workplace visits, retail vacancy rates in most metro areas (113 of 192, or 59%) are at least somewhat below their pre-pandemic levels. Many of these metro areas, particularly midsized ones, experienced a small initial rise in vacancies after the pandemic’s onset, which has since abated. Of the metro areas experiencing significant increases in retail vacancies, several are college towns—Ann Arbor, Mich.; Boulder, Colo.; College Station, Texas; Lansing-East Lansing, Mich.; and Santa Cruz, Calif.—in which the extended absence of students seems to have resulted in permanent business closures and challenges for landlords seeking to re-lease those properties.
To be sure, the metro-wide figures tracked here tend to mask trends in big-metro submarkets—particularly, highly impacted central business districts. The often-cited Kastle Back to Work Barometer still shows only 43% office occupancy in the 10 cities where Kastle’s clients’ buildings are most highly concentrated. Many tech capitals are beginning to confront the need to rethink the role and design of their downtowns, which for the foreseeable future seem unlikely to serve as large a commuter class as they did before the pandemic.
Rents and home prices are up nearly everywhere from pre-pandemic levels
In stark contrast to the Great Recession, which brought—and was brought on by—a crash in home prices, the pandemic recession fueled a run-up in residential real estate prices. Households sought more space as they stayed home more, took advantage of exceedingly low borrowing costs, moved to new locales for remote work, and/or repurposed savings once reserved for travel and entertainment to acquire more square footage.
The upshot: Prices for homes and apartments rose nearly everywhere, albeit by varying degrees. The median listing price for homes was higher in March 2022 than March 2020 in 169 of 192 metro areas (88%), and the median apartment rent was higher in 146 of 148 metro areas (99%) for which data is available.
Median home listing prices skyrocketed by 40% or more in metro areas, including second home/retirement destinations (several in Florida alone), secondary metro areas just outside large tech capitals (e.g., Bridgeport, Conn. outside New York; and Salinas, Calif. outside San Jose), and emerging hubs for tech growth and remote work (e.g., Austin, Texas; Boise; and Huntsville, Ala.) (Map 3). The small handful of metro areas where home prices declined since the pandemic’s onset were mainly places with older industrial economies in the Midwest (e.g., Cleveland, Detroit, Milwaukee, and Toledo, Ohio) and South (e.g., Birmingham, Ala.; Memphis, Tenn.; and Roanoke, Va.).

Rents also jumped significantly in Florida metro areas, as well as in a wider set of Sun Belt destinations such as Albuquerque, N.M.; Asheville and Greensboro, N.C.; Killeen-Temple and Waco, Texas; Phoenix and Tucson, Ariz.; and Riverside, Calif. By contrast, rents plateaued or even dropped slightly in some of the largest metro areas where tech and professional services jobs dominate: Boston, Chicago, Minneapolis-St. Paul, San Jose, San Francisco, Seattle, and Washington, D.C. Several of these ranked among the regions experiencing the largest domestic out-migration during the first year of the pandemic, which appears to have alleviated the pressure on several previously overheating rental markets.
Both home listing price and rental price trends in metro areas tracked closely with job trends; where jobs rebounded most strongly, price increases tended to follow.

Toward convergence, or divergence?
Two years on from COVID-19’s outbreak in the United States, our metro areas exhibit a wide spectrum of economic recovery. It remains to be seen, though, whether their diverse experiences will eventually narrow economic gaps across our places, further expand them, or leave us somewhere in between.
On the one hand, the pandemic has greatly impacted some of America’s most economically prosperous regions. “Superstar” metro areas such as Boston, New York, the San Francisco Bay Area, Seattle, and Washington, D.C. have not posted strong job recoveries, their office workers have not returned in large numbers, and their rental markets have softened considerably. While there is understandable concern about what all this means for their continued ability to spur innovation and national growth, these regions could undoubtedly stand to become more affordable and accessible. Meanwhile, regions that have rebounded more strongly while remaining somewhat more affordable—such as Atlanta, Dallas-Fort Worth, Raleigh-Durham, and Utah’s Wasatch Front—could yet become more prominent drivers of national prosperity in the pandemic’s wake.
On the other hand, the two years since COVID-19’s onset do not appear to have fundamentally altered the long-standing uphill battle for growth and prosperity in much of the nation’s heartland. Many of the same metro areas that were growing slowly before the pandemic—in regions such as the Great Lakes, Appalachia and the Piedmont, and the older industrial Northeast—continue to do so today. Their unemployment rates remain low mainly because they are losing working-age residents. Their downtowns, many of which were beginning to show new signs of life just before the pandemic, confront a difficult road ahead. These regions are most in need of a national response that invests in a broader geographic distribution of innovation-led, inclusive economic growth, through initiatives such as the Economic Development Administration’s Build Back Better Regional Challenge, the National Science Foundation’s Regional Innovation Engines program, and the proposed regional technology hub program in the U.S. Innovation and Competition Act.
With potentially choppier economic waters ahead, the pace and character of our nation’s diverse metro area recovery bear continued monitoring and national policy responses.
recession unemployment pandemic covid-19 economic recovery economic growth real estate recession recovery unemployment
Uncategorized
Key shipping company files for Chapter 11 bankruptcy
The Illinois-based general freight trucking company filed for Chapter 11 bankruptcy to reorganize.
Share this:


The U.S. trucking industry has had a difficult beginning of the year for 2024 with several logistics companies filing for bankruptcy to seek either a Chapter 7 liquidation or Chapter 11 reorganization.
The Covid-19 pandemic caused a lot of supply chain issues for logistics companies and also created a shortage of truck drivers as many left the business for other occupations. Shipping companies, in the meantime, have had extreme difficulty recruiting new drivers for thousands of unfilled jobs.
Related: Tesla rival’s filing reveals Chapter 11 bankruptcy is possible
Freight forwarder company Boateng Logistics joined a growing list of shipping companies that permanently shuttered their businesses as the firm on Feb. 22 filed for Chapter 7 bankruptcy with plans to liquidate.
The Carlsbad, Calif., logistics company filed its petition in the U.S. Bankruptcy Court for the Southern District of California listing assets up to $50,000 and and $1 million to $10 million in liabilities. Court papers said it owed millions of dollars in liabilities to trucking, logistics and factoring companies. The company filed bankruptcy before any creditors could take legal action.
Lawsuits force companies to liquidate in bankruptcy
Lawsuits, however, can force companies to file bankruptcy, which was the case for J.J. & Sons Logistics of Clint, Texas, which on Jan. 22 filed for Chapter 7 liquidation in the U.S. Bankruptcy Court for the Western District of Texas. The company filed bankruptcy four days before the scheduled start of a trial for a wrongful death lawsuit filed by the family of a former company truck driver who had died from drowning in 2016.
California-based logistics company Wise Choice Trans Corp. shut down operations and filed for Chapter 7 liquidation on Jan. 4 in the U.S. Bankruptcy Court for the Northern District of California, listing $1 million to $10 million in assets and liabilities.
The Hayward, Calif., third-party logistics company, founded in 2009, provided final mile, less-than-truckload and full truckload services, as well as warehouse and fulfillment services in the San Francisco Bay Area.
The Chapter 7 filing also implemented an automatic stay against all legal proceedings, as the company listed its involvement in four legal actions that were ongoing or concluded. Court papers reportedly did not list amounts for damages.
In some cases, debtors don't have to take a drastic action, such as a liquidation, and can instead file a Chapter 11 reorganization.
Shutterstock
Nationwide Cargo seeks to reorganize its business
Nationwide Cargo Inc., a general freight trucking company that also hauls fresh produce and meat, filed for Chapter 11 bankruptcy protection in the U.S. Bankruptcy Court for the Northern District of Illinois with plans to reorganize its business.
The East Dundee, Ill., shipping company listed $1 million to $10 million in assets and $10 million to $50 million in liabilities in its petition and said funds will not be available to pay unsecured creditors. The company operates with 183 trucks and 171 drivers, FreightWaves reported.
Nationwide Cargo's three largest secured creditors in the petition were Equify Financial LLC (owed about $3.5 million,) Commercial Credit Group (owed about $1.8 million) and Continental Bank NA (owed about $676,000.)
The shipping company reported gross revenue of about $34 million in 2022 and about $40 million in 2023. From Jan. 1 until its petition date, the company generated $9.3 million in gross revenue.
Related: Veteran fund manager picks favorite stocks for 2024
bankruptcy pandemic covid-19 stocksUncategorized
Key shipping company files Chapter 11 bankruptcy
The Illinois-based general freight trucking company filed for Chapter 11 bankruptcy to reorganize.
Share this:

The U.S. trucking industry has had a difficult beginning of the year for 2024 with several logistics companies filing for bankruptcy to seek either a Chapter 7 liquidation or Chapter 11 reorganization.
The Covid-19 pandemic caused a lot of supply chain issues for logistics companies and also created a shortage of truck drivers as many left the business for other occupations. Shipping companies, in the meantime, have had extreme difficulty recruiting new drivers for thousands of unfilled jobs.
Related: Tesla rival’s filing reveals Chapter 11 bankruptcy is possible
Freight forwarder company Boateng Logistics joined a growing list of shipping companies that permanently shuttered their businesses as the firm on Feb. 22 filed for Chapter 7 bankruptcy with plans to liquidate.
The Carlsbad, Calif., logistics company filed its petition in the U.S. Bankruptcy Court for the Southern District of California listing assets up to $50,000 and and $1 million to $10 million in liabilities. Court papers said it owed millions of dollars in liabilities to trucking, logistics and factoring companies. The company filed bankruptcy before any creditors could take legal action.
Lawsuits force companies to liquidate in bankruptcy
Lawsuits, however, can force companies to file bankruptcy, which was the case for J.J. & Sons Logistics of Clint, Texas, which on Jan. 22 filed for Chapter 7 liquidation in the U.S. Bankruptcy Court for the Western District of Texas. The company filed bankruptcy four days before the scheduled start of a trial for a wrongful death lawsuit filed by the family of a former company truck driver who had died from drowning in 2016.
California-based logistics company Wise Choice Trans Corp. shut down operations and filed for Chapter 7 liquidation on Jan. 4 in the U.S. Bankruptcy Court for the Northern District of California, listing $1 million to $10 million in assets and liabilities.
The Hayward, Calif., third-party logistics company, founded in 2009, provided final mile, less-than-truckload and full truckload services, as well as warehouse and fulfillment services in the San Francisco Bay Area.
The Chapter 7 filing also implemented an automatic stay against all legal proceedings, as the company listed its involvement in four legal actions that were ongoing or concluded. Court papers reportedly did not list amounts for damages.
In some cases, debtors don't have to take a drastic action, such as a liquidation, and can instead file a Chapter 11 reorganization.
Shutterstock
Nationwide Cargo seeks to reorganize its business
Nationwide Cargo Inc., a general freight trucking company that also hauls fresh produce and meat, filed for Chapter 11 bankruptcy protection in the U.S. Bankruptcy Court for the Northern District of Illinois with plans to reorganize its business.
The East Dundee, Ill., shipping company listed $1 million to $10 million in assets and $10 million to $50 million in liabilities in its petition and said funds will not be available to pay unsecured creditors. The company operates with 183 trucks and 171 drivers, FreightWaves reported.
Nationwide Cargo's three largest secured creditors in the petition were Equify Financial LLC (owed about $3.5 million,) Commercial Credit Group (owed about $1.8 million) and Continental Bank NA (owed about $676,000.)
The shipping company reported gross revenue of about $34 million in 2022 and about $40 million in 2023. From Jan. 1 until its petition date, the company generated $9.3 million in gross revenue.
Related: Veteran fund manager picks favorite stocks for 2024
bankruptcy pandemic covid-19 stocksUncategorized
Tight inventory and frustrated buyers challenge agents in Virginia
With inventory a little more than half of what it was pre-pandemic, agents are struggling to find homes for clients in Virginia.
Share this:

No matter where you are in the state, real estate agents in Virginia are facing low inventory conditions that are creating frustrating scenarios for their buyers.
“I think people are getting used to the interest rates where they are now, but there is just a huge lack of inventory,” said Chelsea Newcomb, a RE/MAX Realty Specialists agent based in Charlottesville. “I have buyers that are looking, but to find a house that you love enough to pay a high price for — and to be at over a 6.5% interest rate — it’s just a little bit harder to find something.”
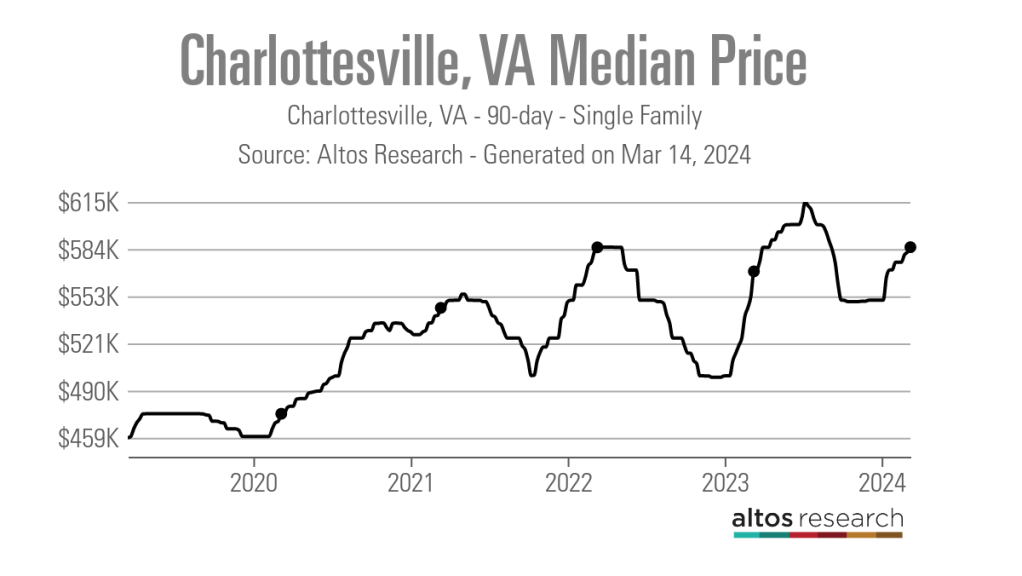
Newcomb said that interest rates and higher prices, which have risen by more than $100,000 since March 2020, according to data from Altos Research, have caused her clients to be pickier when selecting a home.
“When rates and prices were lower, people were more willing to compromise,” Newcomb said.
Out in Wise, Virginia, near the westernmost tip of the state, RE/MAX Cavaliers agent Brett Tiller and his clients are also struggling to find suitable properties.
“The thing that really stands out, especially compared to two years ago, is the lack of quality listings,” Tiller said. “The slightly more upscale single-family listings for move-up buyers with children looking for their forever home just aren’t coming on the market right now, and demand is still very high.”
Statewide, Virginia had a 90-day average of 8,068 active single-family listings as of March 8, 2024, down from 14,471 single-family listings in early March 2020 at the onset of the COVID-19 pandemic, according to Altos Research. That represents a decrease of 44%.

In Newcomb’s base metro area of Charlottesville, there were an average of only 277 active single-family listings during the same recent 90-day period, compared to 892 at the onset of the pandemic. In Wise County, there were only 56 listings.
Due to the demand from move-up buyers in Tiller’s area, the average days on market for homes with a median price of roughly $190,000 was just 17 days as of early March 2024.
“For the right home, which is rare to find right now, we are still seeing multiple offers,” Tiller said. “The demand is the same right now as it was during the heart of the pandemic.”
According to Tiller, the tight inventory has caused homebuyers to spend up to six months searching for their new property, roughly double the time it took prior to the pandemic.
For Matt Salway in the Virginia Beach metro area, the tight inventory conditions are creating a rather hot market.
“Depending on where you are in the area, your listing could have 15 offers in two days,” the agent for Iron Valley Real Estate Hampton Roads | Virginia Beach said. “It has been crazy competition for most of Virginia Beach, and Norfolk is pretty hot too, especially for anything under $400,000.”
According to Altos Research, the Virginia Beach-Norfolk-Newport News housing market had a seven-day average Market Action Index score of 52.44 as of March 14, making it the seventh hottest housing market in the country. Altos considers any Market Action Index score above 30 to be indicative of a seller’s market.

Further up the coastline on the vacation destination of Chincoteague Island, Long & Foster agent Meghan O. Clarkson is also seeing a decent amount of competition despite higher prices and interest rates.
“People are taking their time to actually come see things now instead of buying site unseen, and occasionally we see some seller concessions, but the traffic and the demand is still there; you might just work a little longer with people because we don’t have anything for sale,” Clarkson said.
“I’m busy and constantly have appointments, but the underlying frenzy from the height of the pandemic has gone away, but I think it is because we have just gotten used to it.”
While much of the demand that Clarkson’s market faces is for vacation homes and from retirees looking for a scenic spot to retire, a large portion of the demand in Salway’s market comes from military personnel and civilians working under government contracts.
“We have over a dozen military bases here, plus a bunch of shipyards, so the closer you get to all of those bases, the easier it is to sell a home and the faster the sale happens,” Salway said.
Due to this, Salway said that existing-home inventory typically does not come on the market unless an employment contract ends or the owner is reassigned to a different base, which is currently contributing to the tight inventory situation in his market.
Things are a bit different for Tiller and Newcomb, who are seeing a decent number of buyers from other, more expensive parts of the state.
“One of the crazy things about Louisa and Goochland, which are kind of like suburbs on the western side of Richmond, is that they are growing like crazy,” Newcomb said. “A lot of people are coming in from Northern Virginia because they can work remotely now.”
With a Market Action Index score of 50, it is easy to see why people are leaving the Washington-Arlington-Alexandria market for the Charlottesville market, which has an index score of 41.
In addition, the 90-day average median list price in Charlottesville is $585,000 compared to $729,900 in the D.C. area, which Newcomb said is also luring many Virginia homebuyers to move further south.

“They are very accustomed to higher prices, so they are super impressed with the prices we offer here in the central Virginia area,” Newcomb said.
For local buyers, Newcomb said this means they are frequently being outbid or outpriced.
“A couple who is local to the area and has been here their whole life, they are just now starting to get their mind wrapped around the fact that you can’t get a house for $200,000 anymore,” Newcomb said.
As the year heads closer to spring, triggering the start of the prime homebuying season, agents in Virginia feel optimistic about the market.
“We are seeing seasonal trends like we did up through 2019,” Clarkson said. “The market kind of soft launched around President’s Day and it is still building, but I expect it to pick right back up and be in full swing by Easter like it always used to.”
But while they are confident in demand, questions still remain about whether there will be enough inventory to support even more homebuyers entering the market.
“I have a lot of buyers starting to come off the sidelines, but in my office, I also have a lot of people who are going to list their house in the next two to three weeks now that the weather is starting to break,” Newcomb said. “I think we are going to have a good spring and summer.”
real estate housing market pandemic covid-19 interest rates

IFM’s Hat Trick and Reflections On Option-To-Buy M&A


Key shipping company files for Chapter 11 bankruptcy


Q4 Update: Delinquencies, Foreclosures and REO


Net Zero, The Digital Panopticon, & The Future Of Food


Pharma industry reputation remains steady at a ‘new normal’ after Covid, Harris Poll finds


These Cities Have The Highest (And Lowest) Share Of Unaffordable Neighborhoods In 2024


For-profit nursing homes are cutting corners on safety and draining resources with financial shenanigans − especially at midsize chains that dodge public scrutiny


Trump nearly derailed democracy once − here’s what to watch out for in reelection campaign


Part 1: Current State of the Housing Market; Overview for mid-March 2024


Tight inventory and frustrated buyers challenge agents in Virginia
-

 Uncategorized3 weeks ago
All Of The Elements Are In Place For An Economic Crisis Of Staggering Proportions
-

 International7 days ago
EyePoint poaches medical chief from Apellis; Sandoz CFO, longtime BioNTech exec to retire
-

 Uncategorized4 weeks ago
California Counties Could Be Forced To Pay $300 Million To Cover COVID-Era Program
-

 Uncategorized3 weeks ago
Apparel Retailer Express Moving Toward Bankruptcy
-

 Uncategorized4 weeks ago
Industrial Production Decreased 0.1% in January
-

 International7 days ago
Walmart launches clever answer to Target’s new membership program
-

 Uncategorized4 weeks ago
RFK Jr: The Wuhan Cover-Up & The Rise Of The Biowarfare-Industrial Complex
-
Spread & Containment2 days ago
IFM’s Hat Trick and Reflections On Option-To-Buy M&A