WHEELING, W.Va., April 26, 2022 /PRNewswire/ -- WesBanco, Inc. ("WesBanco") (Nasdaq: WSBC), a diversified, multi-state bank holding company, today announced net income and related earnings per share for the three months ended March 31, 2022. Net income available to common shareholders for the first quarter of 2022 was $41.6 million, with diluted earnings per share of $0.68, compared to $70.6 million and $1.05 per diluted share, respectively, for the first quarter of 2021. The first quarter of 2021 was favorably impacted by a negative provision of $22.1 million (net of tax) under the Current Expected Credit Losses ("CECL") methodology. Net income available to common shareholders, excluding after-tax restructuring and merger-related expenses, for the three months ended March 31, 2022, was $42.9 million, or $0.70 per diluted share, as compared to $71.3 million and $1.06 per diluted share, respectively, in the prior year quarter (non-GAAP measures).
|
|
| For the Three Months Ended March 31,
|
|
|
| 2022
|
| 2021
|
(unaudited, dollars in thousands,
except per share amounts)
|
| Net Income
|
| Diluted
Earnings
Per Share
|
| Net Income
|
| Diluted
Earnings
Per Share
|
Net income available to common shareholders (Non-GAAP)(1)
|
| $ 42,851
|
| $ 0.70
|
| $ 71,256
|
| $ 1.06
|
Less: After-tax restructuring and merger-related expenses
|
| (1,258)
|
| (0.02)
|
| (672)
|
| (0.01)
|
Net income available to common shareholders (GAAP)
|
| $ 41,593
|
| $ 0.68
|
| $ 70,584
|
| $ 1.05
|
|
(1) See non-GAAP financial measures for additional information relating to the calculation of these items.
|
Financial and operational highlights during the quarter ended March 31, 2022:
- Sequential quarter total loan growth improved by 0.9%, or 3.6% annualized, when excluding Small Business Administration Payroll Protection Program ("SBA PPP") loans
- Successful execution on our strategy to seek additional long-term growth opportunities through the opening of loan production offices in Nashville and Indianapolis
- Deposit growth, excluding certificates of deposit ("CDs"), was 7.3% year-over-year, driven by growth in demand deposits and savings accounts
- Successful execution of a Tier 2 capital raise, through the public offering of $150 million of ten-year fixed-to-floating rate subordinated debt
- During the quarter, we continued to return capital to our shareholders as we purchased approximately 1.7 million shares of our common stock on the open market under existing share repurchase authorizations
- Key credit quality metrics such as non-performing assets, past due loans, criticized and classified loans, and net loan charge-offs, as percentages of total portfolio loans, have remained at low levels and favorable to peer bank averages, those with total assets between $10 billion and $25 billion (based upon the prior four quarters)
- WesBanco continues to be acknowledged for its strong financial performance and employee focus as it was recognized by Forbes as both one of America's Best Banks and Best Midsize Employers – the only midsize bank making the top ten of both rankings. In addition, WesBanco was also named one of the World's Best Banks by Forbes, as well as one of America's Most Trustworthy Companies by Newsweek
"We are pleased with WesBanco's performance during the first quarter of 2022," said Todd F. Clossin, President and Chief Executive Officer of WesBanco. "We exhibited strong expense management as our operating expenses were roughly consistent with the year ago period. Furthermore, we continued our efforts of returning capital to our shareholders. We also demonstrated annualized organic loan growth of 3.6% quarter-over-quarter, despite still elevated commercial real estate payoffs, due to the efforts of our seasoned lending teams. We believe their efforts will be enhanced by our new loan production offices in the Nashville and Indianapolis areas."
Mr. Clossin added, "Most importantly, we are proud of our entire organization as our employees adhered to our community banking roots by focusing on providing top-tier service to our customers. Their efforts allowed us to be recognized by Forbes as one of the best banks in America, based on financial performance, as well as one of the best banks in the world, based on customer services. Further, our employees voted us one of America's best mid-sized employers reflecting our efforts to create an environment where they are supported and positioned to succeed. In fact, we were the only mid-sized bank in the country to receive honors for both employee satisfaction and financial success. Lastly, the combination of all our efforts and these great accolades, allowed us to be recognized as one of America's Most Trustworthy Companies by Newsweek."
Balance Sheet
Loan growth for the first quarter of 2022 reflects the continuation of both SBA PPP loan forgiveness and elevated commercial real estate payoffs, partially offset by efforts to keep more 1-to-4 family residential mortgages on the balance sheet, as well as sequential quarter commercial loan growth. As of March 31, 2022, total portfolio loans of $9.7 billion, when excluding SBA Payroll Protection Program ("SBA PPP") loans, increased 0.9%, or 3.6% annualized, when compared to December 31, 2021. In particular, commercial and industrial loans, excluding SBA PPP loans, for the first quarter increased $8.9 million, or 2.5% annualized, from December 31, 2021. Furthermore, the first quarter of 2022 included forgiveness of approximately 867 SBA PPP loans totaling $86 million (net of deferred fees). As of March 31, 2022, approximately 1,085 SBA PPP loans for $77 million remained in the loan portfolio.
As of March 31, 2022, total deposits were $13.8 billion, which increased both sequentially and year-over-year due primarily to increased personal savings, which more than offset a $344.1 million year-over-year reduction in CDs. Deposits, excluding CDs, increased 7.3% year-over-year, driven by a 6.5% increase in total demand deposits, which represent approximately 59% of total deposits, as well as a 12.9% increase in savings accounts.
Credit Quality
As of March 31, 2022, total loans past due, non-performing loans, and non-performing assets as percentages of the loan portfolio and total assets have remained relatively low and consistent throughout the last five quarters. In addition, criticized and classified loans as a percent of the loan portfolio decreased 58 basis points year-over-year to 3.68%. For the first quarter, net loan charge-offs to average loans were immaterial at zero basis points. The allowance for credit losses specific to total portfolio loans at March 31, 2022 was $117.9 million, or 1.21% of total loans. The improvement in macroeconomic forecasts was the primary driver in a negative provision for credit losses of $3.4 million for the first quarter of 2022.
Net Interest Margin and Income
The net interest margin of 2.95% for the first quarter of 2022 decreased 2 basis points sequentially and 32 basis points from the first quarter of 2021, primarily due to the lower interest rate environment of the past year before the recent federal fund and market rate increases, and a shift to a higher level of securities as a percentage of total assets. As a result of increased cash balances from our customers' higher personal savings, investment securities increased by $0.5 billion year-over-year and, as of March 31, 2022, represented approximately 24% of total assets. Reflecting the continued low interest rate environment, we remain focused on controlling the costs of our various funding sources. We have reduced deposit funding costs 8 basis points year-over-year to 12 basis points for the first quarter of 2022, or just 8 basis points when including non-interest bearing deposits. When including our continued reductions in FHLB and other borrowings, the cost of total interest-bearing liabilities decreased 18 basis points year-over-year to 19 basis points. Accretion from acquisitions benefited the first quarter net interest margin by 8 basis points, as compared to 13 basis points in the prior year period. Lastly, the forgiveness of SBA PPP loans benefited the first quarter of 2022 net interest margin by a net 7 basis points, as compared to a net 11 basis points in the prior year period.
Net interest income decreased $8.8 million, or 7.5%, during the first quarter of 2022, as compared to the same quarter of 2021, reflecting lower loan yields due to repricing of existing loans and lower new offered rates in the current market environment, lower accretion from purchase accounting and lower SBA PPP-related loan income, partially offset by lower interest paid on deposits and borrowings as described above.
Non-Interest Income
For the first quarter of 2022, non-interest income of $30.4 million decreased $2.8 million, or 8.5%, from the first quarter of 2021, driven primarily by lower swap fee income and associated fair value adjustments located within other income, which combined decreased $3.0 million from the prior year period, and lower mortgage banking income, which decreased $2.3 million year-over-year. Bank-owned life insurance of $3.9 million increased $2.2 million year-over-year due to higher death benefits of $1.9 million and the impact of new policies purchased during the third quarter of 2021. Reflective of macroeconomic improvements and increased general consumer spending, service charges on deposits increased $1.2 million year-over-year to $6.1 million and electronic banking fees rose $1.0 million year-over-year to $5.3 million. Mortgage banking income was lower due to our continued efforts to retain more residential mortgages on the balance sheet, which totaled 75% of originations compared to 40% last year, and lower originations during the quarter. Residential mortgage originations of $271 million were lower both year-over-year and quarter-over-quarter due to general market trends reflective of the rising rate environment.
Non-Interest Expense
Excluding restructuring and merger-related expenses, non-interest expense for the three months ended March 31, 2022 was well-controlled as they increased $0.5 million, or 0.6%, to $86.0 million compared to the prior year period. Salaries and wages increased $2.0 million, or 5.5%, compared to the prior year period due to lower deferred loan origination costs and higher salary expense related to normal merit increases and the hourly wage increase that we implemented last year. As compared to the fourth quarter, salaries and wages were down due primarily to the lower day count during the first quarter of 2022, which reduced these expenses by approximately $0.9 million. Employee benefits expense decreased mostly due to market fluctuations on the deferred compensation plan, which reduced expense by $0.9 million, as well as lower pension and health insurance expenses. Equipment and software expense for the first quarter of 2022 increased $1.2 million, or 18.4% year-over-year due primarily to the movement of online banking costs from other operating expenses. Other operating expenses decreased $1.7 million, or 9.8%, due to the aforementioned move of online banking costs, as well as a reduction in ACH and ATM processing charges related to a change in providers, in conjunction with last summer's core banking software system conversion. Lastly, as part of our on-going branch optimization strategy, we recognized restructuring charges of $1.6 million during the first quarter associated with the anticipated closure of 11 locations during June.
Capital
WesBanco continues to maintain what we believe are strong regulatory capital ratios, as both consolidated and bank-level regulatory capital ratios are well above the applicable "well-capitalized" standards promulgated by bank regulators and the BASEL III capital standards. At March 31, 2022, Tier I leverage was 9.67%, Tier I risk-based capital ratio was 13.25%, common equity Tier 1 capital ratio ("CET 1") was 12.01%, and total risk-based capital was 16.32%.
During the first quarter of 2022, WesBanco issued, through a public offering, $150 million of ten-year fixed-to-floating rate subordinated debt, which qualifies as Tier 2 capital and is reflected in the March 31, 2022 regulatory capital ratios. Additionally, WesBanco repurchased 1.7 million shares of its outstanding common stock on the open market at a total cost of $62.3 million, or $36.11 per share. As of March 31, 2022, approximately 2.9 million shares remained for repurchase under the existing share repurchase authorization that was approved on February 24, 2022, by WesBanco's Board of Directors.
Conference Call and Webcast
WesBanco will host a conference call to discuss the Company's financial results for the first quarter of 2022 at 10:00 a.m. ET on Wednesday, April 27, 2022. Interested parties can access the live webcast of the conference call through the Investor Relations section of the Company's website, www.wesbanco.com. Participants can also listen to the conference call by dialing 888-347-6607, 855-669-9657 for Canadian callers, or 412-902-4290 for international callers, and asking to be joined into the WesBanco call.
A replay of the conference call will be available by dialing 877-344-7529, 855-669-9658 for Canadian callers, or 412-317-0088 for international callers, and providing the access code of 10162191. The replay will begin at approximately 12:00 p.m. ET on April 27, and end at 12 a.m. ET on May 11. An archive of the webcast will be available for one year on the Investor Relations section of the Company's website (www.wesbanco.com).
Forward-Looking Statements
Forward-looking statements in this report relating to WesBanco's plans, strategies, objectives, expectations, intentions and adequacy of resources, are made pursuant to the safe harbor provisions of the Private Securities Litigation Reform Act of 1995. The information contained in this report should be read in conjunction with WesBanco's Form 10-K for the year ended December 31, 2021 and documents subsequently filed by WesBanco with the Securities and Exchange Commission ("SEC") which are available at the SEC's website, www.sec.gov or at WesBanco's website, www.WesBanco.com. Investors are cautioned that forward-looking statements, which are not historical fact, involve risks and uncertainties, including those detailed in WesBanco's most recent Annual Report on Form 10-K filed with the SEC under "Risk Factors" in Part I, Item 1A. Such statements are subject to important factors that could cause actual results to differ materially from those contemplated by such statements, including, without limitation, the effects of changing regional and national economic conditions including the effects of the COVID-19 pandemic; changes in interest rates, spreads on earning assets and interest-bearing liabilities, and associated interest rate sensitivity; sources of liquidity available to WesBanco and its related subsidiary operations; potential future credit losses and the credit risk of commercial, real estate, and consumer loan customers and their borrowing activities; actions of the Federal Reserve Board, the Federal Deposit Insurance Corporation, the Consumer Financial Protection Bureau, the SEC, the Financial Institution Regulatory Authority, the Municipal Securities Rulemaking Board, the Securities Investors Protection Corporation, and other regulatory bodies; potential legislative and federal and state regulatory actions and reform, including, without limitation, the impact of the implementation of the Dodd-Frank Act; adverse decisions of federal and state courts; fraud, scams and schemes of third parties; cyber-security breaches; competitive conditions in the financial services industry; rapidly changing technology affecting financial services; marketability of debt instruments and corresponding impact on fair value adjustments; and/or other external developments materially impacting WesBanco's operational and financial performance. WesBanco does not assume any duty to update forward-looking statements.
Non-GAAP Financial Measures
In addition to the results of operations presented in accordance with Generally Accepted Accounting Principles (GAAP), WesBanco's management uses, and this presentation contains or references, certain non-GAAP financial measures, such as pre-tax pre-provision income, tangible common equity/tangible assets; net income excluding after-tax restructuring and merger-related expenses; efficiency ratio; return on average assets; and return on average tangible equity. WesBanco believes these financial measures provide information useful to investors in understanding our operational performance and business and performance trends which facilitate comparisons with the performance of others in the financial services industry. Although WesBanco believes that these non-GAAP financial measures enhance investors' understanding of WesBanco's business and performance, these non-GAAP financial measures should not be considered an alternative to GAAP. The non-GAAP financial measures contained therein should be read in conjunction with the audited financial statements and analysis as presented in the Annual Report on Form 10-K as well as the unaudited financial statements and analyses as presented in the Quarterly Reports on Forms 10-Q for WesBanco and its subsidiaries, as well as other filings that the company has made with the SEC.
About WesBanco, Inc.
Founded in 1870, WesBanco, Inc. (www.wesbanco.com) is a diversified and balanced financial services company that delivers large bank capabilities with a community bank feel. Our distinct long-term growth strategies are built upon unique sustainable advantages permitting us to span six states with meaningful market share. Built upon our 'Better Banking Pledge', our customer-centric service culture is focused on growing long-term relationships by pledging to serve all personal and business customer needs efficiently and effectively. Furthermore, our strong financial performance and employee focus has earned us recognition by Forbes as both one of America's Best Banks and Best Midsize Employers – the only midsize bank making the top ten of both rankings. In addition to a full range of online and mobile banking options and a full-suite of commercial products and services, WesBanco provides trust, wealth management, securities brokerage, and private banking services through our century-old Trust and Investment Services department, with approximately $5.4 billion of assets under management (as of March 31, 2022). WesBanco's banking subsidiary, WesBanco Bank, Inc., operates 205 financial centers in the states of Indiana, Kentucky, Maryland, Ohio, Pennsylvania, and West Virginia. Additionally, WesBanco operates an insurance agency, WesBanco Insurance Services, Inc., and a full service broker/dealer, WesBanco Securities, Inc.
WESBANCO, INC.
|
|
|
|
|
|
|
|
Consolidated Selected Financial Highlights
|
|
|
|
|
| Page 5
|
|
(unaudited, dollars in thousands, except shares and per share amounts)
|
|
|
|
|
|
|
|
|
|
|
|
|
|
|
|
|
| For the Three Months Ended
|
|
Statement of Income
|
| March 31,
|
|
Interest and dividend income
|
| 2022
|
| 2021
|
| % Change
|
|
| Loans, including fees
|
| $ 93,121
|
| $ 109,358
|
| (14.8)
|
|
| Interest and dividends on securities:
|
|
|
|
|
|
|
|
|
| Taxable
|
| 14,112
|
| 11,127
|
| 26.8
|
|
|
| Tax-exempt
|
| 4,344
|
| 3,910
|
| 11.1
|
|
|
|
| Total interest and dividends on securities
|
| 18,456
|
| 15,037
|
| 22.7
|
|
| Other interest income
|
| 597
|
| 659
|
| (9.4)
|
|
Total interest and dividend income
|
| 112,174
|
| 125,054
|
| (10.3)
|
|
Interest expense
|
|
|
|
|
|
|
|
| Interest bearing demand deposits
|
| 811
|
| 1,043
|
| (22.2)
|
|
| Money market deposits
|
| 321
|
| 578
|
| (44.5)
|
|
| Savings deposits
|
| 264
|
| 264
|
| -
|
|
| Certificates of deposit
|
| 1,273
|
| 2,370
|
| (46.3)
|
|
|
|
| Total interest expense on deposits
|
| 2,669
|
| 4,255
|
| (37.3)
|
|
| Federal Home Loan Bank borrowings
|
| 575
|
| 2,414
|
| (76.2)
|
|
| Other short-term borrowings
|
| 48
|
| 118
|
| (59.3)
|
|
| Subordinated debt and junior subordinated debt
|
| 1,171
|
| 1,789
|
| (34.5)
|
|
|
|
| Total interest expense
|
| 4,463
|
| 8,576
|
| (48.0)
|
|
Net interest income
|
| 107,711
|
| 116,478
|
| (7.5)
|
|
| Provision for credit losses
|
| (3,438)
|
| (27,958)
|
| 87.7
|
|
Net interest income after provision for credit losses
|
| 111,149
|
| 144,436
|
| (23.0)
|
|
Non-interest income
|
|
|
|
|
|
|
|
| Trust fees
|
| 7,835
|
| 7,631
|
| 2.7
|
|
| Service charges on deposits
|
| 6,090
|
| 4,894
|
| 24.4
|
|
| Electronic banking fees
|
| 5,345
|
| 4,365
|
| 22.5
|
|
| Net securities brokerage revenue
|
| 2,220
|
| 1,524
|
| 45.7
|
|
| Bank-owned life insurance
|
| 3,881
|
| 1,709
|
| 127.1
|
|
| Mortgage banking income
|
| 1,923
|
| 4,264
|
| (54.9)
|
|
| Net securities (losses)/gains
|
| (650)
|
| 279
|
| (333.0)
|
|
| Net (loss)/gain on other real estate owned and other assets
|
| (806)
|
| 175
|
| (560.6)
|
|
| Other income
|
| 4,544
|
| 8,367
|
| (45.7)
|
|
|
|
| Total non-interest income
|
| 30,382
|
| 33,208
|
| (8.5)
|
|
Non-interest expense
|
|
|
|
|
|
|
|
| Salaries and wages
|
| 38,937
|
| 36,890
|
| 5.5
|
|
| Employee benefits
|
| 9,158
|
| 10,266
|
| (10.8)
|
|
| Net occupancy
|
| 7,234
|
| 7,177
|
| 0.8
|
|
| Equipment and software
|
| 8,011
|
| 6,765
|
| 18.4
|
|
| Marketing
|
| 2,421
|
| 2,384
|
| 1.6
|
|
| FDIC insurance
|
| 1,522
|
| 1,282
|
| 18.7
|
|
| Amortization of intangible assets
|
| 2,598
|
| 2,896
|
| (10.3)
|
|
| Restructuring and merger-related expense
|
| 1,593
|
| 851
|
| 87.2
|
|
| Other operating expenses
|
| 16,074
|
| 17,816
|
| (9.8)
|
|
|
|
| Total non-interest expense
|
| 87,548
|
| 86,327
|
| 1.4
|
|
Income before provision for income taxes
|
| 53,983
|
| 91,317
|
| (40.9)
|
|
| Provision for income taxes
|
| 9,859
|
| 18,202
|
| (45.8)
|
|
Net Income
|
| 44,124
|
| 73,115
|
| (39.7)
|
|
Preferred stock dividends
|
| 2,531
|
| 2,531
|
| -
|
|
Net income available to common shareholders
|
| $ 41,593
|
| $ 70,584
|
| (41.1)
|
|
|
|
|
|
|
|
|
|
|
|
|
|
|
|
|
|
|
|
|
|
|
|
Taxable equivalent net interest income
|
| $ 108,866
|
| $ 117,517
|
| (7.4)
|
|
|
|
|
|
|
|
|
|
|
|
|
Per common share data
|
|
|
|
|
|
|
|
Net income per common share - basic
|
| $ 0.68
|
| $ 1.05
|
| (35.2)
|
|
Net income per common share - diluted
|
| 0.68
|
| 1.05
|
| (35.2)
|
|
Net income per common share - diluted, excluding certain items (1)(2)
|
| 0.70
|
| 1.06
|
| (34.0)
|
|
Dividends declared
|
| 0.34
|
| 0.33
|
| 3.0
|
|
Book value (period end)
|
| 39.64
|
| 39.25
|
| 1.0
|
|
Tangible book value (period end) (1)
|
| 20.87
|
| 22.21
|
| (6.0)
|
|
Average common shares outstanding - basic
|
| 61,445,399
|
| 67,263,714
|
| (8.7)
|
|
Average common shares outstanding - diluted
|
| 61,593,365
|
| 67,355,418
|
| (8.6)
|
|
Period end common shares outstanding
|
| 60,613,414
|
| 67,282,134
|
| (9.9)
|
|
Period end preferred shares outstanding
|
| 150,000
|
| 150,000
|
| -
|
|
|
|
|
|
|
|
|
|
|
|
|
(1) See non-GAAP financial measures for additional information relating to the calculation of this item.
|
|
(2) Certain items excluded from the calculation consist of after-tax restructuring and merger-related expenses.
|
|
|
|
|
|
|
|
|
|
|
|
|
|
|
|
|
|
|
|
|
|
|
|
WESBANCO, INC.
|
|
|
|
|
|
|
|
|
|
|
|
|
|
Consolidated Selected Financial Highlights
|
|
|
|
|
|
|
|
|
|
|
|
| Page 6
|
(unaudited, dollars in thousands)
|
|
|
|
|
|
|
|
|
|
|
|
|
|
|
|
|
|
|
|
|
|
|
|
|
|
|
|
Selected ratios
|
|
|
|
|
|
|
|
|
|
|
|
|
|
|
| For the Three Months Ended
|
|
|
|
|
| March 31,
|
|
|
|
|
| 2022
|
| 2021
|
| % Change
|
|
|
|
|
|
|
|
|
|
|
|
|
|
|
|
|
|
|
|
|
|
Return on average assets
|
| 0.99
| %
| 1.72
| %
| (42.44)
| %
|
|
|
|
|
|
|
Return on average assets, excluding
|
|
|
|
|
|
|
|
|
|
|
|
|
|
after-tax restructuring and merger-related expenses (1)
|
| 1.02
|
| 1.74
|
| (41.38)
|
|
|
|
|
|
|
|
Return on average equity
|
| 6.35
|
| 10.33
|
| (38.53)
|
|
|
|
|
|
|
|
Return on average equity, excluding
|
|
|
|
|
|
|
|
|
|
|
|
|
|
after-tax restructuring and merger-related expenses (1)
|
| 6.54
|
| 10.43
|
| (37.30)
|
|
|
|
|
|
|
|
Return on average tangible equity (1)
|
| 11.67
|
| 18.22
|
| (35.95)
|
|
|
|
|
|
|
|
Return on average tangible equity, excluding
|
|
|
|
|
|
|
|
|
|
|
|
|
|
after-tax restructuring and merger-related expenses (1)
|
| 12.01
|
| 18.39
|
| (34.69)
|
|
|
|
|
|
|
|
Return on average tangible common equity (1)
|
| 12.90
|
| 20.00
|
| (35.50)
|
|
|
|
|
|
|
|
Return on average tangible common equity, excluding
|
|
|
|
|
|
|
|
|
|
|
|
|
|
after-tax restructuring and merger-related expenses (1)
|
| 13.27
|
| 20.18
|
| (34.24)
|
|
|
|
|
|
|
|
Yield on earning assets (2)
|
| 3.07
|
| 3.51
|
| (12.54)
|
|
|
|
|
|
|
|
Cost of interest bearing liabilities
|
| 0.19
|
| 0.37
|
| (48.65)
|
|
|
|
|
|
|
|
Net interest spread (2)
|
| 2.88
|
| 3.14
|
| (8.28)
|
|
|
|
|
|
|
|
Net interest margin (2)
|
| 2.95
|
| 3.27
|
| (9.79)
|
|
|
|
|
|
|
|
Efficiency (1) (2)
|
| 61.73
|
| 56.71
|
| 8.85
|
|
|
|
|
|
|
|
Average loans to average deposits
|
| 71.05
|
| 85.27
|
| (16.68)
|
|
|
|
|
|
|
|
Annualized net loan charge-offs/average loans
|
| 0.00
|
| 0.02
|
| (100.00)
|
|
|
|
|
|
|
|
Effective income tax rate
|
| 18.26
|
| 19.93
|
| (8.38)
|
|
|
|
|
|
|
|
|
|
|
|
|
|
|
|
|
|
|
|
|
|
|
|
|
|
|
|
|
|
|
|
|
|
|
|
|
|
|
|
|
|
|
|
|
|
|
|
|
|
|
|
|
|
|
|
|
|
|
|
|
|
|
|
|
| For the Three Months Ended
|
|
|
|
|
| Mar. 31,
|
| Dec. 31,
|
| Sept. 30,
|
| June 30,
|
| Mar. 31,
|
|
|
|
|
| 2022
|
| 2021
|
| 2021
|
| 2021
|
| 2021
|
|
|
|
|
|
|
|
|
|
|
|
|
|
|
|
|
|
Return on average assets
|
| 0.99
| %
| 1.21
| %
| 0.97
| %
| 1.60
| %
| 1.72
| %
|
|
|
Return on average assets, excluding
|
|
|
|
|
|
|
|
|
|
|
|
|
|
after-tax restructuring and merger-related expenses (1)
|
| 1.02
|
| 1.21
|
| 1.06
|
| 1.62
|
| 1.74
|
|
|
|
Return on average equity
|
| 6.35
|
| 7.56
|
| 5.98
|
| 9.74
|
| 10.33
|
|
|
|
Return on average equity, excluding
|
|
|
|
|
|
|
|
|
|
|
|
|
|
after-tax restructuring and merger-related expenses (1)
|
| 6.54
|
| 7.58
|
| 6.49
|
| 9.88
|
| 10.43
|
|
|
|
Return on average tangible equity (1)
|
| 11.67
|
| 13.62
|
| 10.72
|
| 17.04
|
| 18.22
|
|
|
|
Return on average tangible equity, excluding
|
|
|
|
|
|
|
|
|
|
|
|
|
|
after-tax restructuring and merger-related expenses (1)
|
| 12.01
|
| 13.66
|
| 11.57
|
| 17.27
|
| 18.39
|
|
|
|
Return on average tangible common equity (1)
|
| 12.90
|
| 15.00
|
| 11.76
|
| 18.67
|
| 20.00
|
|
|
|
Return on average tangible common equity, excluding
|
|
|
|
|
|
|
|
|
|
|
|
|
|
after-tax restructuring and merger-related expenses (1)
|
| 13.27
|
| 15.04
|
| 12.70
|
| 18.92
|
| 20.18
|
|
|
|
Yield on earning assets (2)
|
| 3.07
|
| 3.10
|
| 3.24
|
| 3.32
|
| 3.51
|
|
|
|
Cost of interest bearing liabilities
|
| 0.19
|
| 0.20
|
| 0.25
|
| 0.31
|
| 0.37
|
|
|
|
Net interest spread (2)
|
| 2.88
|
| 2.90
|
| 2.99
|
| 3.01
|
| 3.14
|
|
|
|
Net interest margin (2)
|
| 2.95
|
| 2.97
|
| 3.08
|
| 3.12
|
| 3.27
|
|
|
|
Efficiency (1) (2)
|
| 61.73
|
| 61.99
|
| 60.52
|
| 53.97
|
| 56.71
|
|
|
|
Average loans to average deposits
|
| 71.05
|
| 72.61
|
| 75.46
|
| 79.82
|
| 85.27
|
|
|
|
Annualized net loan charge-offs and recoveries /average loans
| 0.00
|
| 0.04
|
| 0.03
|
| (0.03)
|
| 0.02
|
|
|
|
Effective income tax rate
|
| 18.26
|
| 18.32
|
| 19.34
|
| 20.85
|
| 19.93
|
|
|
|
Trust assets, market value at period end
|
| $ 5,412,342
|
| $ 5,644,975
|
| $ 5,464,159
|
| $ 5,480,995
|
| $ 5,244,370
|
|
|
|
|
|
|
|
|
|
|
|
|
|
|
|
|
|
(1) See non-GAAP financial measures for additional information relating to the calculation of this item.
|
|
|
|
(2) The yield on earning assets, net interest margin, net interest spread and efficiency ratios are presented on a fully taxable-equivalent (FTE) and annualized basis. The FTE basis adjusts for the tax benefit of income on certain tax-exempt loans and investments. WesBanco believes this measure to be the preferred industry measurement of net interest income and provides a relevant comparison between taxable and non-taxable amounts.
|
|
WESBANCO, INC.
|
|
|
|
|
|
|
|
|
Consolidated Selected Financial Highlights
|
|
|
|
|
|
|
| Page 7
|
(unaudited, dollars in thousands, except shares)
|
|
|
|
|
|
|
| % Change
|
Balance sheet
|
| March 31,
|
|
| December 31,
| December 31, 2021
|
Assets
|
|
| 2022
|
| 2021
|
| % Change
| 2021
| to March 31, 2022
|
Cash and due from banks
|
| $ 200,513
|
| $ 209,040
|
| (4.1)
| $ 157,046
| 27.7
|
Due from banks - interest bearing
|
| 1,168,985
|
| 550,008
|
| 112.5
| 1,094,312
| 6.8
|
Securities:
|
|
|
|
|
|
|
|
|
| Equity securities, at fair value
|
| 12,757
|
| 13,123
|
| (2.8)
| 13,466
| (5.3)
|
| Available-for-sale debt securities, at fair value
|
| 2,911,373
|
| 2,775,212
|
| 4.9
| 3,013,462
| (3.4)
|
| Held-to-maturity debt securities (fair values of $1,092,993; $839,872
|
|
|
|
|
|
|
|
|
| and $1,028,452, respectively)
|
| 1,157,202
|
| 813,740
|
| 42.2
| 1,004,823
| 15.2
|
|
| Allowance for credit losses, held-to-maturity debt securities
|
| (285)
|
| (290)
|
| 1.7
| (268)
| (6.3)
|
| Net held-to-maturity debt securities
|
| 1,156,917
|
| 813,450
|
| 42.2
| 1,004,555
| 15.2
|
|
| Total securities
|
| 4,081,047
|
| 3,601,785
|
| 13.3
| 4,031,483
| 1.2
|
Loans held for sale
|
| 15,959
|
| 153,520
|
| (89.6)
| 25,277
| (36.9)
|
Portfolio loans:
|
|
|
|
|
|
|
|
|
| Commercial real estate
|
| 5,580,082
|
| 5,712,742
|
| (2.3)
| 5,538,968
| 0.7
|
| Commercial and industrial
|
| 1,513,078
|
| 2,422,735
|
| (37.5)
| 1,590,320
| (4.9)
|
| Residential real estate
|
| 1,767,064
|
| 1,644,422
|
| 7.5
| 1,721,378
| 2.7
|
| Home equity
|
| 592,872
|
| 634,018
|
| (6.5)
| 605,682
| (2.1)
|
| Consumer
|
| 280,176
|
| 289,395
|
| (3.2)
| 277,130
| 1.1
|
Total portfolio loans, net of unearned income
|
| 9,733,272
|
| 10,703,312
|
| (9.1)
| 9,733,478
| (0.0)
|
Allowance for credit losses - loans
|
| (117,865)
|
| (160,040)
|
| 26.4
| (121,622)
| 3.1
|
|
| Net portfolio loans
|
| 9,615,407
|
| 10,543,272
|
| (8.8)
| 9,611,856
| 0.0
|
Premises and equipment, net
|
| 219,907
|
| 239,863
|
| (8.3)
| 229,016
| (4.0)
|
Accrued interest receivable
|
| 60,370
|
| 68,896
|
| (12.4)
| 60,844
| (0.8)
|
Goodwill and other intangible assets, net
|
| 1,149,035
|
| 1,160,195
|
| (1.0)
| 1,151,634
| (0.2)
|
Bank-owned life insurance
|
| 348,179
|
| 307,747
|
| 13.1
| 350,359
| (0.6)
|
Other assets
|
| 244,613
|
| 223,462
|
| 9.5
| 215,298
| 13.6
|
Total Assets
|
| $ 17,104,015
|
| $ 17,057,788
|
| 0.3
| $ 16,927,125
| 1.0
|
|
|
|
|
|
|
|
|
|
|
|
Liabilities
|
|
|
|
|
|
|
|
|
Deposits:
|
|
|
|
|
|
|
|
|
| Non-interest bearing demand
|
| $ 4,670,520
|
| $ 4,460,049
|
| 4.7
| $ 4,590,895
| 1.7
|
| Interest bearing demand
|
| 3,405,610
|
| 3,126,186
|
| 8.9
| 3,380,056
| 0.8
|
| Money market
|
| 1,831,683
|
| 1,771,703
|
| 3.4
| 1,739,750
| 5.3
|
| Savings deposits
|
| 2,679,053
|
| 2,373,987
|
| 12.9
| 2,562,510
| 4.5
|
| Certificates of deposit
|
| 1,211,008
|
| 1,555,074
|
| (22.1)
| 1,292,652
| (6.3)
|
|
| Total deposits
|
| 13,797,874
|
| 13,286,999
|
| 3.8
| 13,565,863
| 1.7
|
Federal Home Loan Bank borrowings
|
| 123,898
|
| 433,984
|
| (71.5)
| 183,920
| (32.6)
|
Other short-term borrowings
|
| 158,538
|
| 137,218
|
| 15.5
| 141,893
| 11.7
|
Subordinated debt and junior subordinated debt
|
| 280,743
|
| 192,430
|
| 45.9
| 132,860
| 111.3
|
|
| Total borrowings
|
| 563,179
|
| 763,632
|
| (26.2)
| 458,673
| 22.8
|
Accrued interest payable
|
| 1,786
|
| 3,224
|
| (44.6)
| 1,901
| (6.0)
|
Other liabilities
|
| 193,860
|
| 218,411
|
| (11.2)
| 207,522
| (6.6)
|
Total Liabilities
|
| 14,556,699
|
| 14,272,266
|
| 2.0
| 14,233,959
| 2.3
|
|
|
|
|
|
|
|
|
|
|
|
Shareholders' Equity
|
|
|
|
|
|
|
|
|
Preferred stock, no par value; 1,000,000 shares authorized; 150,000 shares
|
|
|
|
|
|
|
|
|
| 6.75% non-cumulative perpetual preferred stock, Series A, liquidation
|
|
|
|
|
|
|
|
|
| preference $150.0 million, issued and outstanding, respectively
|
| 144,484
|
| 144,484
|
| -
| 144,484
| -
|
Common stock, $2.0833 par value; 100,000,000 shares authorized;
|
|
|
|
|
|
|
|
|
| 68,081,306 shares issued; 60,613,414, 67,282,134 and 62,307,245
|
|
|
|
|
|
|
|
|
| shares outstanding, respectively
|
| 141,834
|
| 141,834
|
| -
| 141,834
| -
|
Capital surplus
|
| 1,636,705
|
| 1,636,103
|
| 0.0
| 1,635,642
| 0.1
|
Retained earnings
|
| 998,315
|
| 879,786
|
| 13.5
| 977,765
| 2.1
|
Treasury stock (7,467,892, 799,172 and 5,774,061 shares - at cost, respectively)
|
| (261,012)
|
| (24,989)
|
| (944.5)
| (199,759)
| (30.7)
|
Accumulated other comprehensive (loss)/income
|
| (111,312)
|
| 9,803
|
| NM
| (5,120)
| NM
|
Deferred benefits for directors
|
| (1,698)
|
| (1,499)
|
| (13.3)
| (1,680)
| (1.1)
|
Total Shareholders' Equity
|
| 2,547,316
|
| 2,785,522
|
| (8.6)
| 2,693,166
| (5.4)
|
Total Liabilities and Shareholders' Equity
|
| $ 17,104,015
|
| $ 17,057,788
|
| 0.3
| $ 16,927,125
| 1.0
|
|
|
|
|
|
|
|
|
|
|
|
NM = Not Meaningful
|
|
|
|
|
|
|
|
|
WESBANCO, INC.
|
|
|
|
|
|
|
|
|
Consolidated Selected Financial Highlights
|
|
|
|
|
|
|
| Page 8
|
(unaudited, dollars in thousands)
|
|
|
|
|
|
|
|
|
Average balance sheet and
|
|
|
|
|
|
|
|
|
net interest margin analysis
|
| For the Three Months Ended March 31,
|
|
|
|
| 2022
| 2021
|
|
|
| Average
| Average
|
|
| Average
| Average
|
|
Assets
|
| Balance
| Rate
|
|
| Balance
| Rate
|
|
Due from banks - interest bearing
|
| $ 1,161,218
| 0.16
| %
|
| $ 776,245
| 0.09
| %
|
Loans, net of unearned income (1)
|
| 9,712,085
| 3.89
|
|
| 10,890,370
| 4.07
|
|
Securities: (2)
|
|
|
|
|
|
|
|
|
Taxable
|
| 3,333,379
| 1.72
|
|
| 2,306,320
| 1.96
|
|
Tax-exempt (3)
|
| 729,380
| 3.06
|
|
| 580,199
| 3.46
|
|
Total securities
|
| 4,062,759
| 1.96
|
|
| 2,886,519
| 2.26
|
|
Other earning assets
|
| 15,446
| 3.81
|
|
| 33,240
| 5.89
|
|
Total earning assets (3)
|
| 14,951,508
| 3.07
| %
|
| 14,586,374
| 3.51
| %
|
Other assets
|
| 2,041,090
|
|
|
| 2,049,884
|
|
|
Total Assets
|
| $ 16,992,598
|
|
|
| $ 16,636,258
|
|
|
|
|
|
|
|
|
|
|
|
Liabilities and Shareholders' Equity
|
|
|
|
|
|
|
|
|
Interest bearing demand deposits
|
| $ 3,403,499
| 0.10
| %
|
| $ 2,970,766
| 0.14
| %
|
Money market accounts
|
| 1,806,719
| 0.07
|
|
| 1,725,561
| 0.14
|
|
Savings deposits
|
| 2,626,962
| 0.04
|
|
| 2,290,657
| 0.05
|
|
Certificates of deposit
|
| 1,254,603
| 0.41
|
|
| 1,584,152
| 0.61
|
|
Total interest bearing deposits
|
| 9,091,783
| 0.12
|
|
| 8,571,136
| 0.20
|
|
Federal Home Loan Bank borrowings
|
| 180,024
| 1.30
|
|
| 488,388
| 2.00
|
|
Repurchase agreements
|
| 156,167
| 0.12
|
|
| 191,676
| 0.25
|
|
Subordinated debt and junior subordinated debt
|
| 147,709
| 3.22
|
|
| 192,341
| 3.77
|
|
Total interest bearing liabilities (4)
|
| 9,575,683
| 0.19
| %
|
| 9,443,541
| 0.37
| %
|
Non-interest bearing demand deposits
|
| 4,576,749
|
|
|
| 4,200,793
|
|
|
Other liabilities
|
| 184,359
|
|
|
| 221,508
|
|
|
Shareholders' equity
|
| 2,655,807
|
|
|
| 2,770,416
|
|
|
Total Liabilities and Shareholders' Equity
|
| $ 16,992,598
|
|
|
| $ 16,636,258
|
|
|
Taxable equivalent net interest spread
|
|
| 2.88
| %
|
|
| 3.14
| %
|
Taxable equivalent net interest margin
|
|
| 2.95
| %
|
|
| 3.27
| %
|
|
|
|
|
|
|
|
|
|
|
|
|
|
|
|
|
|
|
(1) Gross of allowance for loan losses and net of unearned income. Includes non-accrual and loans held for sale. Loan fees included in interest income on loans were $4.1 million and $8.2 million for the three months ended March 31, 2022 and 2021, respectively. PPP loan fees, which are included as part of the total loan fees were $3.2 million and $7.9 million for the three months ended March 31, 2022 and 2021, respectively. Additionally, loan accretion included in interest income on loans acquired from prior acquisitions was $2.5 million and $3.5 million for the three months ended March 31, 2022 and 2021, respectively.
|
(2) Average yields on available-for-sale securities are calculated based on amortized cost.
|
(3) Taxable equivalent basis is calculated on tax-exempt securities using a rate of 21% for each period presented.
|
(4) Accretion on interest bearing liabilities acquired from prior acquisitions was $0.4 million and $1.1 million for the three months ended March 31, 2022 and 2021, respectively.
|
WESBANCO, INC.
|
|
|
|
|
|
|
|
|
|
Consolidated Selected Financial Highlights
|
|
|
|
|
|
|
|
| Page 9
|
(unaudited, dollars in thousands, except shares and per share amounts)
|
|
|
|
|
|
|
|
|
|
|
|
|
| Quarter Ended
|
Statement of Income
| Mar. 31,
|
| Dec. 31,
|
| Sept. 30,
|
| June 30,
|
| Mar. 31,
|
Interest and dividend income
| 2022
|
| 2021
|
| 2021
|
| 2021
|
| 2021
|
| Loans, including fees
| $ 93,121
|
| $ 97,432
|
| $ 103,206
|
| $ 105,968
|
| $ 109,358
|
| Interest and dividends on securities:
|
|
|
|
|
|
|
|
|
|
|
| Taxable
| 14,112
|
| 12,934
|
| 13,481
|
| 12,900
|
| 11,127
|
|
| Tax-exempt
| 4,344
|
| 4,236
|
| 4,063
|
| 3,952
|
| 3,910
|
|
|
| Total interest and dividends on securities
| 18,456
|
| 17,170
|
| 17,544
|
| 16,852
|
| 15,037
|
| Other interest income
| 597
|
| 605
|
| 628
|
| 507
|
| 659
|
Total interest and dividend income
| 112,174
|
| 115,207
|
| 121,378
|
| 123,327
|
| 125,054
|
Interest expense
|
|
|
|
|
|
|
|
|
|
| Interest bearing demand deposits
| 811
|
| 810
|
| 815
|
| 1,009
|
| 1,043
|
| Money market deposits
| 321
|
| 315
|
| 350
|
| 551
|
| 578
|
| Savings deposits
| 264
|
| 261
|
| 244
|
| 261
|
| 264
|
| Certificates of deposit
| 1,273
|
| 1,501
|
| 1,726
|
| 2,026
|
| 2,370
|
|
|
| Total interest expense on deposits
| 2,669
|
| 2,887
|
| 3,135
|
| 3,847
|
| 4,255
|
| Federal Home Loan Bank borrowings
| 575
|
| 780
|
| 1,192
|
| 1,781
|
| 2,414
|
| Other short-term borrowings
| 48
|
| 35
|
| 33
|
| 40
|
| 118
|
| Subordinated debt and junior subordinated debt
| 1,171
|
| 1,178
|
| 1,743
|
| 1,804
|
| 1,789
|
|
|
| Total interest expense
| 4,463
|
| 4,880
|
| 6,103
|
| 7,472
|
| 8,576
|
Net interest income
| 107,711
|
| 110,327
|
| 115,275
|
| 115,855
|
| 116,478
|
| Provision for credit losses
| (3,438)
|
| (13,559)
|
| (1,730)
|
| (21,025)
|
| (27,958)
|
Net interest income after provision for credit losses
| 111,149
|
| 123,886
|
| 117,005
|
| 136,880
|
| 144,436
|
Non-interest income
|
|
|
|
|
|
|
|
|
|
| Trust fees
| 7,835
|
| 7,441
|
| 7,289
|
| 7,148
|
| 7,631
|
| Service charges on deposits
| 6,090
|
| 6,592
|
| 6,050
|
| 4,876
|
| 4,894
|
| Electronic banking fees
| 5,345
|
| 4,465
|
| 5,427
|
| 5,060
|
| 4,365
|
| Net securities brokerage revenue
| 2,220
|
| 1,579
|
| 1,965
|
| 1,829
|
| 1,524
|
| Bank-owned life insurance
| 3,881
|
| 2,864
|
| 2,656
|
| 1,707
|
| 1,709
|
| Mortgage banking income
| 1,923
|
| 2,872
|
| 4,563
|
| 7,830
|
| 4,264
|
| Net securities (losses)/gains
| (650)
|
| 372
|
| (15)
|
| 477
|
| 279
|
| Net (loss)/gain on other real estate owned and other assets
| (806)
|
| (158)
|
| 785
|
| 4,014
|
| 175
|
| Other income
| 4,544
|
| 4,682
|
| 4,035
|
| 3,171
|
| 8,367
|
|
|
| Total non-interest income
| 30,382
|
| 30,709
|
| 32,755
|
| 36,112
|
| 33,208
|
Non-interest expense
|
|
|
|
|
|
|
|
|
|
| Salaries and wages
| 38,937
|
| 40,420
|
| 39,497
|
| 37,435
|
| 36,890
|
| Employee benefits
| 9,158
|
| 10,842
|
| 10,658
|
| 9,268
|
| 10,266
|
| Net occupancy
| 7,234
|
| 6,413
|
| 6,825
|
| 6,427
|
| 7,177
|
| Equipment and software
| 8,011
|
| 8,352
|
| 7,609
|
| 7,281
|
| 6,765
|
| Marketing
| 2,421
|
| 2,601
|
| 1,848
|
| 1,802
|
| 2,384
|
| FDIC insurance
| 1,522
|
| 1,460
|
| 1,227
|
| 181
|
| 1,282
|
| Amortization of intangible assets
| 2,598
|
| 2,834
|
| 2,854
|
| 2,873
|
| 2,896
|
| Restructuring and merger-related expense
| 1,593
|
| 177
|
| 4,467
|
| 1,222
|
| 851
|
| Other operating expenses
| 16,074
|
| 15,204
|
| 19,716
|
| 17,323
|
| 17,816
|
|
|
| Total non-interest expense
| 87,548
|
| 88,303
|
| 94,701
|
| 83,812
|
| 86,327
|
Income before provision for income taxes
| 53,983
|
| 66,292
|
| 55,059
|
| 89,180
|
| 91,317
|
| Provision for income taxes
| 9,859
|
| 12,144
|
| 10,651
|
| 18,592
|
| 18,202
|
Net Income
| 44,124
|
| 54,148
|
| 44,408
|
| 70,588
|
| 73,115
|
Preferred stock dividends
| 2,531
|
| 2,531
|
| 2,531
|
| 2,531
|
| 2,531
|
Net income available to common shareholders
| $ 41,593
|
| $ 51,617
|
| $ 41,877
|
| $ 68,057
|
| $ 70,584
|
|
|
|
|
|
|
|
|
|
|
|
|
|
Taxable equivalent net interest income
| $ 108,866
|
| $ 111,453
|
| $ 116,355
|
| $ 116,906
|
| $ 117,517
|
|
|
|
|
|
|
|
|
|
|
|
|
|
Per common share data
|
|
|
|
|
|
|
|
|
|
Net income per common share - basic
| $ 0.68
|
| $ 0.82
|
| $ 0.64
|
| $ 1.02
|
| $ 1.05
|
Net income per common share - diluted
| 0.68
|
| 0.82
|
| 0.64
|
| 1.01
|
| 1.05
|
Net income per common share - diluted, excluding certain items (1)(2)
| 0.70
|
| 0.82
|
| 0.70
|
| 1.03
|
| 1.06
|
Dividends declared
| 0.34
|
| 0.33
|
| 0.33
|
| 0.33
|
| 0.33
|
Book value (period end)
| 39.64
|
| 40.91
|
| 40.41
|
| 39.96
|
| 39.25
|
Tangible book value (period end) (1)
| 20.87
|
| 22.61
|
| 22.51
|
| 22.61
|
| 22.21
|
Average common shares outstanding - basic
| 61,445,399
|
| 63,045,061
|
| 64,931,764
|
| 66,894,398
|
| 67,263,714
|
Average common shares outstanding - diluted
| 61,593,365
|
| 63,183,411
|
| 65,065,848
|
| 67,066,592
|
| 67,335,418
|
Period end common shares outstanding
| 60,613,414
|
| 62,307,245
|
| 63,838,549
|
| 65,970,149
|
| 67,282,134
|
Period end preferred shares outstanding
| 150,000
|
| 150,000
|
| 150,000
|
| 150,000
|
| 150,000
|
Full time equivalent employees
| 2,456
|
| 2,462
|
| 2,425
|
| 2,459
|
| 2,490
|
|
|
|
|
|
|
|
|
|
|
|
|
|
(1) See non-GAAP financial measures for additional information relating to the calculation of this item.
|
|
|
|
|
(2) Certain items excluded from the calculation consist of after-tax restructuring and merger-related expenses.
|
|
|
|
|
WESBANCO, INC.
|
|
|
|
|
|
|
|
|
|
|
Consolidated Selected Financial Highlights
|
|
|
|
|
|
|
|
|
| Page 10
|
(unaudited, dollars in thousands)
|
|
|
|
|
|
|
|
|
|
|
|
|
| Quarter Ended
|
|
|
|
| Mar. 31,
|
| Dec. 31,
|
| Sept. 30,
|
| June 30,
|
| Mar. 31,
|
|
Asset quality data
| 2022
|
| 2021
|
| 2021
|
| 2021
|
| 2021
|
|
Non-performing assets:
|
|
|
|
|
|
|
|
|
|
|
| Troubled debt restructurings - accruing
| $ 3,731
|
| $ 3,746
|
| $ 3,707
|
| $ 5,799
|
| $ 3,563
|
|
| Non-accrual loans:
|
|
|
|
|
|
|
|
|
|
|
|
| Troubled debt restructurings
| 1,348
|
| 1,547
|
| 1,615
|
| 1,664
|
| 1,768
|
|
|
| Other non-accrual loans
| 32,024
|
| 34,195
|
| 34,644
|
| 34,548
|
| 32,807
|
|
|
| Total non-accrual loans
| 33,372
|
| 35,742
|
| 36,259
|
| 36,212
|
| 34,575
|
|
|
| Total non-performing loans
| 37,103
|
| 39,488
|
| 39,966
|
| 42,011
|
| 38,138
|
|
| Other real estate and repossessed assets
| 87
|
| -
|
| 293
|
| 773
|
| 393
|
|
|
| Total non-performing assets
| $ 37,190
|
| $ 39,488
|
| $ 40,259
|
| $ 42,784
|
| $ 38,531
|
|
|
|
|
|
|
|
|
|
|
|
|
|
|
Past due loans (1):
|
|
|
|
|
|
|
|
|
|
|
| Loans past due 30-89 days
| $ 28,322
|
| $ 27,152
|
| $ 32,682
|
| $ 21,233
|
| $ 20,602
|
|
| Loans past due 90 days or more
| 6,142
|
| 7,804
|
| 11,252
|
| 8,318
|
| 12,824
|
|
|
| Total past due loans
| $ 34,464
|
| $ 34,956
|
| $ 43,934
|
| $ 29,551
|
| $ 33,426
|
|
|
|
|
|
|
|
|
|
|
|
|
|
|
Criticized and classified loans (2):
|
|
|
|
|
|
|
|
|
|
|
| Criticized loans
| $ 234,143
|
| $ 248,518
|
| $ 290,281
|
| $ 319,448
|
| $ 340,943
|
|
| Classified loans
| 123,837
|
| 116,013
|
| 127,022
|
| 136,927
|
| 114,884
|
|
|
| Total criticized and classified loans
| $ 357,980
|
| $ 364,531
|
| $ 417,303
|
| $ 456,375
|
| $ 455,827
|
|
|
|
|
|
|
|
|
|
|
|
|
|
|
Loans past due 30-89 days / total portfolio loans (3)
| 0.29
| %
| 0.28
| %
| 0.33
| %
| 0.21
| %
| 0.19
| %
|
Loans past due 90 days or more / total portfolio loans
| 0.06
|
| 0.08
|
| 0.11
|
| 0.08
|
| 0.12
|
|
Non-performing loans / total portfolio loans
| 0.38
|
| 0.41
|
| 0.40
|
| 0.41
|
| 0.36
|
|
Non-performing assets / total portfolio loans, other
|
|
|
|
|
|
|
|
|
|
|
| real estate and repossessed assets
| 0.38
|
| 0.41
|
| 0.41
|
| 0.41
|
| 0.36
|
|
Non-performing assets / total assets
| 0.22
|
| 0.23
|
| 0.24
|
| 0.25
|
| 0.23
|
|
Criticized and classified loans / total portfolio loans
| 3.68
|
| 3.75
|
| 4.21
|
| 4.41
|
| 4.26
|
|
|
|
|
|
|
|
|
|
|
|
|
|
|
Allowance for credit losses
|
|
|
|
|
|
|
|
|
|
|
Allowance for credit losses - loans
| $ 117,865
|
| $ 121,622
|
| $ 136,605
|
| $ 140,730
|
| $ 160,040
|
|
Allowance for credit losses - loan commitments
| 8,050
|
| 7,775
|
| 7,290
|
| 5,766
|
| 6,731
|
|
Provision for credit losses
| (3,438)
|
| (13,559)
|
| (1,730)
|
| (21,025)
|
| (27,958)
|
|
Net loan and deposit account overdraft charge-offs and recoveries
| 27
|
| 929
|
| 842
|
| (689)
|
| 648
|
|
|
|
|
|
|
|
|
|
|
|
|
|
|
Annualized net loan charge-offs and recoveries / average loans
| 0.00
| %
| 0.04
| %
| 0.03
| %
| (0.03)
| %
| 0.02
| %
|
Allowance for credit losses - loans / total portfolio loans
| 1.21
| %
| 1.25
| %
| 1.38
| %
| 1.36
| %
| 1.50
| %
|
Allowance for credit losses - loans / total portfolio loans excluding PPP loans
| 1.22
| %
| 1.27
| %
| 1.42
| %
| 1.43
| %
| 1.62
| %
|
Allowance for credit losses - loans / non-performing loans
| 3.18
| x
| 3.08
| x
| 3.42
| x
| 3.35
| x
| 4.20
| x
|
Allowance for credit losses - loans / non-performing loans and
|
|
|
|
|
|
|
|
|
|
|
| loans past due
| 1.65
| x
| 1.63
| x
| 1.63
| x
| 1.97
| x
| 2.24
| x
|
|
|
|
|
|
|
|
|
|
|
|
|
|
|
|
|
|
|
|
|
|
|
|
|
|
|
|
|
|
|
|
|
|
|
|
|
|
|
|
|
|
| Mar. 31,
|
| Dec. 31,
|
| Sept. 30,
|
| June 30,
|
| Mar. 31,
|
|
|
|
| 2022
|
| 2021
|
| 2021
|
| 2021
|
| 2021
|
|
Capital ratios
|
|
|
|
|
|
|
|
|
|
|
Tier I leverage capital
| 9.67
| %
| 10.02
| %
| 10.10
| %
| 10.42
| %
| 10.74
| %
|
Tier I risk-based capital
| 13.25
|
| 14.05
|
| 14.18
|
| 15.15
|
| 14.95
|
|
Total risk-based capital
| 16.32
|
| 15.91
|
| 16.38
|
| 17.68
|
| 17.58
|
|
Common equity tier 1 capital ratio (CET 1)
| 12.01
|
| 12.77
|
| 12.91
|
| 13.83
|
| 13.65
|
|
Average shareholders' equity to average assets
| 15.63
|
| 15.99
|
| 16.28
|
| 16.44
|
| 16.65
|
|
Tangible equity to tangible assets (4)
| 8.83
|
| 9.84
|
| 10.04
|
| 10.34
|
| 10.30
|
|
Tangible common equity to tangible assets (4)
| 7.92
|
| 8.92
|
| 9.12
|
| 9.43
|
| 9.39
|
|
|
|
|
|
|
|
|
|
|
|
|
|
|
|
|
|
|
|
|
|
|
|
|
|
|
|
(1) Excludes non-performing loans.
|
|
|
|
|
(2) Criticized and classified commercial loans may include loans that are also reported as non-performing or past due.
|
|
|
|
|
|
(3) Total portfolio loans includes $76.5 million of PPP loans as of March 31, 2022.
|
|
|
|
|
|
(4) See non-GAAP financial measures for additional information relating to the calculation of this ratio.
|
|
|
|
|
|
WESBANCO, INC.
|
|
|
|
|
|
|
|
|
|
|
Non-GAAP Financial Measures
|
|
|
|
|
|
|
|
| Page 11
|
|
The following non-GAAP financial measures used by WesBanco provide information useful to investors in understanding WesBanco's operating performance and trends, and facilitate comparisons with the performance of WesBanco's peers. The following tables summarize the non-GAAP financial measures derived from amounts reported in WesBanco's financial statements.
|
|
| Three Months Ended
|
|
|
| Mar. 31,
|
| Dec. 31,
|
| Sept. 30,
|
| June 30,
|
| Mar. 31,
|
|
(unaudited, dollars in thousands, except shares and per share amounts)
| 2022
|
| 2021
|
| 2021
|
| 2021
|
| 2021
|
|
Return on average assets, excluding after-tax restructuring and merger-related expenses:
|
|
|
|
|
|
|
|
|
|
|
| Net income available to common shareholders
| $ 41,593
|
| $ 51,617
|
| $ 41,877
|
| $ 68,057
|
| $ 70,584
|
|
| Plus: after-tax restructuring and merger-related expenses (1)
| 1,258
|
| 140
|
| 3,529
|
| 965
|
| 672
|
|
| Net income available to common shareholders excluding after-tax restructuring and merger-related expenses
| 42,851
|
| 51,757
|
| 45,406
|
| 69,022
|
| 71,256
|
|
|
|
|
|
|
|
|
|
|
|
|
|
| Average total assets
| $ 16,992,598
|
| $ 16,947,662
|
| $ 17,057,793
|
| $ 17,042,147
|
| $ 16,636,258
|
|
|
|
|
|
|
|
|
|
|
|
|
|
Return on average assets, excluding after-tax restructuring and merger-related expenses (annualized) (2)
| 1.02%
|
| 1.21%
|
| 1.06%
|
| 1.62%
|
| 1.74%
|
|
|
|
|
|
|
|
|
|
|
|
|
|
Return on average equity, excluding after-tax restructuring and merger-related expenses:
|
|
|
|
|
|
|
|
|
|
|
| Net income available to common shareholders
| $ 41,593
|
| $ 51,617
|
| $ 41,877
|
| $ 68,057
|
| $ 70,584
|
|
| Plus: after-tax restructuring and merger-related expenses (1)
| 1,258
|
| 140
|
| 3,529
|
| 965
|
| 672
|
|
| Net income available to common shareholders excluding after-tax restructuring and merger-related expenses
| 42,851
|
| 51,757
|
| 45,406
|
| 69,022
|
| 71,256
|
|
|
|
|
|
|
|
|
|
|
|
|
|
| Average total shareholders' equity
| $ 2,655,807
|
| $ 2,709,782
|
| $ 2,777,306
|
| $ 2,801,455
|
| $ 2,770,416
|
|
|
|
|
|
|
|
|
|
|
|
|
|
Return on average equity, excluding after-tax restructuring and merger-related expenses (annualized) (2)
| 6.54%
|
| 7.58%
|
| 6.49%
|
| 9.88%
|
| 10.43%
|
|
|
|
|
|
|
|
|
|
|
|
|
|
Return on average tangible equity:
|
|
|
|
|
|
|
|
|
|
|
| Net income available to common shareholders
| $ 41,593
|
| $ 51,617
|
| $ 41,877
|
| $ 68,057
|
| $ 70,584
|
|
| Plus: amortization of intangibles (1)
| 2,052
|
| 2,239
|
| 2,255
|
| 2,270
|
| 2,288
|
|
| Net income available to common shareholders before amortization of intangibles
| 43,645
|
| 53,856
|
| 44,132
|
| 70,327
|
| 72,872
|
|
|
|
|
|
|
|
|
|
|
|
|
|
| Average total shareholders' equity
| 2,655,807
|
| 2,709,782
|
| 2,777,306
|
| 2,801,455
|
| 2,770,416
|
|
| Less: average goodwill and other intangibles, net of def. tax liability
| (1,139,242)
|
| (1,141,307)
|
| (1,143,522)
|
| (1,145,882)
|
| (1,148,171)
|
|
| Average tangible equity
| $ 1,516,565
|
| $ 1,568,475
|
| $ 1,633,784
|
| $ 1,655,573
|
| $ 1,622,245
|
|
|
|
|
|
|
|
|
|
|
|
|
|
Return on average tangible equity (annualized) (2)
| 11.67%
|
| 13.62%
|
| 10.72%
|
| 17.04%
|
| 18.22%
|
|
|
|
|
|
|
|
|
|
|
|
|
|
| Average tangible common equity
| $ 1,372,081
|
| $ 1,423,991
|
| $ 1,489,300
|
| $ 1,511,089
|
| $ 1,477,736
|
|
Return on average tangible common equity (annualized) (2)
| 12.90%
|
| 15.00%
|
| 11.76%
|
| 18.67%
|
| 20.00%
|
|
|
|
|
|
|
|
|
|
|
|
|
|
Return on average tangible equity, excluding after-tax restructuring and merger-related expenses:
|
|
|
|
|
|
|
|
|
|
|
| Net income available to common shareholders
| $ 41,593
|
| $ 51,617
|
| $ 41,877
|
| $ 68,057
|
| $ 70,584
|
|
| Plus: after-tax restructuring and merger-related expenses (1)
| 1,258
|
| 140
|
| 3,529
|
| 965
|
| 672
|
|
| Plus: amortization of intangibles (1)
| 2,052
|
| 2,239
|
| 2,255
|
| 2,270
|
| 2,288
|
|
| Net income available to common shareholders before amortization of intangibles
|
|
|
|
|
|
|
|
|
|
|
| and excluding after-tax restructuring and merger-related expenses
| 44,903
|
| 53,996
|
| 47,661
|
| 71,292
|
| 73,544
|
|
|
|
|
|
|
|
|
|
|
|
|
|
| Average total shareholders' equity
| 2,655,807
|
| 2,709,782
|
| 2,777,306
|
| 2,801,455
|
| 2,770,416
|
|
| Less: average goodwill and other intangibles, net of def. tax liability
| (1,139,242)
|
| (1,141,307)
|
| (1,143,522)
|
| (1,145,882)
|
| (1,148,171)
|
|
| Average tangible equity
| $ 1,516,565
|
| $ 1,568,475
|
| $ 1,633,784
|
| $ 1,655,573
|
| $ 1,622,245
|
|
|
|
|
|
|
|
|
|
|
|
|
|
Return on average tangible equity, excluding after-tax restructuring and merger-related expenses (annualized) (2)
| 12.01%
|
| 13.66%
|
| 11.57%
|
| 17.27%
|
| 18.39%
|
|
|
|
|
|
|
|
|
|
|
|
|
|
| Average tangible common equity
| $ 1,372,081
|
| $ 1,423,991
|
| $ 1,489,300
|
| $ 1,511,089
|
| $ 1,477,736
|
|
Return on average tangible common equity, excluding after-tax restructuring and merger-related expenses (annualized) (2)
| 13.27%
|
| 15.04%
|
| 12.70%
|
| 18.92%
|
| 20.18%
|
|
|
|
|
|
|
|
|
|
|
|
|
|
Efficiency ratio:
|
|
|
|
|
|
|
|
|
|
|
| Non-interest expense
| $ 87,548
|
| $ 88,303
|
| $ 94,701
|
| $ 83,812
|
| $ 86,327
|
|
| Less: restructuring and merger-related expense
| (1,593)
|
| (177)
|
| (4,467)
|
| (1,222)
|
| (851)
|
|
| Non-interest expense excluding restructuring and merger-related expense
| 85,955
|
| 88,126
|
| 90,234
|
| 82,590
|
| 85,476
|
|
|
|
|
|
|
|
|
|
|
|
|
|
| Net interest income on a fully taxable equivalent basis
| 108,866
|
| 111,453
|
| 116,355
|
| 116,906
|
| 117,517
|
|
| Non-interest income
| 30,382
|
| 30,709
|
| 32,755
|
| 36,112
|
| 33,208
|
|
| Net interest income on a fully taxable equivalent basis plus non-interest income
| $ 139,248
|
| $ 142,162
|
| $ 149,110
|
| $ 153,018
|
| $ 150,725
|
|
| Efficiency ratio
| 61.73%
|
| 61.99%
|
| 60.52%
|
| 53.97%
|
| 56.71%
|
|
|
|
|
|
|
|
|
|
|
|
|
|
|
|
|
|
|
|
|
|
|
|
|
|
Net income available to common shareholders, excluding after-tax restructuring and merger-related expenses:
|
|
|
|
|
|
|
|
|
|
|
| Net income available to common shareholders
| $ 41,593
|
| $ 51,617
|
| $ 41,877
|
| $ 68,057
|
| $ 70,584
|
|
| Add: After-tax restructuring and merger-related expenses (1)
| 1,258
|
| 140
|
| 3,529
|
| 965
|
| 672
|
|
Net income available to common shareholders, excluding after-tax restructuring and merger-related expenses
| $ 42,851
|
| $ 51,757
|
| $ 45,406
|
| $ 69,022
|
| $ 71,256
|
|
|
|
|
|
|
|
|
|
|
|
|
|
|
|
|
|
|
|
|
|
|
|
|
|
Net income per common share - diluted, excluding after-tax restructuring and merger-related expenses:
|
|
|
|
|
|
|
|
|
|
|
| Net income per common share - diluted
| $ 0.68
|
| $ 0.82
|
| $ 0.64
|
| $ 1.01
|
| $ 1.05
|
|
| Add: After-tax restructuring and merger-related expenses per common share - diluted (1)
| 0.02
|
| -
|
| 0.06
|
| 0.02
|
| 0.01
|
|
Net income per common share - diluted, excluding after-tax restructuring and merger-related expenses
| $ 0.70
|
| $ 0.82
|
| $ 0.70
|
| $ 1.03
|
| $ 1.06
|
|
|
|
|
|
|
|
|
|
|
|
|
|
|
|
|
|
|
|
|
|
|
|
|
|
|
| Period End
|
|
|
| Mar. 31,
|
| Dec. 31,
|
| Sept. 30,
|
| June 30,
|
| Mar. 31,
|
|
|
| 2022
|
| 2021
|
| 2021
|
| 2021
|
| 2021
|
|
Tangible book value per share:
|
|
|
|
|
|
|
|
|
|
|
| Total shareholders' equity
| $ 2,547,316
|
| $ 2,693,166
|
| $ 2,723,983
|
| $ 2,780,836
|
| $ 2,785,522
|
|
| Less: goodwill and other intangible assets, net of def. tax liability
| (1,138,057)
|
| (1,140,111)
|
| (1,142,350)
|
| (1,144,604)
|
| (1,146,874)
|
|
| Less: preferred shareholder's equity
| (144,484)
|
| (144,484)
|
| (144,484)
|
| (144,484)
|
| (144,484)
|
|
| Tangible common equity
| 1,264,775
|
| 1,408,571
|
| 1,437,149
|
| 1,491,748
|
| 1,494,164
|
|
|
|
|
|
|
|
|
|
|
|
|
|
| Common shares outstanding
| 60,613,414
|
| 62,307,245
|
| 63,838,549
|
| 65,970,149
|
| 67,282,134
|
|
|
|
|
|
|
|
|
|
|
|
|
|
Tangible book value per share
| $ 20.87
|
| $ 22.61
|
| $ 22.51
|
| $ 22.61
|
| $ 22.21
|
|
|
|
|
|
|
|
|
|
|
|
|
|
Tangible common equity to tangible assets:
|
|
|
|
|
|
|
|
|
|
|
| Total shareholders' equity
| $ 2,547,316
|
| $ 2,693,166
|
| $ 2,723,983
|
| $ 2,780,836
|
| $ 2,785,522
|
|
| Less: goodwill and other intangible assets, net of def. tax liability
| (1,138,057)
|
| (1,140,111)
|
| (1,142,350)
|
| (1,144,604)
|
| (1,146,874)
|
|
| Tangible equity
| 1,409,259
|
| 1,553,055
|
| 1,581,633
|
| 1,636,232
|
| 1,638,648
|
|
| Less: preferred shareholder's equity
| (144,484)
|
| (144,484)
|
| (144,484)
|
| (144,484)
|
| (144,484)
|
|
| Tangible common equity
| 1,264,775
|
| 1,408,571
|
| 1,437,149
|
| 1,491,748
|
| 1,494,164
|
|
|
|
|
|
|
|
|
|
|
|
|
|
| Total assets
| 17,104,015
|
| 16,927,125
|
| 16,892,111
|
| 16,966,867
|
| 17,057,788
|
|
| Less: goodwill and other intangible assets, net of def. tax liability
| (1,138,057)
|
| (1,140,111)
|
| (1,142,350)
|
| (1,144,604)
|
| (1,146,874)
|
|
| Tangible assets
| $ 15,965,958
|
| $ 15,787,014
|
| $ 15,749,761
|
| $ 15,822,263
|
| $ 15,910,914
|
|
|
|
|
|
|
|
|
|
|
|
|
|
Tangible equity to tangible assets
| 8.83%
|
| 9.84%
|
| 10.04%
|
| 10.34%
|
| 10.30%
|
|
|
|
|
|
|
|
|
|
|
|
|
|
Tangible common equity to tangible assets
| 7.92%
|
| 8.92%
|
| 9.12%
|
| 9.43%
|
| 9.39%
|
|
|
|
|
|
|
|
|
|
|
|
|
|
|
|
|
|
|
|
|
|
|
|
|
|
(1) Tax effected at 21% for all periods presented.
|
|
|
|
|
|
(2) The ratios are annualized by utilizing actual numbers of days in the quarter versus the year.
|
|
|
|
|
|
WESBANCO, INC.
|
|
|
|
|
|
|
|
|
|
|
Additional Non-GAAP Financial Measures
|
|
|
|
|
|
|
|
| Page 12
|
|
The following non-GAAP financial measures used by WesBanco provide information useful to investors in understanding WesBanco's operating performance and trends, and facilitate comparisons with the performance of WesBanco's peers. The following tables summarize the non-GAAP financial measures derived from amounts reported in WesBanco's financial statements.
|
|
|
|
|
|
|
|
|
|
|
|
|
|
| Three Months Ended
|
|
|
| Mar. 31,
|
| Dec. 31,
|
| Sept. 30,
|
| June 30,
|
| Mar. 31,
|
|
(unaudited, dollars in thousands, except shares and per share amounts)
| 2022
|
| 2021
|
| 2021
|
| 2021
|
| 2021
|
|
Pre-tax, pre-provision income:
|
|
|
|
|
|
|
|
|
|
|
| Income before provision for income taxes
| $ 53,983
|
| $ 66,292
|
| $ 55,059
|
| $ 89,180
|
| $ 91,317
|
|
| Add: provision for credit losses
| (3,438)
|
| (13,559)
|
| (1,730)
|
| (21,025)
|
| (27,958)
|
|
Pre-tax, pre-provision income
| $ 50,545
|
| $ 52,733
|
| $ 53,329
|
| $ 68,155
|
| $ 63,359
|
|
|
|
|
|
|
|
|
|
|
|
|
|
Pre-tax, pre-provision income, excluding restructuring and merger-related expenses:
|
|
|
|
|
|
|
|
|
|
|
| Income before provision for income taxes
| $ 53,983
|
| $ 66,292
|
| $ 55,059
|
| $ 89,180
|
| $ 91,317
|
|
| Add: provision for credit losses
| (3,438)
|
| (13,559)
|
| (1,730)
|
| (21,025)
|
| (27,958)
|
|
| Add: restructuring and merger-related expenses
| 1,593
|
| 177
|
| 4,467
|
| 1,222
|
| 851
|
|
Pre-tax, pre-provision income, excluding restructuring and merger-related expenses
| $ 52,138
|
| $ 52,910
|
| $ 57,796
|
| $ 69,377
|
| $ 64,210
|
|
|
|
|
|
|
|
|
|
|
|
|
|
Return on average assets, excluding certain items (1):
|
|
|
|
|
|
|
|
|
|
|
| Income before provision for income taxes
| $ 53,983
|
| $ 66,292
|
| $ 55,059
|
| $ 89,180
|
| $ 91,317
|
|
| Add: provision for credit losses
| (3,438)
|
| (13,559)
|
| (1,730)
|
| (21,025)
|
| (27,958)
|
|
| Add: restructuring and merger-related expenses
| 1,593
|
| 177
|
| 4,467
|
| 1,222
|
| 851
|
|
Pre-tax, pre-provision income, excluding restructuring and merger-related expenses
| 52,138
|
| 52,910
|
| 57,796
|
| 69,377
|
| 64,210
|
|
|
|
|
|
|
|
|
|
|
|
|
|
| Average total assets
| $ 16,992,598
|
| $ 16,947,662
|
| $ 17,057,793
|
| $ 17,042,147
|
| $ 16,636,258
|
|
|
|
|
|
|
|
|
|
|
|
|
|
Return on average assets, excluding certain items (annualized) (1) (2)
| 1.24%
|
| 1.24%
|
| 1.34%
|
| 1.63%
|
| 1.57%
|
|
|
|
|
|
|
|
|
|
|
|
|
|
Return on average equity, excluding certain items (1):
|
|
|
|
|
|
|
|
|
|
|
| Income before provision for income taxes
| $ 53,983
|
| $ 66,292
|
| $ 55,059
|
| $ 89,180
|
| $ 91,317
|
|
| Add: provision for credit losses
| (3,438)
|
| (13,559)
|
| (1,730)
|
| (21,025)
|
| (27,958)
|
|
| Add: restructuring and merger-related expenses
| 1,593
|
| 177
|
| 4,467
|
| 1,222
|
| 851
|
|
Pre-tax, pre-provision income, excluding restructuring and merger-related expenses
| 52,138
|
| 52,910
|
| 57,796
|
| 69,377
|
| 64,210
|
|
|
|
|
|
|
|
|
|
|
|
|
|
| Average total shareholders' equity
| $ 2,655,807
|
| $ 2,709,782
|
| $ 2,777,306
|
| $ 2,801,455
|
| $ 2,770,416
|
|
|
|
|
|
|
|
|
|
|
|
|
|
Return on average equity, excluding certain items (annualized) (1) (2)
| 7.96%
|
| 7.75%
|
| 8.26%
|
| 9.93%
|
| 9.40%
|
|
|
|
|
|
|
|
|
|
|
|
|
|
Return on average tangible equity, excluding certain items (1):
|
|
|
|
|
|
|
|
|
|
|
| Income before provision for income taxes
| $ 53,983
|
| $ 66,292
|
| $ 55,059
|
| $ 89,180
|
| $ 91,317
|
|
| Add: provision for credit losses
| (3,438)
|
| (13,559)
|
| (1,730)
|
| (21,025)
|
| (27,958)
|
|
| Add: amortization of intangibles
| 2,598
|
| 2,834
|
| 2,854
|
| 2,873
|
| 2,896
|
|
| Add: restructuring and merger-related expenses
| 1,593
|
| 177
|
| 4,467
|
| 1,222
|
| 851
|
|
Income before provision, restructuring and merger-related expenses and amortization of intangibles
| 54,736
|
| 55,744
|
| 60,650
|
| 72,250
|
| 67,106
|
|
|
|
|
|
|
|
|
|
|
|
|
|
| Average total shareholders' equity
| 2,655,807
|
| 2,709,782
|
| 2,777,306
|
| 2,801,455
|
| 2,770,416
|
|
| Less: average goodwill and other intangibles, net of def. tax liability
| (1,139,242)
|
| (1,141,307)
|
| (1,143,522)
|
| (1,145,882)
|
| (1,148,171)
|
|
| Average tangible equity
| $ 1,516,565
|
| $ 1,568,475
|
| $ 1,633,784
|
| $ 1,655,573
|
| $ 1,622,245
|
|
|
|
|
|
|
|
|
|
|
|
|
|
Return on average tangible equity, excluding certain items (annualized) (1) (2)
| 14.64%
|
| 14.10%
|
| 14.73%
|
| 17.50%
|
| 16.78%
|
|
|
|
|
|
|
|
|
|
|
|
|
|
| Average tangible common equity
| $ 1,372,081
|
| $ 1,423,991
|
| $ 1,489,300
|
| $ 1,511,089
|
| $ 1,477,736
|
|
Return on average tangible common equity, excluding certain items (annualized) (1) (2)
| 16.18%
|
| 15.53%
|
| 16.16%
|
| 19.18%
|
| 18.42%
|
|
|
|
|
|
|
|
|
|
|
|
|
|
|
|
|
|
|
|
|
|
|
|
|
|
(1) Certain items excluded from the calculations consist of credit provisions, tax provisions and restructuring and merger-related expenses.
|
|
|
|
(2) The ratios are annualized by utilizing actual numbers of days in the quarter versus the year.
|
|
|
|
View original content to download multimedia:https://www.prnewswire.com/news-releases/wesbanco-announces-first-quarter-2022-financial-results-301533630.html
SOURCE WesBanco, Inc.


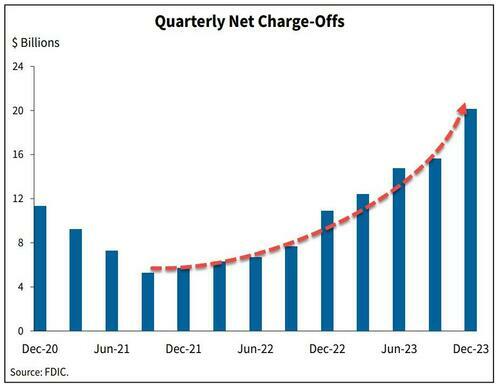
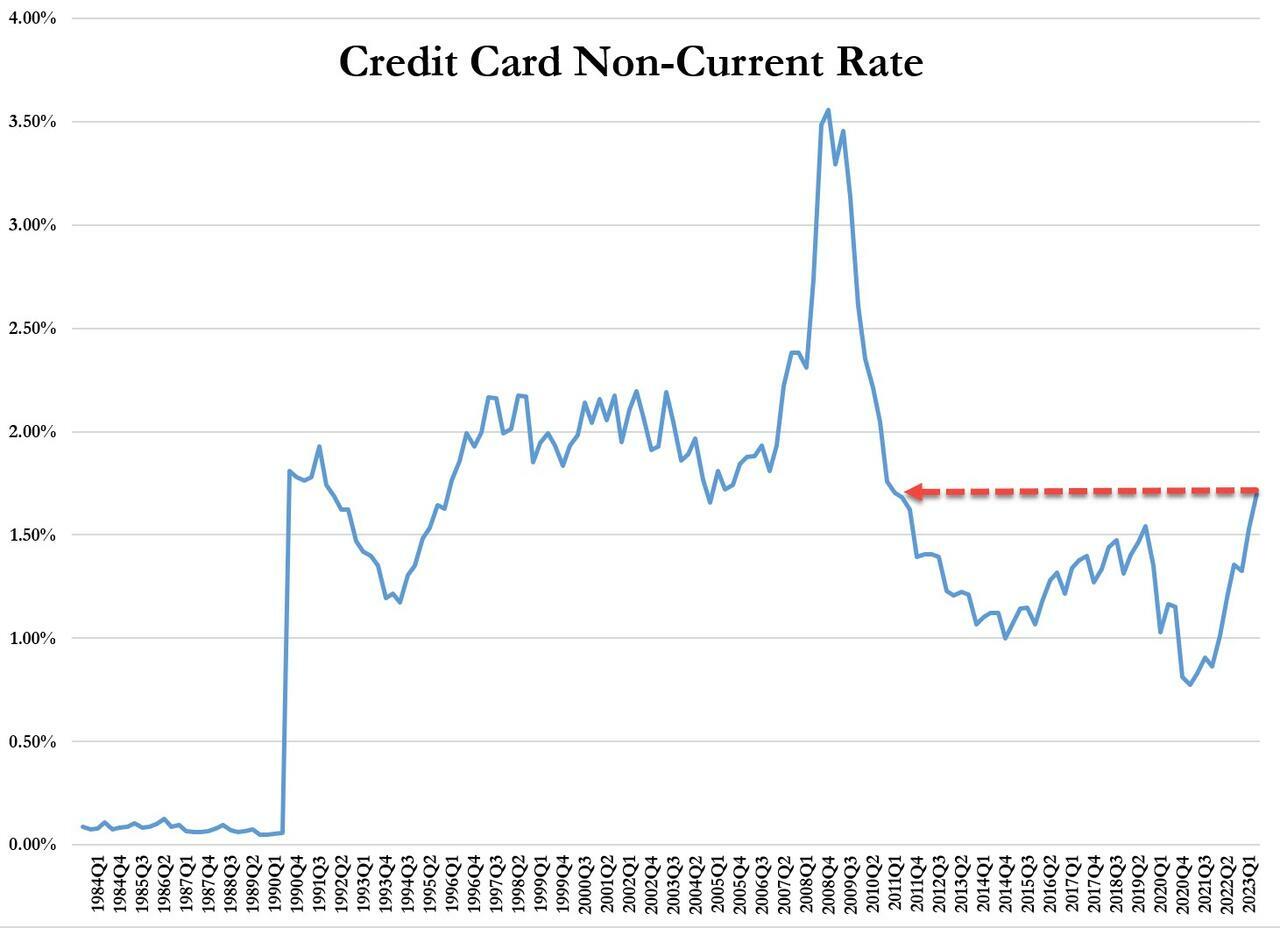
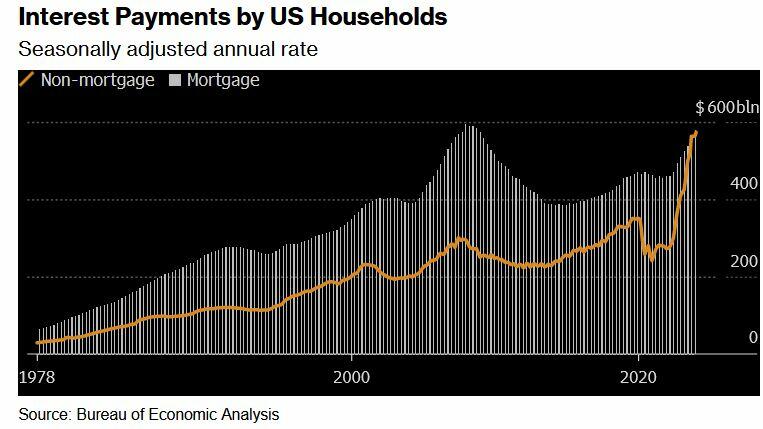

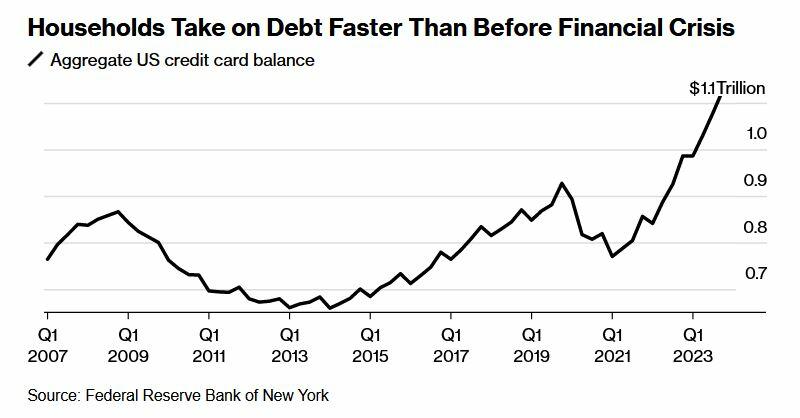
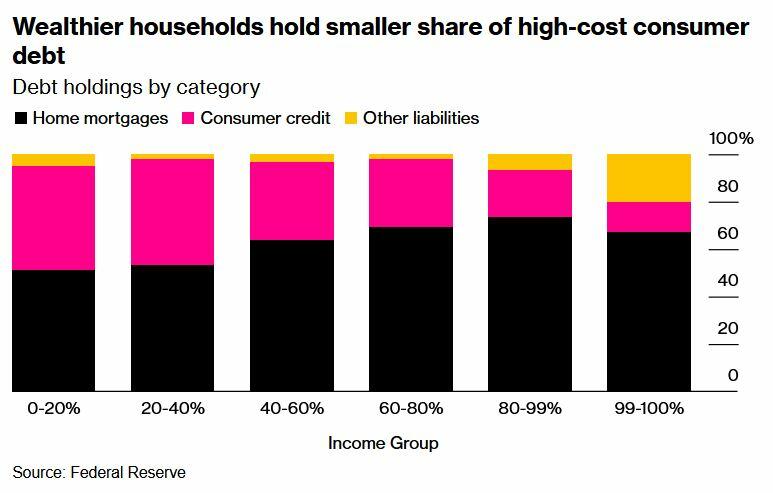


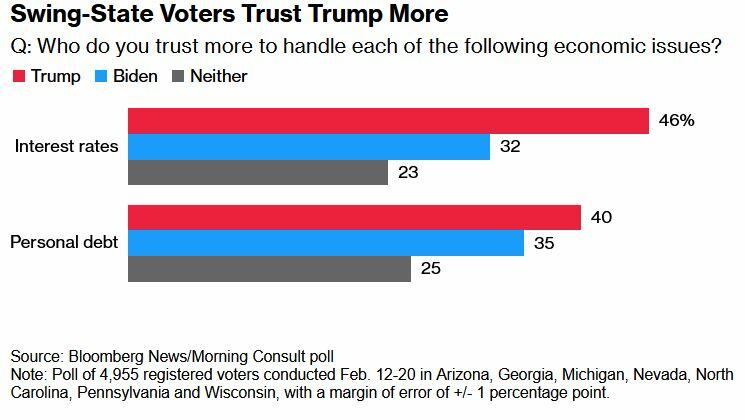


