Volatility And Valuations
Volatility And Valuations
Authored by Nick Colas via DataTrek Research,
We will start today’s discussion with two numbers: 5.6 percent…
Share this:


Authored by Nick Colas via DataTrek Research,
We will start today’s discussion with two numbers: 5.6 percent and 3.4 percent. Those are the 20-year compounded annual growth rates (CAGR) for the S&P 500 from 1999 – 2018 on a nominal and real (after-inflation) basis. If those strike you as pathetically low, you are correct:
- That 5.6 percent nominal return is barely half the S&P’s long run average 20-year CAGR of 10.8 percent.
- It is also the worst nominal 20-year CAGR since the period spanning the Great Depression.
- The 3.4 percent inflation-adjusted 20-year CAGR is the worst since the 1969 – 1988 timeframe, where the 1980s bull market only barely made up for the inflationary 1970s. Long run inflation-adjusted S&P returns are 7.1 percent, more than double that 3.4 percent result.
Now, one might say that 1999 is an unfair starting point, but the 20-year CAGR data tells much the same story about sub-par or merely average returns across other timeframes:
- 1997 – 2016: 7.6 percent nominal, 5.5 percent real returns
- 2002 – 2021: 9.4 percent nominal, 7.1 percent real returns
The reason for these disappointing results for long-term equity investors comes down to two 5-year periods: 1997 - 2002 and 2007 - 2012. In both cases, the S&P 500 went nowhere for half a decade. Returns from 2003 – 2006 were decent, averaging 15 percent with no drawdown years, but that still was not enough to make up for the stagnant bookends on either side of that time span.
Interestingly, it was not corporate earnings power than caused these two “lost” half decades:
- S&P 500 earnings were $44.01 in 1997, when the index closed the year at 970. When the S&P got back to that level in Q2 2003, trailing 4 quarter earnings were $48.95/share. That is a difference of 11 percent.
- In 2007, the S&P earned $82.54/share and the index finished the year at 1,475. The next time the S&P was at similar levels after the Financial Crisis/Great Recession was in early 2013, when the S&P had earned $98.35/share in the prior 4 quarters. The difference here is 19 percent, but the index was flat from 2007 to 2013.
We cannot blame Interest rates for this contraction in price-earnings multiples. Ten-year Treasury yields were lower in 2003 than 1997 (3 versus 6 percent) and 2013 relative to 2007 (1-2 percent versus 5 percent). If anything, multiples should have recovered more quickly and been higher in 2003 and 2013 and in 1997 and 2007. And yet, they clearly were not.
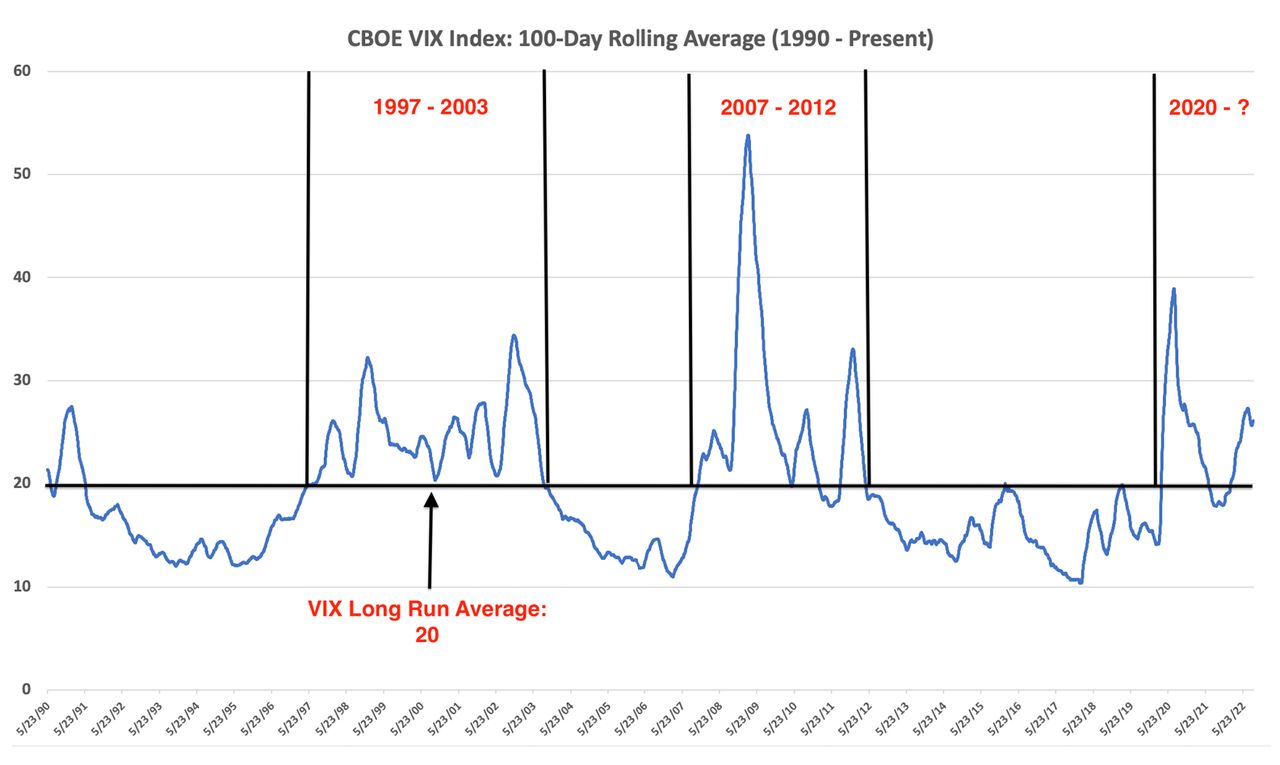
The chart below, which shows the 100-day rolling average of the CBOE VIX Index, offers a reasonable explanation for why US equity valuations contracted over 1997 – 2002 and 2007 – 2012 even with the tailwind of lower interest rates. As highlighted, in both periods the VIX was consistently above its long-run average of 20 for years on end. Yes, the S&P bottomed before the end of each period of volatility (2002 and 2009). The trouble was that valuations remained compressed for far longer than just the 2000 – 2002 and 2008 bear markets. That is why the S&P flatlined for 5 years in each case rather than just 1 – 3 years.
We have highlighted the current VIX running averages on the rightmost part of the graph, and those broadly resemble prior problematic periods for equity valuations. Happily, volatility has not yet overly damaged S&P price-earnings multiples relative to pre-pandemic levels. The S&P trades for 17.5x current earnings power of $228/share. In 2019, PE ratios ran between 18.5 – 19.5x. A bit of a haircut, true, but consistent with higher interest rates so let’s call it a wash.
I do, however, worry about long-lasting equity market volatility far more than I worry about recession. Large public companies know how to make money, even during periods of economic stress, as the data presented above shows. The market-weighted nature of the S&P indexing process constantly resets in favor of businesses that accomplish that task better than others. Recession or no, these are fundamentally positive and permanent features and the cornerstone of our view that US large caps are the most productive asset class for long term investors.
The problem is that volatility grinds away at investor confidence. The longer it lasts, the lower stock valuations go. That is entirely rational, if unwelcomed, but it takes years to regain investors’ trust after a long bout of volatility. That is how you end up with zero stock market returns for 5 years, and subpar returns for periods as long as 2 decades.
I think Chair Powell and the Federal Reserve understand this problem, albeit from the wider perspective of creating an environment consistent with sustainable economic growth. The Fed needs to get inflation under control quickly and permanently, because until they accomplish that goal capital markets volatility will remain high. That will limit capital formation and investment over the longer term, making the next economic cycle weaker than it would otherwise be.
Takeaway: while it may be painful in the near-term, long-term US equity investors should be hoping for very aggressive and effective monetary policy over the next 6-12 months and look to add stock exposure to portfolios as that unfolds.
That will be the pathway to holding equity valuations at current levels and offers the possibility of better multiples in the next cycle.
The alternative – another 1-2 years of uncertainty – would threaten structural returns for 5 years or longer. History is clear on that point.
International
When Military Rule Supplants Democracy
When Military Rule Supplants Democracy
Authored by Robert Malone via The Brownstone Institute,
If you wish to understand how democracy ended…
Share this:


Authored by Robert Malone via The Brownstone Institute,
If you wish to understand how democracy ended in the United States and the European Union, please watch this interview with Tucker Carlson and Mike Benz. It is full of the most stunning revelations that I have heard in a very long time.
The national security state is the main driver of censorship and election interference in the United States.
“What I’m describing is military rule,” says Mike Benz.
“It’s the inversion of democracy.”
Please watch below...
Ep. 75 The national security state is the main driver of censorship and election interference in the United States. "What I’m describing is military rule," says Mike Benz. "It’s the inversion of democracy." pic.twitter.com/hDTEjAf89T
— Tucker Carlson (@TuckerCarlson) February 16, 2024
I have also included a transcript of the above interview. In the interests of time – this is AI generated. So, there still could be little glitches – I will continue to clean up the text over the next day or two.
Note: Tucker (who I consider a friend) has given me permission to directly upload the video above and transcript below – he wrote this morning in response to my request:
Oh gosh, I hope you will. It’s important.
Honestly, it is critical that this video be seen by as many people as possible. So, please share this video interview and transcript.
Five points to consider that you might overlook;
First– the Aspen Institute planning which is described herein reminds me of the Event 201 planning for COVID.
Second– reading the comments to Tucker’s original post on “X” with this interview, I am struck by the parallels between the efforts to delegitimize me and the new efforts to delegitimize Mike Benz. People should be aware that this type of delegitimization tactic is a common response by those behind the propaganda to anyone who reveals their tactics and strategies. The core of this tactic is to cast doubt about whether the person in question is unreliable or a sort of double agent (controlled opposition).
Third– Mike Benz mostly focuses on the censorship aspect of all of this, and does not really dive deeply into the active propaganda promotion (PsyWar) aspect.
Fourth– Mike speaks of the influence mapping and natural language processing tools being deployed, but does not describe the “Behavior Matrix” tool kit involving extraction and mapping of emotion. If you want to dive in a bit further into this, I covered this latter part October 2022 in a substack essay titled “Twitter is a weapon, not a business”.
Fifth– what Mike Benz is describing is functionally a silent coup by the US Military and the Deep State. And yes, Barack Obama’s fingerprints are all over this.
Yet another “conspiracy theory” is now being validated.
Transcript of the video:
Tucker Carlson:
The defining fact of the United States is freedom of speech. To the extent this country is actually exceptional, it’s because we have the first amendment in the Bill of Rights. We have freedom of conscience. We can say what we really think.
There’s no hate speech exception to that just because you hate what somebody else thinks. You cannot force that person to be quiet because we’re citizens, not slaves. But that right, that foundational right that makes this country what it is, that right from which all of the rights flow is going away at high speed in the face of censorship. Now, modern censorship, there’s no resemblance to previous censorship regimes in previous countries and previous eras. Our censorship is affected on the basis of fights against disinformation and malformation. And the key thing to know about this is that they’re everywhere. And of course, this censorship has no reference at all to whether what you’re saying is true or not.
In other words, you can say something that is factually accurate and consistent with your own conscience. And in previous versions of America, you had an absolute right to say those things. but now – because someone doesn’t like them or because they’re inconvenient to whatever plan the people in power have, they can be denounced as disinformation and you could be stripped of your right to express them either in person or online. In fact, expressing these things can become a criminal act and is it’s important to know, by the way, that this is not just the private sector doing this.
These efforts are being directed by the US government, which you pay for and at least theoretically owned. It’s your government, but they’re stripping your rights at very high speed. Most people understand this intuitively, but they don’t know how it happens. How does censorship happen? What are the mechanics of it?
Mike Benz is, we can say with some confidence, the expert in the world on how this happens. Mike Benz had the cyber portfolio at the State Department. He’s now executive director of Foundation for Freedom Online, and we’re going to have a conversation with him about a very specific kind of censorship. By the way, we can’t recommend strongly enough, if you want to know how this happens, Mike Benz is the man to read.
But today we just want to talk about a specific kind of censorship and that censorship that emanates from the fabled military industrial complex, from our defense industry and the foreign policy establishment in Washington. That’s significant now because we’re on the cusp of a global war, and so you can expect censorship to increase dramatically. And so with that, here is Mike Benz, executive director of Foundation for Freedom online. Mike, thanks so much for joining us and I just can’t overstate to our audience how exhaustive and comprehensive your knowledge is on this topic. It’s almost unbelievable. And so if you could just walk us through how the foreign policy establishment and defense contractors and DOD and just the whole cluster, the constellation of defense related publicly funded institutions, stripped from us,
Mike Benz:
Our freedom of speech. Sure. One of the easiest ways to actually start the story is really with the story of internet freedom and it switched from internet freedom to internet censorship because free speech on the internet was an instrument of statecraft almost from the outset of the privatization of the internet in 1991. We quickly discovered through the efforts of the Defense Department, the State Department and our intelligence services, that people were using the internet to congregate on blogs and forums. And at this point, free speech was championed more than anybody by the Pentagon, the State Department, and our sort of CIA cutout NGO blob architecture as a way to support dissident groups around the world in order to help them overthrow authoritarian governments as they were sort of build essentially the internet free speech allowed kind of insta regime change operations to be able to facilitate the foreign policy establishments State Department agenda.
Google is a great example of this. Google began as a DARPA grant by Larry Page and Sergey Brin when they were Stanford PhDs, and they got their funding as part of a joint CIA NSA program to chart how “birds of a feather flock together online” through search engine aggregation. And then one year later they launched Google and then became a military contractor. Quickly thereafter, they got Google Maps by purchasing a CIA satellite software essentially, and the ability to use free speech on the internet as a way to circumvent state control over media over in places like Central Asia and all around the world, was seen as a way to be able to do what used to be done out of CIA station houses or out of embassies or consulates in a way that was totally turbocharged. And all of the internet free speech technology was initially created by our national security state – VPNs, virtual private networks to hide your IP address, tour the dark web, to be able to buy and sell goods anonymously, end-to-end encrypted chats.
All of these things were created initially as DARPA projects or as joint CIA NSA projects to be able to help intelligence backed groups, to overthrow governments that were causing a problem to the Clinton administration or the Bush administration or the Obama administration. And this plan worked magically from about 1991 until about 2014 when there began to be an about face on internet freedom and its utility.
Now, the high watermark of the sort of internet free speech moment was the Arab Spring in 2011, 2012 when you had this one by one – all of the adversary governments of the Obama Administration: Egypt, Tunisia, all began to be toppled in Facebook revolutions and Twitter revolutions. And you had the State Department working very closely with the social media companies to be able to keep social media online during those periods. There was a famous phone call from Google’s Jared Cohen to Twitter to not do their scheduled maintenance so that the preferred opposition group in Iran would be able to use Twitter to win that election.
So free speech was an instrument of statecraft from the national security state to begin with. All of that architecture, all the NGOs, the relationships between the tech companies and the national security state had been long established for freedom. In 2014, after the coup in Ukraine, there was an unexpected counter coup where Crimea and the Donbas broke away and they broke away with essentially a military backstop that NATO was highly unprepared for at the time. They had one last Hail Mary chance, which was the Crimea annexation vote in 2014. And when the hearts and minds of the people of Crimea voted to join the Russian Federation, that was the last straw for the concept of free speech on the internet in the eyes of NATO – as they saw it. The fundamental nature of war changed at that moment. And NATO at that point declared something that they first called the Gerasimov doctrine, which was named after this Russian military, a general who they claimed made a speech that the fundamental nature of war has changed.
(Gerasimov doctrine is the idea that) you don’t need to win military skirmishes to take over central and eastern Europe. All you need to do is control the media and the social media ecosystem because that’s what controls elections. And if you simply get the right administration into power, they control the military. So it’s infinitely cheaper than conducting a military war to simply conduct an organized political influence operation over social media and legacy media. An industry had been created that spanned the Pentagon, the British Ministry of Defense and Brussels into a organized political warfare outfit, essentially infrastructure that was created initially stationed in Germany and in Central and eastern Europe to create psychological buffer zones, basically to create the ability to have the military work with the social media companies to censor Russian propaganda and then to censor domestic, right-wing populist groups in Europe who were rising in political power at the time because of the migrant crisis.
So you had the systematic targeting by our state department, by our intelligence community, by the Pentagon of groups like Germany’s AFD, the alternative for Deutsche Land there and for groups in Estonia, Latvia, Lithuania. Now, when Brexit happened in 2016, that was this crisis moment where suddenly they didn’t have to worry just about central and eastern Europe anymore. It was coming westward, this idea of Russian control over hearts and minds. And so Brexit was June, 2016. The very next month at the Warsaw Conference, NATO formally amended its charter to expressly commit to hybrid warfare as this new NATO capacity. So they went from basically 70 years of tanks to this explicit capacity building for censoring tweets if they were deemed to be Russian proxies. And again, it’s not just Russian propaganda this, these were now Brexit groups or groups like Mateo Salvini in Italy or in Greece or in Germany or in Spain with the Vox Party.
And now at the time NATO was publishing white papers saying that the biggest threat NATO faces is not actually a military invasion from Russia. It’s losing domestic elections across Europe to all these right-wing populace groups who, because they were mostly working class movements, were campaigning on cheap Russian energy at a time when the US was pressuring this energy diversification policy. And so they made the argument after Brexit, now the entire rules-based international order would collapse unless the military took control over media because Brexit would give rise to Frexit in France with marine Lapin just Brexit in Spain with a Vox party to Italy exit in Italy, to Grexit in Germany, to Grexit in Greece, the EU would come apart, so NATO would be killed without a single bullet being fired. And then not only that, now that NATO’s gone, now there’s no enforcement arm for the International Monetary fund, the IMF or the World Bank. So now the financial stakeholders who depend on the battering ram of the national security state would basically be helpless against governments around the world. So from their perspective, if the military did not begin to censor the internet, all of the democratic institutions and infrastructure that gave rise to the modern world after World War II would collapse. So you can imagine the reaction,
Tucker Carlson:
Wait, ask
Mike Benz:
Later. Donald Trump won the 2016 election. So
Tucker Carlson:
Well, you just told a remarkable story that I’ve never heard anybody explain as lucidly and crisply as you just did. But did anyone at NATO or anyone at the State Department pause for a moment and say, wait a second, we’ve just identified our new enemy as democracy within our own countries. I think that’s what you’re saying. They feared that the people, the citizens of their own countries would get their way, and they went to war against that.
Mike Benz:
Yes. Now there’s a rich history of this dating back to the Cold War. The Cold War in Europe was essentially a similar struggle for hearts and minds of people, especially in central and Eastern Europe in these sort of Soviet buffer zones. And starting in 1948, the national security state was really established. Then you had the 1947 Act, which established the Central Intelligence Agency. You had this world order that had been created with all these international institutions, and you had the 1948 UN Declaration on human rights, which forbid the territorial acquisition by military force. So you can no longer run a traditional military occupation government in the way that we could in 1898, for example, when we took the Philippines, everything had to be done through a sort of political legitimization process whereby there’s some ratification from the hearts and minds of people within the country.
Now, often that involves simply puppet politicians who are groomed as emerging leaders by our State Department. But the battle for hearts and minds had been something that we had been giving ourselves a long moral license leash, if you will, since 1948. One of the godfathers of the CIA was George Kennan. So, 12 days after we rigged the Italian election in 1948 by stuffing ballot boxes and working with the mob, we published a memo called the Inauguration of organized political warfare where Kennan said, “listen, it’s a mean old world out there. We at the CIA just rigged the Italian election. We had to do it because if the Communist won, maybe there’d never be another election in Italy again, but it’s really effective, guys. We need a department of dirty tricks to be able to do this around the world. And this is essentially a new social contract we’re constructing with the American people because this is not the way we’ve conducted diplomacy before, but we are now forbidden from using the war department in 1948.”
They also renamed the war department to the Defense Department. So again, as part of this diplomatic onslaught for political control, rather than it looking like it’s overt military control, but essentially what ended up happening there is we created this foreign domestic firewall. We said that we have a department of dirty tricks to be able to rig elections, to be able to control media, to be able to meddle in the internal affairs of every other plot of dirt in the country.
But this sort of sacred dirt in which the American homeland sits, they are not allowed to operate there. The State Department, the Defense Department, and the CIA are all expressly forbidden from operating on US soil. Of course, this is so far from the case, it’s not even funny, but that’s because of a number of laundering tricks that they’ve developed over 70 years of doing this.
But essentially there was no moral quandary at first with respect to the creation of the censorship industry. When it started out in Germany and in Lithuania and Latvia and Estonia and in Sweden and Finland, there began to be a more diplomatic debate about it after Brexit, and then it became full throttle when Trump was elected. And what little resistance there was was washed over by the rise in saturation of Russiagate, which basically allowed them to not have to deal with the moral ambiguities of censoring your own people.
Because if Trump was a Russian asset, you no longer really had a traditional free speech issue. It was a national security issue. It was only after Russiagate died in July, 2019 when Robert Mueller basically choked on the stand for three hours and revealed he had absolutely nothing. After two and a half years of investigation that the foreign to domestic switcheroo took place where they took all of this censorship architecture, spanning DHS, the FBI, the CIA, the DOD, the DOJ, and then the thousands of government funded NGO and private sector mercenary firms were all basically transited from a foreign predicate, a Russian disinformation predicate to a democracy predicate by saying that disinformation is not just a threat when it comes from the Russians, it’s actually an intrinsic threat to democracy itself.
And so by that, they were able to launder the entire democracy promotion regime change toolkit just in time for the 2020 election.
Tucker Carlson:
I mean, it’s almost beyond belief that this has happened. I mean, my own father worked for the US government in this business in the information war against the Soviet Union and was a big part of that. And the idea that any of those tools would be turned against American citizens by the US government, I think I want to think was absolutely unthinkable in say 1988. And you’re saying that there really hasn’t been anyone who’s raised objections and it’s absolutely turned inward to manipulate and rig our own elections as we would in say Latvia.
Mike Benz:
Yeah. Well, as soon as the democracy predicate was established, you had this professional class of professional regime change artists and operatives that is the same people who argued that we need to bring democracy to Yugoslavia, and that’s the predicate for getting rid of Milošević or any other country around the world where we basically overthrow governments in order to preserve democracy. Well, if the democracy threat is homegrown now, then that becomes, then suddenly these people all have new jobs moving on the US side, and I can go through a million examples of that. But one thing on what you just mentioned, which is that from their perspective, they just weren’t ready for the internet. 2016 was really the first time that social media had reached such maturity that it began to eclipse legacy media. I mean, this was a long time coming. I think folks saw this building from 2006 through 2016.
Internet 1.0 didn’t even have social media from 1991 to 2004, there was no social media at all. 2004, Facebook came out 2005, Twitter, 2006, YouTube 2007, the smartphone. And in that initial period of social media, nobody was getting subscriber ships at the level where they actually competed with legacy news media. But over the course of being so initially even these dissonant voices within the us, even though they may have been loud in moments, they never reached 30 million followers. They never reached a billion impressions a year type thing. As a uncensored mature ecosystem allowed citizen journalists and independent voices to be able to outcompete legacy news media. This induced a massive crisis both in our military and in our state department in intelligence services. I’ll give you a great example of this in 2019 at meeting of the German Marshall Fund, which is an institution that goes back to the US basically, I don’t want to say bribe, but essentially the soft power economic soft power projection in Europe as part of the reconstruction of European governments after World War ii, to be able to essentially pay them with Marshall Fund dollars and then in return, they basically were under our thumb in terms of how they reconstructed.
But the German Marshall Fund held a meeting in 2019. They held a million of these, frankly, but this was when a four star general got up on the panel and posed the question, what happens to the US military? What happens to the national security state when the New York Times is reduced to a medium sized Facebook page? And he posed this thought experiment as an example of we’ve had these gatekeepers, we’ve had these bumper cars on democracy in the form a century old relationship with legacy media institutions. I mean, our mainstream media is not in any shape or form even from its outset, independent from the national security state, from the state Department, from the war department, you had the initial, all of the initial broadcast news companies, NBC, ABC and CBS were all created by Office of War Information Veterans from the War department’s effort in World War ii.
You had these Operation Mockingbird relationships from the 1950s through the 1970s. Those continued through the use of the National Endowment for Democracy and the privatization of intelligence capacities in the 1980s under Reagan. There’s all sorts of CIA reading room memos you can read even on cia.gov about those continued media relations throughout the 1990s. And so you always had this backdoor relationship between the Washington Post, the New York Times, and all of the major broadcast media corporations. By the way, Rupert Murdoch and Fox are part of this as well. Rupert Murdoch was actually part of the National Endowment for Democracy Coalition in 1983 when it was as a way to do CIA operations in an aboveboard way after the Democrats were so ticked off at the CIA for manipulating student movements in the 1970s. But essentially there was no CIA intermediary to random citizen journalist accounts. There was no Pentagon backstop.
You couldn’t get a story killed. You couldn’t have this favors for favors relationship. You couldn’t promise access to some random person with 700,000 followers who’s got an opinion on Syrian gas. And so this induced, and this was not a problem for the initial period of social media from 2006 to 2014 because there were never dissident groups that were big enough to be able to have a mature enough ecosystem on their own. And all of the victories on social media had gone in the way of where the money was, which was from the State Department and the Defense Department and the intelligence services. But then as that maturity happened, you now had this situation after the 2016 election where they said, okay, now the entire international order might come undone. 70 years of unified foreign policy from Truman until Trump are now about to be broken.
And we need the same analog control systems. We had to be able to put bumper cars on bad stories or bad political movements through legacy media relationships and contacts we now need to establish and consolidate within the social media companies. And the initial predicate for that was Russiagate. But then after Russiagate died and they used a simple democracy promotion predicate, then it gave rise to this multi-billion dollar censorship industry that joins together the military industrial complex, the government, the private sector, the civil society organizations, and then this vast cobweb of media allies and professional fact checker groups that serve as this sort of sentinel class that surveys every word on the internet.
Tucker Carlson:
Thank you again for this almost unbelievable explanation of why this is happening. Can you give us an example of how it happens and just pick one among, I know countless examples of how the national security state lies to the population, censors the truth in real life.
Mike Benz:
Yeah, so we have this state department outfit called the Global Engagement Center, which was created by a guy named Rick Stengel who described himself as Obama’s propaganda in chief. He was the undersecretary for public affairs essentially, which is the liaison office role between the state department and the mainstream media. So this is basically the exact nexus where government talking points about war or about diplomacy or statecraft get synchronized with mainstream media.
Tucker Carlson:
May I add something to that as someone I know – Rick Stengel. He was at one point a journalist and Rick Stengel has made public arguments against the First Amendment and against Free Speech.
Mike Benz:
Yeah, he wrote a whole book on it and he published an op-Ed in 2019. He wrote a whole book on it and he made the argument that we just went over here that essentially the Constitution was not prepared for the internet and we need to get rid of the First Amendment accordingly. And he described himself as a free speech absolutist when he was the managing editor of Time Magazine. And even when he was in the State Department under Obama, he started something called the Global Engagement Center, which was the first government censorship operation within the federal government, but it was foreign facing, so it was okay. Now, at the time, they used the homegrown ISIS predicate threat for this. And so it was very hard to argue against the idea of the State Department having this formal coordination partnership with every major tech platform in the US because at the time there were these ISIS attacks that were, and we were told that ISIS was recruiting on Twitter and Facebook.
And so the Global Engagement Center was established essentially to be a state department entanglement with the social media companies to basically put bumper cars on their ability to platform accounts. And one of the things they did is they created a new technology, which it’s called Natural Language processing. It is a artificial intelligence machine learning ability to create meaning out of words in order to map everything that everyone says on the internet and create this vast topography of how communities are organized online, who the major influences are, what they’re talking about, what narratives are emerging or trending, and to be able to create this sort of network graph in order to know who to target and how information moves through an ecosystem. And so they began plotting the language, the prefixes, the suffixes, the popular terms, the slogans that ISIS folks were talking about on Twitter.
When Trump won the election in 2016, everyone who worked at the State Department was expecting these promotions to the White House National Security Council under Hillary Clinton, who I should remind viewers was also Secretary of State under Obama, actually ran the State Department. But these folks were all expecting promotions on November 8th, 2016 and were unceremoniously put out of jobs by a guy who was a 20 to one underdog according to the New York Times the day of the election. And when that happened, these State Department folks took their special set of skills, coercing governments for sanctions. The State Department led the effort to sanction Russia over the Crimea annexation. In 2014, these State Department diplomats did an international roadshow to pressure European governments to pass censorship laws to censor the right-wing populous groups in Europe and as a boomerang impact to censor populace groups who were affiliated in the us.
So you had folks who went from the state department directly, for example, to the Atlanta Council, which was this major facilitator between government to government censorship. The Atlanta Council is a group that is one of Biden’s biggest political backers. They bill themselves as NATO’s Think Tank. So they represent the political census of NATO. And in many respects, when NATO has civil society actions that they want to be coordinated to synchronize with military action or region, the Atlantic Council essentially is deployed to consensus build and make that political action happen within a region of interest to nato.
Now, the Atlantic Council has seven CIA directors on its board. A lot of people don’t even know that seven CIA directors are still alive, let alone all concentrated on the board of a single organization that’s kind of the heavyweight in the censorship industry. They get annual funding from the Department of Defense, the State Department, and CIA cutouts like the National Endowment for Democracy.
The Atlantic Council in January, 2017 moved immediately to pressure European governments to pass censorship laws to create a transatlantic flank tank on free speech in exactly the way that Rick Stengel essentially called for to have us mimic European censorship laws. One of the ways they did this was by getting Germany to pass something called Nets DG in August, 2017, which was essentially kicked off the era of automated censorship in the us. What Nets DG required was, unless social media platforms wanted to pay a $54 million fine for each instance of speech, each post left up on their platform for more than 48 hours that had been identified as hate speech, they would be fined basically into bankruptcy when you aggregate 54 million over tens of thousands of posts per day. And the safe haven around that was if they deployed artificial intelligence based censorship technologies, which had been again created by DARPA to take on ISIS to be able to scan and ban speech automatically.
And this gave rise to what I call these weapons of mass deletion. These are essentially the ability to sensor tens of millions of posts with just a few lines of code. And the way this is done is by aggregating basically the field of censorship science fuses together two disparate groups of study, if you will. There’s the sort of political and social scientists who are the sort of thought leaders of what should be censored, and then there are the sort of quants, if you will. These are the programmers, the computational data scientists, computational Linguistics University.
There’s over 60 universities now who get federal government grants to do the censorship work and the censorship preparation work where what they do is they create these code books of the language that people use the same way they did for isis. They did this, for example, with COVID. They created these COVID lexicons of what dissident groups were saying about mandates, about masks, about vaccines, about high profile individuals like Tony Fauci or Peter Daszak or any of these protected VIPs and individuals whose reputations had to be protected online.
And they created these code books, they broke things down into narratives. The Atlanta Council, for example, was a part of this government funded consortium, something called the Virality Project, which mapped 66 different narratives that dissidents we’re talking about around covid, everything from COVID origins to vaccine efficacy. And then they broke down these 66 claims into all the different factual sub claims. And then they plugged these into these essentially machine learning models to be able to have a constant world heat map of what everybody was saying about covid. And whenever something started trend that was bad for what the Pentagon wanted or was bad for what Tony Fauci wanted, they were able to take down tens of millions of posts. They did this in the 2020 election with mail-in ballots. It was the same. Wait,
Tucker Carlson:
There’s so much here and it’s so shocking. So you’re saying the Pentagon, our Pentagon, the US Department of Defense censored Americans during the 2020 election cycle?
Mike Benz:
Yes, they did this through the, so the two most censored events in human history, I would argue to date are the 2020 election and the COVID-19 pandemic, and I’ll explain how I arrived there.
So the 2020 election was determined by mail-in ballots, and I’m not weighing into the substance of whether mail-in ballots were or were not a legitimate or safe and reliable form of voting. That’s a completely independent topic from my perspective.
Then the censorship issue one, but the censorship of mail-in ballots is really one of the most extraordinary stories in our American history. I would argue what happened was is you had this plot within the Department of Homeland Security. Now this gets back to what we were talking about with the State Department’s Global Engagement Center. You had this group within the Atlanta Council and the Foreign Policy Establishment, which began arguing in 2017 for the need for a permanent domestic censorship government office to serve as a quarterback for what they called a whole of society counter misinformation, counter disinformation alliance.That just means censorship. To counter “miss-dis-info”. But their whole society model explicitly proposed that we need every single asset within society to be mobilized in a whole of society effort to stop misinformation online. It was that much of an existential threat to democracy, but they fixated in 2017 that it had to be centered within the government because only the government would have the clout and the coercive threat powers and the perceived authority to be able to tell the social media companies what to do to be able to summon a government funded NGO Swarm to create that media surround sound to be able to arm an AstroTurf army of fact checkers and to be able to liaise and connect all these different censorship industry actors into a cohesive unified hole. And the Atlantic Council initially proposed with this blueprint called Forward defense. “It’s not offense, it’s Forward Defense” guys.
They initially proposed that running this out of the State Department’s Global Engagement Center because they had so many assets there who were so effective at censorship under Rick Stengel, under the Obama administration. But they said, oh, we are not going to be able to get away with that. We don’t really have a national security predicate and it’s supposed to be foreign facing. We can’t really use that hook unless we have a sort of national security one. Then they contemplated parking it, the CIA, and they said, well, actually there’s two reasons we can’t do that. The is a foreign facing organization and we can’t really establish a counterintelligence threat to bring it home domestically. Also, we’re going to need essentially tens of thousands of people involved in this operation spanning this whole society model, and you can’t really run a clandestine operation that way. So they said, okay, well what about the FBI?
They said, well, the FBI would be great, it’s domestic, but the problem is is the FBI is supposed to be the intelligence arm of the Justice Department. And what we’re dealing with here are not acts of law breaking, it’s basically support for Trump. Or if a left winging popularist had risen to power like Bernie Sanders or Jeremy Corbin, I have no doubt they would’ve done in the UK. They would’ve done the same thing to him there. They targeted Jeremy Corbin and other left-wing populist NATO skeptical groups in Europe, but in the US it was all Trump.
And so essentially what they said is, well, the only other domestic intelligence equity we have in the US besides the FBI is the DHS. So we are going to essentially take the CIA’s power to rig and bribe foreign media organizations, which is the power they’ve had since the day they were born in 1947. And we’re going to combine that with the power with the domestic jurisdiction of the FBI by putting it at DHS. So DHS was basically deputized. It was empowered through this obscure little cybersecurity agency to have the combined powers that the CIA has abroad with the jurisdiction of the FBI at home. And the way they did this, how did a cyber, an obscure little cybersecurity agency get this power was they did a funny little series of switcheroos. So this little thing called CISA, they didn’t call it the Disinformation Governance Board. They didn’t call it the Censorship Agency. They gave it an obscure little name that no one would notice called the Cybersecurity and Infrastructure Security Agency (CISA) who his founder said, we care about security so much, it’s in our name twice. Everybody sort of closed their eyes and pretended that’s what it was. CISA was created by Active Congress in 2018 because of the perceived threat that Russia had hacked the 2016 election.And so we needed the cybersecurity power to be able to deal with that. And essentially on the heels of a CIA memo on January 6th, 2017 and a same day DHS executive order on January 6th, 2017, arguing that Russia had interfered in the 2016 election and a DHS mandate saying that elections are now critical infrastructure, you had this new power within DHS to say that cybersecurity attacks on elections are now our purview. And then they did two cute things. One they said said, miss dis and Malformation online are a form of cybersecurity attack. They are a cyber attack because they are happening online. And they said, well, actually Russian disinformation is we’re actually protecting democracy and elections. We don’t need a Russian predicate after Russiagate died. So just like that, you had this cybersecurity agency be able to legally make the argument that your tweets about mail-in ballots if you undermine public faith and confidence in them as a legitimate form of voting was now you were now conducting a cyber attack on US critical infrastructure articulating misinformation on Twitter and just like that.
Tucker Carlson:
Wait- in other words, complaining about election fraud is the same as taking down our power grid.
Mike Benz:
Yes, you could literally be on your toilet seat at nine 30 on a Thursday night and tweet, I think that mail-in ballots are illegitimate. And you were essentially then caught up in the crosshairs of the Department of Homeland Security classifying you as conducting a cyber attack on US critical infrastructure because you were doing misinformation online in the cyber realm. And misinformation is a cyber attack on democracy when it undermines public faith and confidence in our democratic elections and our democratic institutions, they would end up going far beyond that. They would actually define democratic institutions as being another thing that was a cybersecurity attack to undermine and lo and behold, the mainstream media is considered a democratic institution that would come later. What ended up happening was in the advance of the 2020 election, starting in April of 2020, although this goes back before you had this essentially never Trump NeoCon Republican DHS working with essentially NATO on the national security side and essentially the DNC, if you will, to use DHS as the launching point for a government coordinated mass censorship campaign spanning every single social media platform on earth in order to preens the ability to dispute the legitimacy of mail-in ballots.
And here’s how they did this. They aggregated four different institutions. Stanford University, the University of Washington, a company called Graphica and the Atlantic Council. Now all four of these institutions, the centers within them were essentially Pentagon cutouts you had at the Stanford Air Observatory. It was actually run by Michael McFaul, if you know Michael McFaul. He was the US ambassador to Russia under the Obama administration, and he personally authored a seven step playbook for how to successfully orchestrate a color revolution. And part of that involved maintaining total control over media and social media juicing up the civil society outfits, calling elections illegitimate in order to. Now, mind you, all of these people were professional Russia, Gators and professional election delegitimizes in 2016, and then I’ll get that in a sec. So Stanford, the Stanford Observatory under Michael McFaul was run by Alex Stamos, who was formerly a Facebook executive who coordinated with ODNI and with respect to Russiagate taking down Russian propaganda at Facebook.
So this is another liaison essentially to the national security state. And under Alex Stamos at Sanford Observatory was Renee Diresta, who started her career in the CIA and wrote the Senate Intelligence Committee report on Russian disinformation, and there’s a lot more there that I’ll get to another time. But the next institution was the University of Washington, which is essentially the Bill Gates University in Seattle who is headed by Kate Starboard, who is basically three generations of military brass who got our PhD in crisis informatics, essentially doing social media surveillance for the Pentagon and getting DARPA funding and working essentially with the national security state, then repurposed to take on mail-in ballots. The third firm Graphica got $7 million in Pentagon grants and got their start as part of the Pentagon’s Minerva initiative. The Minerva Initiative is the Psychological Warfare Research Center of the Pentagon. This group was doing social media spying and narrative mapping for the Pentagon until the 2016 election happened, and then were repurposed into a partnership with the Department of Homeland Security to censor 22 million Trump tweets, pro-Trump tweets about mail-in ballots.
And then the fourth institution, as I mentioned, was the Atlantic Council who’s got seven CIA directors on the board, so one after another. It is exactly what Ben Rhodes described during the Obama era as the blob, the Foreign Policy Establishment, it’s the Defense Department, the State Department or the CIA every single time. And of course this was because they were threatened by Trump’s foreign policy, and so while much of the censorship looks like it’s coming domestically, it’s actually by our foreign facing department of Dirty tricks, color revolution blob, who were professional government toppers who were then basically descended on the 2020 election.
Now they did this, they explicitly said the head of this election integrity partnership on tape and my foundation clipped them, and it’s been played before Congress and it’s a part of the Missouri Biden lawsuit now, but they explicitly said on tape that they were set up to do what the government was banned from doing itself, and then they articulated a multi-step framework in order to coerce all the tech companies to take censorship actions.
They said on tape that the tech companies would not have done it but for the pressure, which involved using threats of government force because they were the deputized arm of the government. They had a formal partnership with the DHS. They were able to use DHS’ proprietary domestic disinformation switchboard to immediately talk to top brass at all the tech companies for takedowns, and they bragged on tape about how they got the tech companies to all systematically adopt a new terms of service speech violation ban called delegitimization, which meant any tweet, any YouTube video, any Facebook post, any TikTok video, any discord posts, any Twitch video, anything on the internet that undermine public faith and confidence in the use of mail-in ballots or early voting drop boxes or ballot tabulation issues on election day was a prima fascia terms of service violation policy under this new delegitimization policy that they only adopted because of pass through government pressure from the election integrity partnership, which they bragged about on tape, including the grid that they used to do this, and simultaneously invoking threats of government breaking them up or government stopping doing favors for the tech companies unless they did this as well as inducing crisis PR by working with their media allies.
And they said DHS could not do that themselves. And so they set up this basically constellation of State Department, Pentagon and IC networks to run this censorship campaign, which by their own math had 22 million tweets on Twitter alone, and mind you, they just on 15 platforms, this is hundreds of millions of posts which were all scanned and banned or throttled so that they could not be amplified or they exist in a sort of limited state purgatory or had these frictions affixed to them in the form of fact-checking labels where you couldn’t actually click through the thing or you had to, it was an inconvenience to be able to share it. Now, they did this seven months before the election because at the time they were worried about the perceived legitimacy of a Biden victory in the case of a so-called Red Mirage Blue Shift event.
They knew the only way that Biden would win mathematically was through the disproportionate Democrat use of mail-in ballots. They knew there would be a crisis because it was going to look extremely weird if Trump looked like he won by seven states and then three days later it comes out actually the election switch, I mean that would put the election crisis of the Bush Gore election on a level of steroids that the National Security state said, well, the public will not be prepared for. So what we need to do is we need to in advance, we need to preens the ability to even question legitimacy.
Tucker Carlson:
Out, wait, wait, may I ask you to pause right there? Key influences by, so what you’re saying is what you’re suggesting is they knew the outcome of the election seven months before it was held.
Mike Benz:
It looks very bad.
Tucker Carlson:
Yes, Mike. It does look very bad
Mike Benz:
And especially when you combine this with the fact that this is right on the heels of the impeachment. The Pentagon led and the CIA led impeachment. It was Eric ? from the CIA, and it was Vindman from the Pentagon who led the impeachment of Trump in late 2019 over an alleged phone call around withholding Ukraine aid. This same network, which came straight out of the Pentagon hybrid warfare military censorship network, created after the first Ukraine crisis in 2014 were the lead architects of the Ukraine impeachment in 2019, and then essentially came back on steroids as part of the 2020 election censorship operation. But from their perspective, I mean it certainly looks like the perfect crime. These were the people. DHS at the time had actually federalized much of the National Election Administration through this January 6th, 2017 executive order from outgoing Obama. DHS had Jed Johnson, which essentially wrapped all 50 states up into a formal DHS partnership. So DHS was simultaneously in charge of the administration of the election in many respects, and the censorship of anyone who challenged the administration of the election. This is like putting essentially the defendant of a trial as the judge and jury of the trial. It was
Tucker Carlson:
Very, but you’re not describing democracy. I mean, you’re describing a country in which democracy is impossible.
Mike Benz:
What I’m essentially describing is military rule. I mean, what’s happened with the rise of the censorship industry is a total inversion of the idea of democracy itself. Democracy sort draws its legitimacy from the idea that it is ruled by consent of the people being ruled. That is, it’s not really being ruled by an overlord because the government is actually just our will expressed by our consent with who we vote for. The whole push after the 2016 election and after Brexit and after a couple of other social media run elections that went the wrong way from what the State Department wanted, like the 2016 Philippines election, was to completely invert everything that we described as being the underpinnings of a democratic society in order to deal with the threat of free speech on the internet. And what they essentially said is, we need to redefine democracy from being about the will of the voters to being about the sanctity of democratic institutions and who are the democratic institutions?
Oh, it’s the military, it’s NATO, it’s the IMF and the World Bank. It’s the mainstream media, it is the NGOs, and of course these NGOs are largely state department funded or IC funded. It’s essentially all of the elite establishments that were under threat from the rise of domestic populism that declared their own consensus to be the new definition of democracy. Because if you define democracy as being the strength of democratic institutions rather than a focus on the will of the voters, then what you’re left with is essentially democracy is just the consensus building architecture within the Democrat institutions themselves. And from their perspective, that takes a lot of work. I mean, the amount of work these people do. I mean, for example, we mentioned the Atlantic Council, which is one of these big coordinating mechanisms for the oil and gas industry in a region for the finance and the JP Morgans and the BlackRocks in a region for the NGOs in the region, for the media, in the region, all of these need to reach a consensus, and that process takes a lot of time, it takes a lot of work and a lot of negotiation from their perspective.
That’s democracy. Democracy is getting the NGOs to agree with BlackRock, to agree with the Wall Street Journal, to agree with the community and activist groups who are onboarded with respect to a particular initiative that is the difficult vote building process from their perspective.
At the end of the day, a bunch of populous groups decide that they like a truck driver who’s popular on TikTok more than the carefully constructed consensus of the NATO military brass. Well then from their perspective, that is now an attack on democracy, and this is what this whole branding effort was. And of course, democracy again has that magic regime change predicate where democracy is our magic watchword to be able to overthrow governments from the ground up in a sort of color revolution style whole of society effort to topple a democratically elected government from the inside, for example, as we did in Ukraine, Victor Jankovich was democratically elected by the Ukrainian people like him or hate him.
I’m not even issuing an opinion, but the fact is we color revolution him out of office. We January 6th out of office, actually, to be frank, I mean with respect to the, you had a state department funded right sector thugs and 5 billion worth of civil society money pumped into this to overthrow democratically elected government in the name of democracy, and they took that special set of skills home and now it’s here, perhaps potentially to stay. And this has fundamentally changed the nature of American governance because of the threat of one small voice becoming popular on social media.
Tucker Carlson:
May I ask you a question? So into that group of institutions that you say now define democracy, the NGOs foreign policy establishment, et cetera, you included the mainstream media. Now in 2021, the NSA broke into my private text apps and read them and then leaked them to the New York Times against me. That just happened again to me last week, and I’m wondering how common that is for the Intel agencies to work with so-called mainstream media like the New York Times to hurt their opponents.
Mike Benz:
Well, that is the function of these interstitial government funded non-governmental organizations and think tanks like for example, we mentioned the Atlantic Council, which is NATO’s think tank, but other groups like the Aspen Institute, which draws the lion’s share of its funding from the State department and other government agencies. The Aspen Institute was busted doing the same thing with the Hunter Biden laptop censorship. You had this strange situation where the FBI had advanced knowledge of the pending publication of the Hunter Biden laptop story, and then magically the Aspen Institute, which is run by essentially former CIA, former NSA, former FBI, and then a bunch of civil society organizations all hold a mass stakeholder censorship simulation, a three day conference, this came out and yo Roth was there. This is a big part of the Twitter file leaks, and it’s been mentioned in multiple congressional investigations.
But somehow the Aspen Institute, which is basically an addendum of the National Security state, got the exact same information that the National Security State spied on journalists and political figures to obtain, and not only leaked it, but then basically did a joint coordinated censorship simulator in September, two months before the election in order just like with the censorship of mail-in ballots to be in ready position to screens anyone online amplifying, wait a second, a news story that had not even broken yet.
Tucker Carlson:
The Aspen Institute, which is by the way, I’ve spent my life in Washington. It’s kind a, I mean Walter Isaacson formerly of Time Magazine ran it, former president of CNNI had no idea it was part of the national security state. I had no idea its funding came from the US government. This is the first time I’ve ever heard that. But given, assuming what you’re saying is true, it’s a little weird or starnge that Walter Isaacson left Aspens to write a biography of Elon Musk?
Mike Benz:
No? Yeah, I don’t know. I haven’t read that book. From what I’ve heard from people, it’s a relatively fair treatment. I just total speculation. But I suspect that Walter Isaacson has struggled with this issue and may not even firmly fall in one particular place in the sense that Walter Isaacson did a series of interviews of Rick Gel actually with the Atlantic Council and in other settings where he interviewed Rick Gel specifically on the issue of the need to get rid of the First Amendment and the threat that free speech on social media poses to democracy. Now, at the time, I was very concerned, this was between 2017 and 2019 when he did these Rick Stangle interviews. I was very concerned because Isaacson expressed what seemed to me to be a highly sympathetic view about the Rick Stengel perspective on killing the First Amendment. Now, he didn’t formally endorse that position, but it left me very skittish about Isaacson.
But what I should say is at the time, I don’t think very many people, in fact, I know virtually nobody in the country had any idea how deep the rabbit hole went when it came to the construction of the censorship industry and how deep the tentacles had grown within the military and the national security state in order to buoy and consolidate it. Much of that frankly did not even come to public light until even last year. Frankly, some of that was galvanized by Elon Musk’s acquisition and the Twitter files and the Republican turnover in the house that allowed these multiple investigations, the lawsuits like Missouri v Biden and the discovery process there and multiple other things like the Disinformation governance board, who, by the way, the interim head of that, the head of that Nina Janowitz got her start in the censorship industry from this exact same clandestine intelligence community censorship network created after the 2014 Crimea situation.
Nina Janowitz, when her name came up in 2022 as part of the disinformation governance board, I almost fell out of my chair because I had been tracking Nina’s network for almost five years at that point when her name came up as part of the UK inner cluster cell of a busted clandestine operation to censor of the internet called the Integrity Initiative, which was created by the UK Foreign Office and was backed by NATO’s Political Affairs Unit in order to carry out this thing that we talked about at the beginning of this dialogue, the NATO sort of psychological inoculation and the ability to kill, so-called Russian propaganda or rising political groups who wanted to maintain energy relations with Russia at a time when the US was trying to kill the Nord Stream and other pipeline relations. Well,
Well, Nina Janowitz was a part of this outfit, and then who was the head of it after Nina Janowitz went down, it was Michael Chertoff and Michael Chertoff was running the Aspen Institute Cyber Group. And then the Aspen Institute then goes on to be the censorship simulator for the Hunter Biden laptop story. And then two years later, Chertoff is then the head of the disinformation governance board after Nina is forced to step down.
Tucker Carlson:
Tucker Carlson: Of course, Michael Chertoff was the chairman of the largest military contractor in Europe, BAE military. So it’s all connected. You’ve blown my mind so many times in this conversation that I’m going to need a nap directly after it’s done. So I’ve just got two more questions for you, one short one, a little longer short. One is for people who’ve made it this far an hour in and want to know more about this topic. And by the way, I hope you’ll come back whenever you have the time to explore different threads of this story. But for people who want to do research on their own, how can your research on this be found on the internet?
Mike Benz:
Sure. So our foundation is foundation for freedom online.com. We publish all manner of reports on every aspect of the censorship industry from what we talked about with the role of the military industrial complex and the national security state to what the universities are doing to, I sometimes refer to as digital MK Ultra. There’s just the field of basically the science of censorship and the funding of these psychological manipulation methods in order to nudge people into different belief systems as they did with covid, as they did with energy. And every sensitive policy issue is what they essentially had an ambition for. But so my foundationforfreedomonline.com website is one way. The other way is just on X. My handle is at @MikeBenzCyber. I’m very active there and publish a lot of long form video and written content on all this. I think it’s one of the most important issues in the world today.
Tucker Carlson:
So it certainly is. And so that leads directly and seamlessly to my final question, which is about X. And I’m not just saying this because I post content there, but I think objectively it’s the last big platform that’s free or sort of free or more free. You post there too, but we’re at the very beginning of an election year with a couple of different wars unfolding simultaneously in 2024. So do you expect that that platform can stay free for the duration of this year?
Mike Benz:
It’s under an extraordinary amount of pressure, and that pressure is going to continue to mount as the election approaches. Elon Musk is a very unique individual, and he has a unique buffer, perhaps when it comes to the national security state because the national security state is actually quite reliant on Elon Musk properties, whether that’s for the electrical, the Green Revolution when it comes to Tesla and the battery technology there. When it comes to SpaceX, the State Department is hugely dependent on SpaceX because of its unbelievable sort of pioneering and saturating presence in the field of low earth orbit satellites that are basically how our telecom system runs to things like starlink. There are dependencies that the National Security state has on Elon Musk. I’m not sure he’d have as much room to negotiate if he had become the world’s richest man selling at a lemonade stand, and if the national security state goes too hard on him by invoking something like CFIUS to sort of nationalize some of these properties.
I think the shock wave that it would send to the international investor community would be irrecoverable at a time when we’re engaged in great power competition. So they’re trying to sort of induce, I think a sort of corporate regime change through a series of things involving a sort of death by a thousand paper cuts. I think there’s seven or eight different Justice Department or SEC or FTC investigations into Elon Musk properties that all started after his acquisition of X. But then what they’re trying to do right now is what I call the Transatlantic Flank Attack 2.0. We talked in this dialogue about how the censorship industry really got its start when a bunch of State Department exiles who were expecting promotions took their special set of skills in coercing European countries to pass sanctions on themselves, to cut off their own leg off to spite themselves in order to pass sanctions on Russia.
They ran back that same playbook with doing a roadshow for censorship instead for sanctions. We are now witnessing Transatlantic Flank attack 2.0, if you will, which is because they have lost a lot of their federal government powers to do this same censorship operation they had been doing from 2018 to 2022. In part because the house has totally turned on them, in part because of the media, in part because Missouri v Biden, which won a slam dunk case, actually banning government censorship at the trial court and appellate court levels. It is now before the Supreme Court, they’ve now moved into two strategies.
One of them is state level censorship laws. California just passed a new law, which the censorship industry totally drove from start to finish around, they call it platform accountability and transparency, which is basically forcing Elon Musk to give over the kind of narrative mapping data that these CIA conduits and Pentagon cutouts were using to create these weapons of mass deletion, these abilities to just censor everything at scale because they had all the internal platform data. Elon Musk took that away.
They’re using state laws like this new California law to crack that open. But the major threat right now is the threat from Europe with something called the EU Digital Services Act, which was cooked up in tandem with folks like NewsGuard, which has a board of Michael Hayden, head of the CIA NSA and a Fourstar General. Rick Stengel is on that board from the state department’s propaganda office. Tom Ridge is on that board from the Department of Homeland Security. Oh, and Anders Fogh Rasmussen – he was the general secretary of NATO under the Obama administration. So you have NATO, the CIA, the NSA four star General DHS, and the State Department working with the EU to craft the censorship laws that now are the largest existential threat to X other than potentially advertiser boycotts. Because there is now disinformation is now banned as a matter of law in the EU.
The EU is a bigger market for X than the us. There’s only 300 million in the USA. But there is 450 million people in Europe. X is now forced to comply with this brand new law that just got ratified this year where they either need to forfeit 6% of their global annual revenue to the EU to maintain operations there, or put in place essentially the kind of CIA bumper cars, if you will, that I’ve been describing over the course of this in order to have a internal mechanism to sensor anything that the eu, which is just a proxy for NATO deems to be disinformation. And you can bet with 65 elections around the globe this year, you can predict every single time what they’re going to define disinformation as. So that’s the main fight right now is dealing with the transatlantic flank attack from Europe.
Tucker Carlson:
This is just one of the most remarkable stories I’ve ever heard, and I’m grateful to you for bringing it to us. Mike Benz, executive director of the Foundation for Freedom Online, and I hope we see you again in
Mike Benz:
Thanks, Tucker.
Tucker Carlson:
Free speech is bigger than any one person or any one organization. Societies are defined by what they will not permit. What we’re watching is the total inversion of virtue.
* * *
Republished from the author’s Substack
Uncategorized
Mortgage rates fall as labor market normalizes
Jobless claims show an expanding economy. We will only be in a recession once jobless claims exceed 323,000 on a four-week moving average.
Share this:


Everyone was waiting to see if this week’s jobs report would send mortgage rates higher, which is what happened last month. Instead, the 10-year yield had a muted response after the headline number beat estimates, but we have negative job revisions from previous months. The Federal Reserve’s fear of wage growth spiraling out of control hasn’t materialized for over two years now and the unemployment rate ticked up to 3.9%. For now, we can say the labor market isn’t tight anymore, but it’s also not breaking.
The key labor data line in this expansion is the weekly jobless claims report. Jobless claims show an expanding economy that has not lost jobs yet. We will only be in a recession once jobless claims exceed 323,000 on a four-week moving average.
From the Fed: In the week ended March 2, initial claims for unemployment insurance benefits were flat, at 217,000. The four-week moving average declined slightly by 750, to 212,250
Below is an explanation of how we got here with the labor market, which all started during COVID-19.
1. I wrote the COVID-19 recovery model on April 7, 2020, and retired it on Dec. 9, 2020. By that time, the upfront recovery phase was done, and I needed to model out when we would get the jobs lost back.
2. Early in the labor market recovery, when we saw weaker job reports, I doubled and tripled down on my assertion that job openings would get to 10 million in this recovery. Job openings rose as high as to 12 million and are currently over 9 million. Even with the massive miss on a job report in May 2021, I didn’t waver.
Currently, the jobs openings, quit percentage and hires data are below pre-COVID-19 levels, which means the labor market isn’t as tight as it once was, and this is why the employment cost index has been slowing data to move along the quits percentage.

3. I wrote that we should get back all the jobs lost to COVID-19 by September of 2022. At the time this would be a speedy labor market recovery, and it happened on schedule, too
Total employment data
4. This is the key one for right now: If COVID-19 hadn’t happened, we would have between 157 million and 159 million jobs today, which would have been in line with the job growth rate in February 2020. Today, we are at 157,808,000. This is important because job growth should be cooling down now. We are more in line with where the labor market should be when averaging 140K-165K monthly. So for now, the fact that we aren’t trending between 140K-165K means we still have a bit more recovery kick left before we get down to those levels.

From BLS: Total nonfarm payroll employment rose by 275,000 in February, and the unemployment rate increased to 3.9 percent, the U.S. Bureau of Labor Statistics reported today. Job gains occurred in health care, in government, in food services and drinking places, in social assistance, and in transportation and warehousing.
Here are the jobs that were created and lost in the previous month:

In this jobs report, the unemployment rate for education levels looks like this:
- Less than a high school diploma: 6.1%
- High school graduate and no college: 4.2%
- Some college or associate degree: 3.1%
- Bachelor’s degree or higher: 2.2%

Today’s report has continued the trend of the labor data beating my expectations, only because I am looking for the jobs data to slow down to a level of 140K-165K, which hasn’t happened yet. I wouldn’t categorize the labor market as being tight anymore because of the quits ratio and the hires data in the job openings report. This also shows itself in the employment cost index as well. These are key data lines for the Fed and the reason we are going to see three rate cuts this year.
recession unemployment covid-19 fed federal reserve mortgage rates recession recovery unemploymentUncategorized
Inside The Most Ridiculous Jobs Report In History: Record 1.2 Million Immigrant Jobs Added In One Month
Inside The Most Ridiculous Jobs Report In History: Record 1.2 Million Immigrant Jobs Added In One Month
Last month we though that the January…
Share this:


Last month we though that the January jobs report was the "most ridiculous in recent history" but, boy, were we wrong because this morning the Biden department of goalseeked propaganda (aka BLS) published the February jobs report, and holy crap was that something else. Even Goebbels would blush.
What happened? Let's take a closer look.
On the surface, it was (almost) another blockbuster jobs report, certainly one which nobody expected, or rather just one bank out of 76 expected. Starting at the top, the BLS reported that in February the US unexpectedly added 275K jobs, with just one research analyst (from Dai-Ichi Research) expecting a higher number.
Some context: after last month's record 4-sigma beat, today's print was "only" 3 sigma higher than estimates. Needless to say, two multiple sigma beats in a row used to only happen in the USSR... and now in the US, apparently.

Before we go any further, a quick note on what last month we said was "the most ridiculous jobs report in recent history": it appears the BLS read our comments and decided to stop beclowing itself. It did that by slashing last month's ridiculous print by over a third, and revising what was originally reported as a massive 353K beat to just 229K, a 124K revision, which was the biggest one-month negative revision in two years!

Of course, that does not mean that this month's jobs print won't be revised lower: it will be, and not just that month but every other month until the November election because that's the only tool left in the Biden admin's box: pretend the economic and jobs are strong, then revise them sharply lower the next month, something we pointed out first last summer and which has not failed to disappoint once.
In the past month the Biden department of goalseeking stuff higher before revising it lower, has revised the following data sharply lower:
— zerohedge (@zerohedge) August 30, 2023
- Jobs
- JOLTS
- New Home sales
- Housing Starts and Permits
- Industrial Production
- PCE and core PCE
To be fair, not every aspect of the jobs report was stellar (after all, the BLS had to give it some vague credibility). Take the unemployment rate, after flatlining between 3.4% and 3.8% for two years - and thus denying expectations from Sahm's Rule that a recession may have already started - in February the unemployment rate unexpectedly jumped to 3.9%, the highest since February 2022 (with Black unemployment spiking by 0.3% to 5.6%, an indicator which the Biden admin will quickly slam as widespread economic racism or something).

And then there were average hourly earnings, which after surging 0.6% MoM in January (since revised to 0.5%) and spooking markets that wage growth is so hot, the Fed will have no choice but to delay cuts, in February the number tumbled to just 0.1%, the lowest in two years...

... for one simple reason: last month's average wage surge had nothing to do with actual wages, and everything to do with the BLS estimate of hours worked (which is the denominator in the average wage calculation) which last month tumbled to just 34.1 (we were led to believe) the lowest since the covid pandemic...

... but has since been revised higher while the February print rose even more, to 34.3, hence why the latest average wage data was once again a product not of wages going up, but of how long Americans worked in any weekly period, in this case higher from 34.1 to 34.3, an increase which has a major impact on the average calculation.

While the above data points were examples of some latent weakness in the latest report, perhaps meant to give it a sheen of veracity, it was everything else in the report that was a problem starting with the BLS's latest choice of seasonal adjustments (after last month's wholesale revision), which have gone from merely laughable to full clownshow, as the following comparison between the monthly change in BLS and ADP payrolls shows. The trend is clear: the Biden admin numbers are now clearly rising even as the impartial ADP (which directly logs employment numbers at the company level and is far more accurate), shows an accelerating slowdown.

But it's more than just the Biden admin hanging its "success" on seasonal adjustments: when one digs deeper inside the jobs report, all sorts of ugly things emerge... such as the growing unprecedented divergence between the Establishment (payrolls) survey and much more accurate Household (actual employment) survey. To wit, while in January the BLS claims 275K payrolls were added, the Household survey found that the number of actually employed workers dropped for the third straight month (and 4 in the past 5), this time by 184K (from 161.152K to 160.968K).

This means that while the Payrolls series hits new all time highs every month since December 2020 (when according to the BLS the US had its last month of payrolls losses), the level of Employment has not budged in the past year. Worse, as shown in the chart below, such a gaping divergence has opened between the two series in the past 4 years, that the number of Employed workers would need to soar by 9 million (!) to catch up to what Payrolls claims is the employment situation.

There's more: shifting from a quantitative to a qualitative assessment, reveals just how ugly the composition of "new jobs" has been. Consider this: the BLS reports that in February 2024, the US had 132.9 million full-time jobs and 27.9 million part-time jobs. Well, that's great... until you look back one year and find that in February 2023 the US had 133.2 million full-time jobs, or more than it does one year later! And yes, all the job growth since then has been in part-time jobs, which have increased by 921K since February 2023 (from 27.020 million to 27.941 million).

Here is a summary of the labor composition in the past year: all the new jobs have been part-time jobs!

But wait there's even more, because now that the primary season is over and we enter the heart of election season and political talking points will be thrown around left and right, especially in the context of the immigration crisis created intentionally by the Biden administration which is hoping to import millions of new Democratic voters (maybe the US can hold the presidential election in Honduras or Guatemala, after all it is their citizens that will be illegally casting the key votes in November), what we find is that in February, the number of native-born workers tumbled again, sliding by a massive 560K to just 129.807 million. Add to this the December data, and we get a near-record 2.4 million plunge in native-born workers in just the past 3 months (only the covid crash was worse)!

The offset? A record 1.2 million foreign-born (read immigrants, both legal and illegal but mostly illegal) workers added in February!

Said otherwise, not only has all job creation in the past 6 years has been exclusively for foreign-born workers...

... but there has been zero job-creation for native born workers since June 2018!

This is a huge issue - especially at a time of an illegal alien flood at the southwest border...

... and is about to become a huge political scandal, because once the inevitable recession finally hits, there will be millions of furious unemployed Americans demanding a more accurate explanation for what happened - i.e., the illegal immigration floodgates that were opened by the Biden admin.
Which is also why Biden's handlers will do everything in their power to insure there is no official recession before November... and why after the election is over, all economic hell will finally break loose. Until then, however, expect the jobs numbers to get even more ridiculous.


Walmart launches clever answer to Target’s new membership program


EyePoint poaches medical chief from Apellis; Sandoz CFO, longtime BioNTech exec to retire


Wendy’s has a new deal for daylight savings time haters


Watch Live: President Biden Reminds Americans Just How Good They’ve Got It Thanks To Him


Catastrophic Risk: Investing and Business Implications


Redefining Poverty: Towards a Transpartisan Approach


The Digest #187


Dropping Like a Stone: ON RRP Take‑up in the Second Half of 2023


Gather ’round the crystal ball: A multi-commodity outlook from PDAC 2024


Watch: President Biden Delivers The “Darkest, Most Un-American Speech Given By A President”
-

 Uncategorized2 weeks ago
All Of The Elements Are In Place For An Economic Crisis Of Staggering Proportions
-

 Uncategorized1 month ago
Cathie Wood sells a major tech stock (again)
-

 Uncategorized3 weeks ago
California Counties Could Be Forced To Pay $300 Million To Cover COVID-Era Program
-

 Uncategorized2 weeks ago
Apparel Retailer Express Moving Toward Bankruptcy
-

 Uncategorized3 weeks ago
Industrial Production Decreased 0.1% in January
-
International15 hours ago
Walmart launches clever answer to Target’s new membership program
-

 Uncategorized3 weeks ago
RFK Jr: The Wuhan Cover-Up & The Rise Of The Biowarfare-Industrial Complex
-

 Uncategorized3 weeks ago
GOP Efforts To Shore Up Election Security In Swing States Face Challenges