International
US Import Demand Is Dropping Off A Cliff
US Import Demand Is Dropping Off A Cliff
By Henry Byers of FreightWaves
The latest ocean container bookings data reveals that despite the…
Share this:


By Henry Byers of FreightWaves
The latest ocean container bookings data reveals that despite the strong levels of inbound cargo during the first five months of 2022, import demand is not just softening — it’s dropping off a cliff. Because capacity on the trans-Pacific has remained relatively stable, Drewry’s container spot rates from China to the West Coast have plunged 41% month-over-month to $9,630.
Freight forwarders will enjoy expanding margins on ocean freight, while U.S. trucking carriers and intermodal volume providers may start to see volume risks.
Consumer buying patterns are rapidly normalizing to pre-COVID levels, and U.S. retailers are stuck with too much inventory. Target shares dropped Tuesday morning after executives said the company would mark down unwanted items, cancel purchase orders and move quickly to get rid of excess inventory.
Container imports bound for the U.S. have dropped over 36% since May 24. (This index measures departing container volumes at the port of origin). This is a troubling sign for domestic U.S. freight markets that have been benefiting from an unprecedented surge of containerized import volumes over the last 18 months. Since ocean transit times for these inbound container volumes have recently been averaging between 30 and 35 days, we will begin seeing the softer volumes show up at U.S. ports in the first couple of weeks of July.
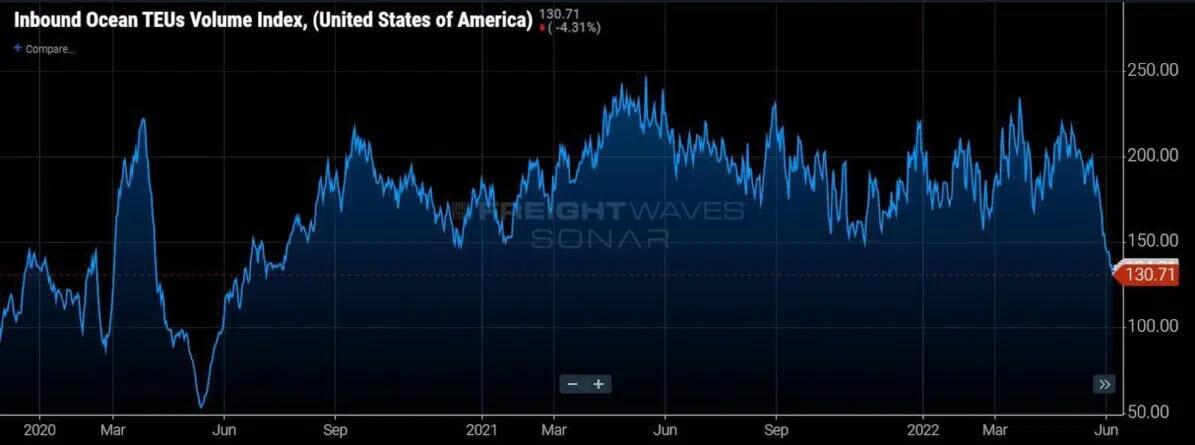
This also puts U.S. containerized imports from all countries of origin down 36% year-over-year, which is a reversion back to the volume levels of the summer of 2020. But what is the cause of the sudden drop in containerized import volumes? Well, there are a few simultaneous factors converging that serve as likely explanations for why volumes are suddenly dropping.
The inventory glut
At the forefront of these reasons is the buildup of inventory here in the U.S. resulting from companies attempting to both replenish inventories that were largely depleted in 2021, but also from these companies wanting to keep enough inventory on hand in case of any further disruptions that may occur. Consecutive rounds of COVID lockdowns in China only exacerbated those fears, but after the war between Russia and Ukraine broke out more than 100 days ago, the geopolitical risks seem to only be escalating, and for better or for worse, companies decided that they would rather have the inventory safely here in the U.S. than risk having it abroad should there be a sudden surge in consumer demand.

So, if consumers are now shifting buying trends from goods to services, those goods-producing companies may get stuck with too much inventory or the wrong inventory in order to try to capture sales. This buildup of inventory will inevitably lead to a slowdown in new import orders abroad and thus will only add to the demand destruction we are seeing for containerized imports into the U.S. Just Tuesday Target announced an “aggressive” inventory reduction plan led by canceling orders and marking down even more inventory.
The chart above, displaying rising inventories, and the chart below, displaying falling imports, reveal that retailers are upside down after the last surge of freight to hit the United States’ shores and are throttling down freight velocity in their networks.
The consumer is getting crushed
Conditions for the consumer seem to be getting worse and worse as inflation takes hold and prices get more and more expensive. Just this week, AAA reported a new record high for gasoline prices at $4.51 per gallon on its national index.
Some economists speculate that with the Fed beginning to raise rates and draw down its balance sheet, we may be experiencing “peak inflation.” However, even if inflationary pressures begin to ease, consumers may still be overexposed to rising interest rates through the use of credit in a way that could further deteriorate demand and discretionary spending.
Credit card spending has been accelerating at a time when personal savings rates have continued to decrease and move toward some of their lowest rates (last reading 4.4) since the Great Financial Crisis (4.5 in August 2009). There are two ways to read very low savings rates: either consumers are exceptionally confident and exuberantly spending their money or consumers are spending every last dollar they have in an attempt to keep their heads above water in a high-inflation environment. Either way, there isn’t any slack left in consumer wallets — it’s hard to imagine consumer spending growing from here.

Unfortunately, inflationary pressures in energy and food don’t know or care that American consumers are out of money — inflation in those sectors was caused by supply shocks, not artificially stimulated demand. It is also important to keep in mind that the rate of growth for the Producer Price Index has been outpacing the Consumer Price Index, so some producers may still be taking some hits from rising costs that have not yet been passed on to the consumer.

So even though total revolving credit outstanding is just at pre-pandemic levels, it is nonetheless accelerating, and if prices continue to rise, it is reasonable to expect that revolving credit outstanding will rise as well.

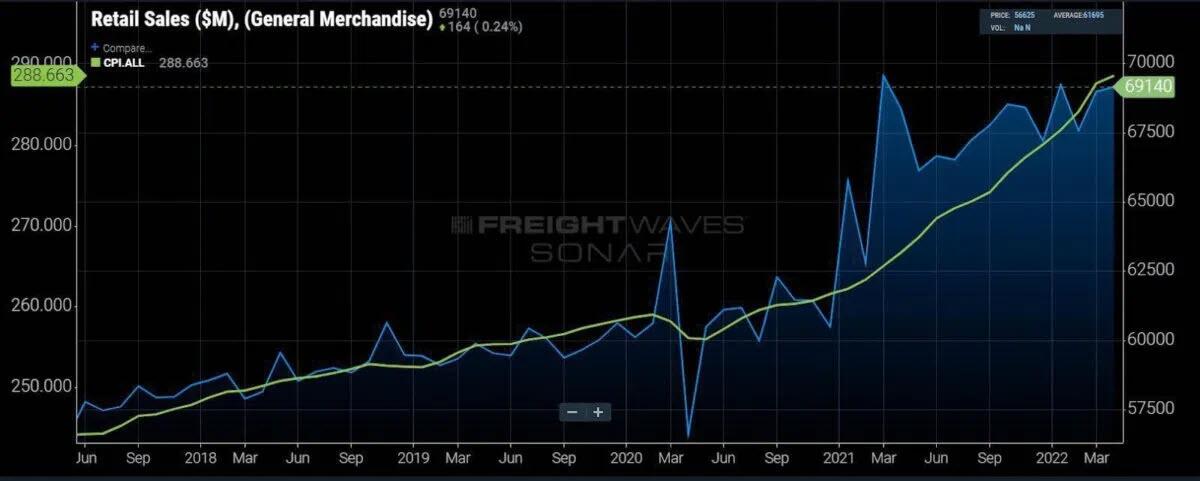
At first glance, one may look at retail sales (charted below) and conclude that they are growing, but keep in mind that the report is measured in nominal dollars unadjusted for inflation and represents increases in the prices of goods being sold — not so much the strength or resilience of consumers. Goods-producing companies will not be alone. Services and tech companies will also be under pressure in the coming months, and sell-offs could lead to layoffs.
As we see a growing number of signs pointing toward further demand destruction from U.S. consumers, and thus a further reversion of import container volumes back to levels closer to 2019, it is worth examining the trade lane that handles a majority of that volume: China to the U.S.
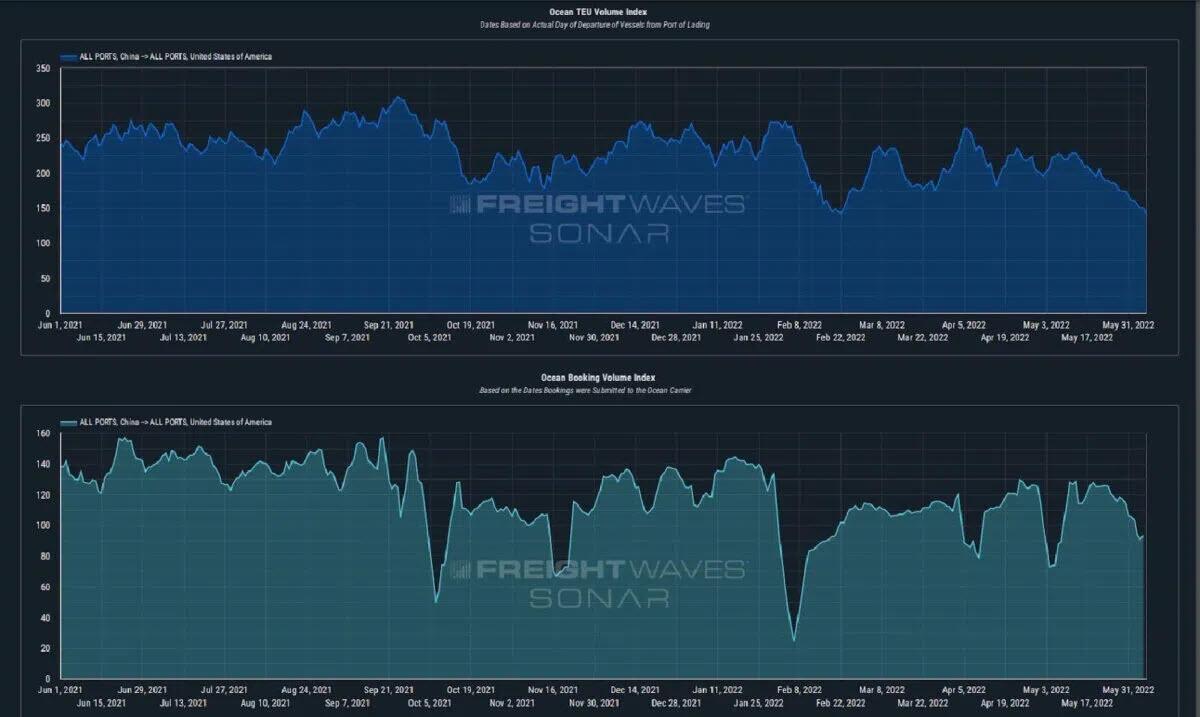
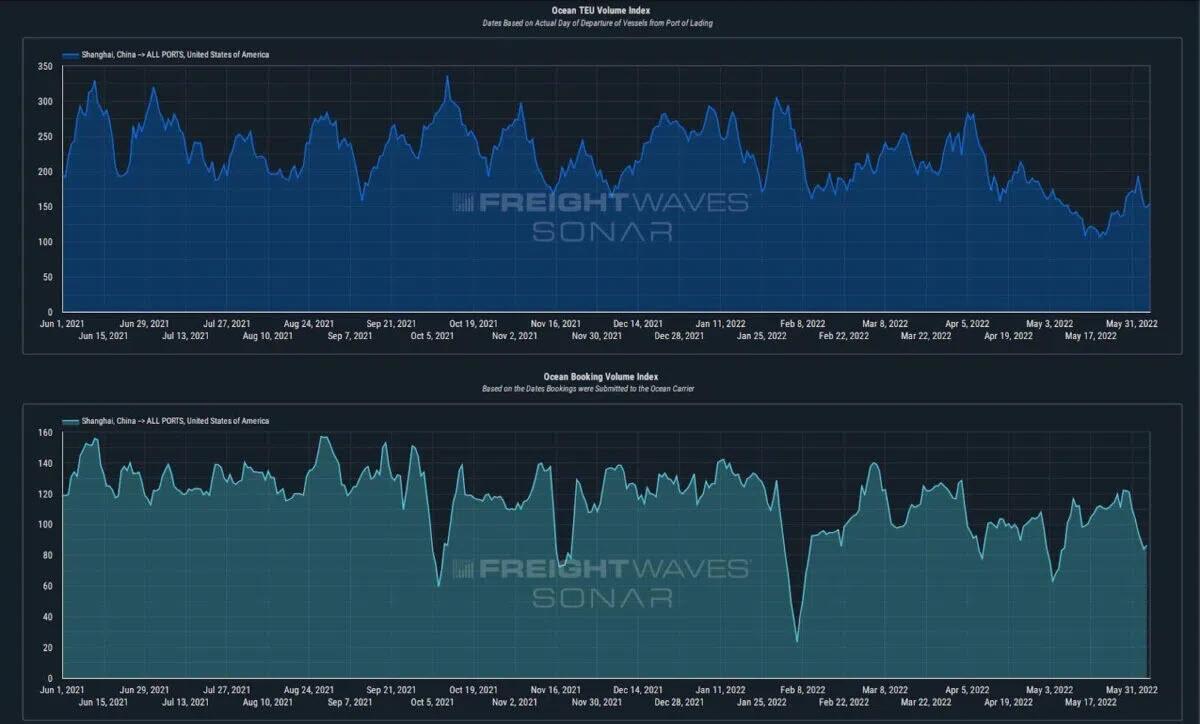
When looking at aggregated volumes from China to all U.S. ports, we are able to see that volumes have been declining from the “peak of peak season” in September 2021 through Tuesday (currently down 51% from that peak). While late March through the beginning of May is historically (pre-trade war/pre-pandemic) a softer period for volumes on this trade lane, it is important to realize that this decline in volumes has also been amplified by the COVID restrictions and lockdowns implemented by the Chinese government in Shanghai as well as other important manufacturing regions in China (most notably around Beijing and its major nearby port of Tianjin).
Despite the lockdowns, a decline in volumes on this major trade lane was seemingly inevitable in 2022 as the massive volumes moved between these two countries in 2021 were at unprecedented and unsustainable levels. Now some industry observers are calling for a “container surge” as China reopens, but it seems that the demand destruction has already spilled over into this trade lane in a big way.
The ‘container surge’ that never was
The “container surge” that many have been expecting from Shanghai (thought to be building during the lockdowns) appears to have mostly already been rerouted through the Port of Ningbo (yellow). With access to the Port of Shanghai being largely blocked due to landside restrictions (i.e., road closures), shippers were quick to reroute volumes through the closest alternate major port to the Port of Shanghai (red). Since the lockdowns began in Shanghai in late March, the decline in Shanghai new bookings (and thus load volumes) has been more than offset by a surge of volumes through Ningbo from rerouted containers. This led to booking lead times hitting their lowest levels on record as shippers scrambled to get their volumes moving.

Despite the reopening of Shanghai, total container volumes from China to the U.S. have continued their downward trajectory, and that trend is not likely to be reversed by an easing of COVID restrictions alone. As of the latest data points, if this is the “container surge” from Shanghai to U.S. ports upon its reopening last Wednesday, then right now, it is barely a “blip on the radar” compared to the volumes from Shanghai to the U.S. that what we have seen over the last 18 to 22 months. This could easily change within our bookings data for the weeks ahead, and if there is pent-up demand, it will undoubtedly show up in the bookings data, but as of Tuesday, it has not yet materialized in any significant way.
This steady decline in volumes from China to the U.S. has also put significant downward pressure on spot rates from the demand side. As capacity remained relatively consistent in the first few weeks post-lockdown (March 28 onward), the drop in volumes caused a decline in both the Freightos Baltic Daily Index and the Drewry World Container Index spot rates from China/East Asia to the U.S. West Coast (down 41% per FEU month-over-month [m/m] – $9,630), as well as from China/East Asia to the U.S. East Coast (down 36% per FEU m/m – $11,907). While this has been a welcome downturn in spot rates for shippers that battled the record-setting spot rates of 2021, we should also keep in mind that these spot rates remain elevated on a y/y basis (73% to the West Coast and 59% to the East Coast).

If bookings continue to soften through June, we expect to see spot rates on this trade lane decline further, but ocean carriers may go to greater lengths than ever before to try and protect their record-setting earnings. They have already been cutting capacity on major trade routes through measures such as blank sailings and reassigning vessels to other services, but if the decline in volumes accelerates in the weeks ahead, we may see the alliances test their strength and discipline like never before.
If rates start dropping quickly, it is reasonable to suspect that the ocean carriers that have not locked in a majority of their allocations in longer-term contracts may begin aggressively undercutting one another as they compete in the spot market.
Interestingly enough, the last port labor negotiations at LAX/LGB that caused disruptions to supply chains (and thus led to a buildup of inventory in the U.S.) in 2014-15 created a similar situation. Coming off of a record year, that may sound like an unlikely scenario, but there is a distinct possibility that sharply softening spot rates could cause a shakeup and/or reorganization of the current alliances.
Government
Analysts issue unexpected crude oil price forecast after surge
Here’s what a key investment firm says about the commodity.
Share this:


Oil is an asset defined by volatility.
U.S. crude prices stood above $60 a barrel in January 2020, just as the covid pandemic began. Three months later, prices briefly went negative, as the pandemic crushed demand.
By June 2022 the price rebounded all the way to $120, as fiscal and monetary stimulus boosted the economy. The price fell back to $80 in September 2022. Since then, it has bounced between about $65 and $90.
Over the past two months, the price has climbed 15% to $82 as of March 20.
Bullish factors for oil prices
The move stems partly from indications that economic growth this year will be stronger than analysts expected.
Related: The Fed rate decision won't surprise markets. What happens next might
Vanguard has just raised its estimate for 2024 U.S. GDP growth to 2% from 0.5%.
Meanwhile, China’s factory output and retail sales exceeded forecasts in January and February. That could boost oil demand in the country, the world's No. 1 oil importer.
Also, drone strokes from Ukraine have knocked out some of Russia’s oil refinery capacity. Ukraine has hit at least nine major refineries this year, erasing an estimated 11% of Russia’s production capacity, according to Bloomberg.
“Russia is a gas station with an army, and we intend on destroying that gas station,” Francisco Serra-Martins, chief executive of drone manufacturer Terminal Autonomy, told the news service. Gasoline, of course, is one of the products made at refineries.
Speaking of gas, the recent surge of oil prices has sent it higher as well. The average national price for regular gas totaled $3.52 per gallon Wednesday, up 7% from a month ago, according to the American Automobile Association. And we’re nearing the peak driving season.
Another bullish factor for oil: Iraq said Monday that it’s cutting oil exports by 130,000 barrels per day in coming months. Iraq produced much more oil in January and February than its OPEC (Organization of Petroleum Exporting Countries) target.
Citigroup’s oil-price forecast
Yet, not everyone is bullish on oil going forward. Citigroup analysts see prices falling through next year, Dow Jones’s Oil Price Information Service (OPIS) reports.
More Economic Analysis:
- Bond markets tell Fed rate story that stocks still ignore
- February inflation surprises with modest uptick, but core pressures ease
- Vanguard unveils bold interest rate forecast ahead of Fed meeting
The analysts note that supply is at risk in Israel, Iran, Iraq, Libya, and Venezuela. But Saudi Arabia, the UAE, Kuwait, and Russia could easily make up any shortfall.
Moreover, output should also rise this year and next in the U.S., Canada, Brazil, and Guyana, the analysts said. Meanwhile, global demand growth will decelerate, amid increased electric vehicle use and economic weakness.
Regarding refineries, the analysts see strong gains in capacity and capacity upgrades this year.
What if Donald Trump is elected president again? That “would likely be bearish for oil and gas," as Trump's policies could boost trade tension, crimping demand, they said.
The analysts made predictions for European oil prices, the world’s benchmark, which sat Wednesday at $86.
They forecast a 9% slide in the second quarter to $78, then a decline to $74 in the third quarter and $70 in the fourth quarter.
Next year should see a descent to $65 in the first quarter, $60 in the second and third, and finally $55 in the fourth, Citi said. That would leave the price 36% below current levels.
U.S. crude prices will trade $4 below European prices from the second quarter this year until the end of 2025, the analysts maintain.
Related: Veteran fund manager picks favorite stocks for 2024
stimulus economic growth pandemic dow jones stocks fed army trump gdp stimulus oil iran brazil canada european russia ukraine chinaInternational
Disney remote jobs: the most magical WFH careers on earth?
Disney employs hundreds of thousands of employees at its theme parks and elsewhere, but the entertainment giant also offers opportunities for remote w…
Share this:


The Walt Disney Co. (DIS) is a major entertainment and media company that operates amusement parks, produces movies and television shows, airs news and sports programs, and sells Mickey Mouse and Star Wars merchandise at its retail stores across the U.S.
While most of the jobs at the multinational entertainment conglomerate require working with people — such as at its theme parks, film-production facilities, cruise ships, or corporate offices — there are also opportunities for remote work at Disney. And while remote typically means working from home, with Disney, it could also mean working in a non-corporate office and being able to move from one location to another and conduct business outside normal working hours.
Related: Target remote jobs: What type of work and how much does it pay?
What remote jobs are available at Disney?
Many companies, including Disney, have called employees to return to the office for work in the wake of the COVID-19 pandemic, and the bulk of the company’s positions are forward-facing, meaning they involve meeting with clients and customers on a regular basis.
Still, there are some jobs at the “most magical company on earth” that are listed as remote and don’t require frequent in-person interaction with people, including opportunities in data entry and sales.
On Disney’s career website, there are limited positions available where the work is completely remote. One listing, for example, is for a “graphics interface coordinator covering sporting events.” This role involves working on nights, weekends, and holidays — times when corporate offices tend to be closed — and it may make sense for the company to hire people who can work from home or to travel and work in a location separate from the game venue.
Some of the senior roles that are shown on the website involve managers who can oversee remote teams, whether that be in sales or data. Sometimes, a supervisor overseeing staff who work outside corporate offices may be responsible for hiring freelancers who work remotely.
On the employment website Indeed, there are limited positions listed. A job listing for a manager in enterprise underwriting for a federal credit union indicates weekend duty, working outside of an 8 a.m. to 5 p.m. schedule, and being able to work in different locations. The listed annual salary range of $84,960 to $132,000, though, is well above the national annual average of around $50,000.
Internationally, Disney offers remote work in India, largely in the field of software development for its India-based streaming platform, Disney+ Hotstar.
The company also offers some hybrid schemes, which involve a mixture of in-office and remote work. For a mid-level animator position based in San Francisco, the role would involve being in the office and working from home occasionally.
How much do remote jobs at Disney pay?
Pay for remote jobs at Disney varies significantly based on location. A salary for a freelance artist in New York City, for example, may be higher than for the same job in Orlando, Florida.
Disney lists actual salary ranges in some of its job postings. For example, the yearly pay for a California-based compensation manager who works with clients is $129,000 to $165,000.
In an online search for “remote jobs at Disney,” results range from $30 to $39 an hour, for data entry, or $28.50 to $38 an hour for social media customer support.
How can I apply for remote jobs at Disney?
You can look for remote jobs on Disney's career site, and type “remote” in the search field. Listings may also appear on career-data websites, including Indeed and Glassdoor.
How many employees does Disney have?
In 2023, Disney employed about 225,000 people globally, of which around 77% were full-time, 16% part-time, and 7% seasonal. The majority of the workers, around 167,000, were in the U.S.
Disney says that a significant number of its employees, including many of those who work at its theme parks, along with most writers, directors, actors, and production personnel, belong to unions. It’s not immediately known how many remote workers at the company, if any, are union members.
india pandemic covid-19International
The Digest #194
Poor Charlie’s Almanack, Ben Graham, GAAP accounting, John Templeton, AI dystopia, Inflation, Bloomstran on Berkshire, Intuitive Surgical, The lessons…
Share this:


Poor Charlie’s Almanack
Poor Charlie’s Almanack: The Essential Wit and Wisdom of Charles T. Munger was first published in 2005 as a “coffee table” style book. It was beautifully presented but came with a high price tag. It was also heavy, somewhat unwieldy to read, and not very portable. The book’s format and price probably limited its reach.
Stripe Press published a new edition of the book shortly after Mr. Munger died last year at the age of ninety-nine. Amazon and other vendors instantly sold all available inventory. After waiting for three months, I finally received my copy last week.
Peter Kaufman is the editor of all editions of the book and I suspect that his main goal two decades ago was to honor Charlie Munger’s wisdom in a format that was not expected to “go viral.” In 2005, Charlie Munger was well known in the Berkshire Hathaway shareholder community and in the value investing world, but he was not as prominent as he became during his final decade. The clear purpose of the new edition is to disseminate his ideas as widely as possible.
The new edition is abridged to reduce repetitive content and I will withhold judgment about the wisdom of this abridgment until I finish reading the book. Since the heart of the book is comprised of speeches given by Charlie Munger, there are definitely cases where the same ideas are presented again and again.
Great books can be read many times while remaining highly relevant. I found this to be the case when I reread Charlie Munger’s Harvard School commencement address delivered in June 1986 when his youngest son was among the graduates. In the speech, Mr. Munger “inverts” the typical advice delivered in such speeches by explaining how the graduates should go about guaranteeing a life of failure and misery through time-tested strategies such as ingesting drugs and indulging in envy and resentment.
I am not sure how many graduates were convinced by Charlie Munger on that early summer day, but I suspect that most of them remember the speech because it was so unconventional. In contrast, I have no recollection of the commencement addresses when I graduated from high school or college, or even who the speaker was.
Articles
A Memorial for Charlie Munger by John Harvey Taylor, March 12, 2024. This is a brief account of a recent memorial service for Charlie Munger at Harvard-Westlake School. “We learned Sunday that someone once asked if he knew how to play the piano. ‘I don’t know,’ he said. ‘I’ve never tried.’ Yet he tried and finished so much in his century. Imagine what he is making of eternity.” (Episcopal Diocese of Los Angeles)
Benjamin Graham: Big Moments on the Way to Big Earnings, March 2024. Ben Graham’s granddaughter reflects on the challenges Graham experienced when he applied for college. “Most graduating seniors make their college plans in advance, but Ben Graham had no money for tuition. All through the long days of arduous farm labor, my grandfather dreamed of winning a Pulitzer Scholarship.” (Beyond Ben Graham)
Graham’s “Unpopular Large Caps” Part 2: Thoughts on Diversification by John Huber, March 19, 2024. “I would segment these ideas into two groups: core operating investments and bargain assets. In the former, you want to be very selective in picking a relatively small number of companies you intend to own for the long term. In the latter, you’d want to think like the insurance underwriter, buying as many as you can to ensure that the law of large numbers is on your side.” (Base Hit Investing)
Warren Buffett Minds the GAAP by Donald E. Graham, March 13, 2024. “I have a challenge for the FASB and the SEC: If you believe today’s accounting rules present a clearer picture of Berkshire’s results, put it to a test. Ask Berkshire’s shareholders if they prefer the present method of reporting earnings over the status quo ante. I don’t believe a single informed shareholder would say so. The rule is confusing and uninformative.” (WSJ)
- Berkshire Hathaway’s Distorted Quarterly Results, August 7, 2022. “Berkshire’s net income figure has been totally useless for analytical purposes since 2018. This is true on an annual basis and even more true on a quarterly basis.” (The Rational Walk)
Sir John Templeton: The Gentleman Bargain Hunter by Kingswell, March 12, 2024. “Templeton, who passed away in 2008, arrived on the investing scene with a series of uber-profitable contrarian bets in the early days of World War II — and continued to outwit Mr. Market with maddening consistency for the next several decades.” (Kingswell)
They Praised AI at SXSW—and the Audience Started Booing by Ted Gioia, March 19, 2024. Many recent innovations seem to have a dystopian aura. Apparently, this sentiment is not restricted to the usual luddites (old men shouting at clouds) but is shared by some of the attendees of SXSW. What seems cool to tech bros in Silicon Valley might not seem so cool to those outside tech culture. (The Honest Broker)
We Still Don’t Believe How Much Things Cost by Rachel Wolfe and Rachel Louise Ensign, March 12, 2024. People tend to focus on the aggregate amount of inflation over the past few years and interpreted transitory to mean that price spikes would reverse. Of course, politicians and economists only meant that the rate of inflation would decrease, not that prices would ever return to pre-pandemic levels. (WSJ)
My 2023 Apple Report Card by John Gruber, March 18, 2024. A solid report card overall from a widely read technology blog. (Daring Fireball)
Podcasts
Christopher Bloomstran on Buffett, Berkshire, Munger, and China, March 19, 2024. 1 hour, 1 minute. Video. Also be sure to check out the latest Semper Augustus client letter which has a lengthy section on Berkshire Hathaway. (Value After Hours)
Renaissance Technologies, March 18, 2024. 3 hours, 10 minutes. Notes. “Renaissance Technologies is the best performing investment firm of all time. And yet no one at RenTec would consider themselves an ‘investor’, at least in any traditional sense of the word. It’d rather be more accurate to call them scientists — scientists who’ve discovered a system of math, computers and artificial intelligence that has evolved into the greatest money making machine the world has ever seen.” (Acquired)
- Review of The Man Who Solved the Market, December 28, 2019 (Rational Walk)
Intuitive Surgical: Robotic Precision, March 20, 2024. 1 hour, 6 minutes. Transcript. “Intuitive creates robotic products to assist minimally invasive surgeries. Its Da Vinci system is a pioneer in this area as it increases the efficiency & accuracy of surgery and reduces the burden on the surgeons themselves.” (Business Breakdowns)
The Lessons of History (Will & Ariel Durant), March 18, 2023. 53 minutes. Notes. “In every age men have been dishonest and governments have been corrupt.” (Founders)
A Classicist Believes that Homer Directly Dictated the Iliad, and Was Also an Excellent Horseman, March 14, 2024. 53 minutes. “The Iliad is the world’s greatest epic poem—heroic battle and divine fate set against the Trojan War. Its beauty and profound bleakness are intensely moving, but great questions remain: Where, how, and when was it composed and why does it endure?” (History Unplugged)
Triumph of Achilles
Copyright, Disclosures, and Privacy Information
Nothing in this article constitutes investment advice and all content is subject to the copyright and disclaimer policy of The Rational Walk LLC. The Rational Walk is a participant in the Amazon Services LLC Associates Program, an affiliate advertising program designed to provide a means for sites to earn advertising fees by advertising and linking to Amazon.com.
china pandemic

Analysts issue unexpected crude oil price forecast after surge


Greenback Surges after BOJ Hikes and Ends YCC and RBA Delivers a Dovish Hold


Young People Aren’t Nearly Angry Enough About Government Debt


There Goes The Fed’s Inflation Target: Goldman Sees Terminal Rate 100bps Higher At 3.5%


Study: Life’s building blocks are surprisingly stable in Venus-like conditions


Bolsonaro Indicted By Brazilian Police For Falsifying Covid-19 Vaccine Records


IVI starts technology transfer to Biological E. Limited to manufacture oral cholera vaccine for India and global markets


Gates-backed PhIII study tuberculosis vaccine study gets underway


John Lewis relies too heavily on its heritage – here’s what it could do instead


Household Net Interest Income Falls As Rates Spike
-

 Spread & Containment1 week ago
IFM’s Hat Trick and Reflections On Option-To-Buy M&A
-

 Uncategorized4 weeks ago
All Of The Elements Are In Place For An Economic Crisis Of Staggering Proportions
-

 International2 weeks ago
EyePoint poaches medical chief from Apellis; Sandoz CFO, longtime BioNTech exec to retire
-

 Uncategorized1 month ago
California Counties Could Be Forced To Pay $300 Million To Cover COVID-Era Program
-

 Uncategorized4 weeks ago
Apparel Retailer Express Moving Toward Bankruptcy
-

 Uncategorized1 month ago
Industrial Production Decreased 0.1% in January
-

 International2 weeks ago
Walmart launches clever answer to Target’s new membership program
-

 Uncategorized1 month ago
RFK Jr: The Wuhan Cover-Up & The Rise Of The Biowarfare-Industrial Complex