US Corporations Are Filing For Bankruptcy At The Fastest Pace Since 2010
One would not know it from looking at the S&P which just hit a 2023 high, but there is a bit of a bankruptcy crisis sweeping the US where companies are filing for bankruptcy at the fastest pace in 13 years, in a clear sign of a tightening credit squeeze as interest rates rise and financial markets have locked out all but the strongest borrowers.
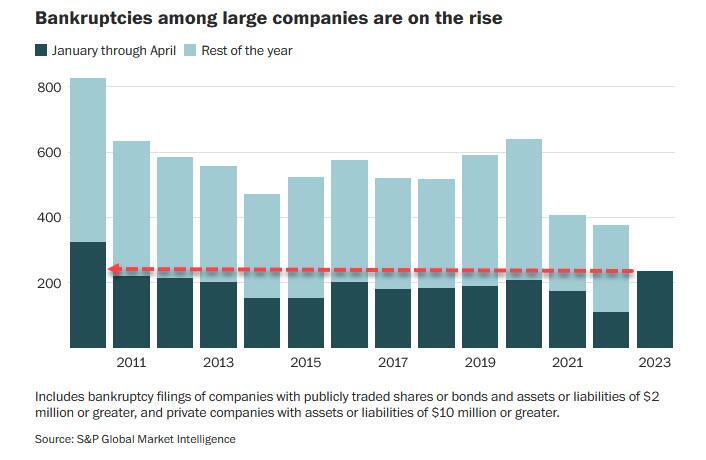
The increase is most visible among large companies, where there were 236 bankruptcy filings in the first four months of this year, more than double 2022 levels, and the fastest YTD pace since 2010 according to S&P Global Market Intelligence.
Several large recognizable companies with hundreds or thousands of workers have filed for bankruptcy protection in recent weeks, including Bed Bath & Beyond and Vice Media, although their financial troubles predated the recent economic turmoil.
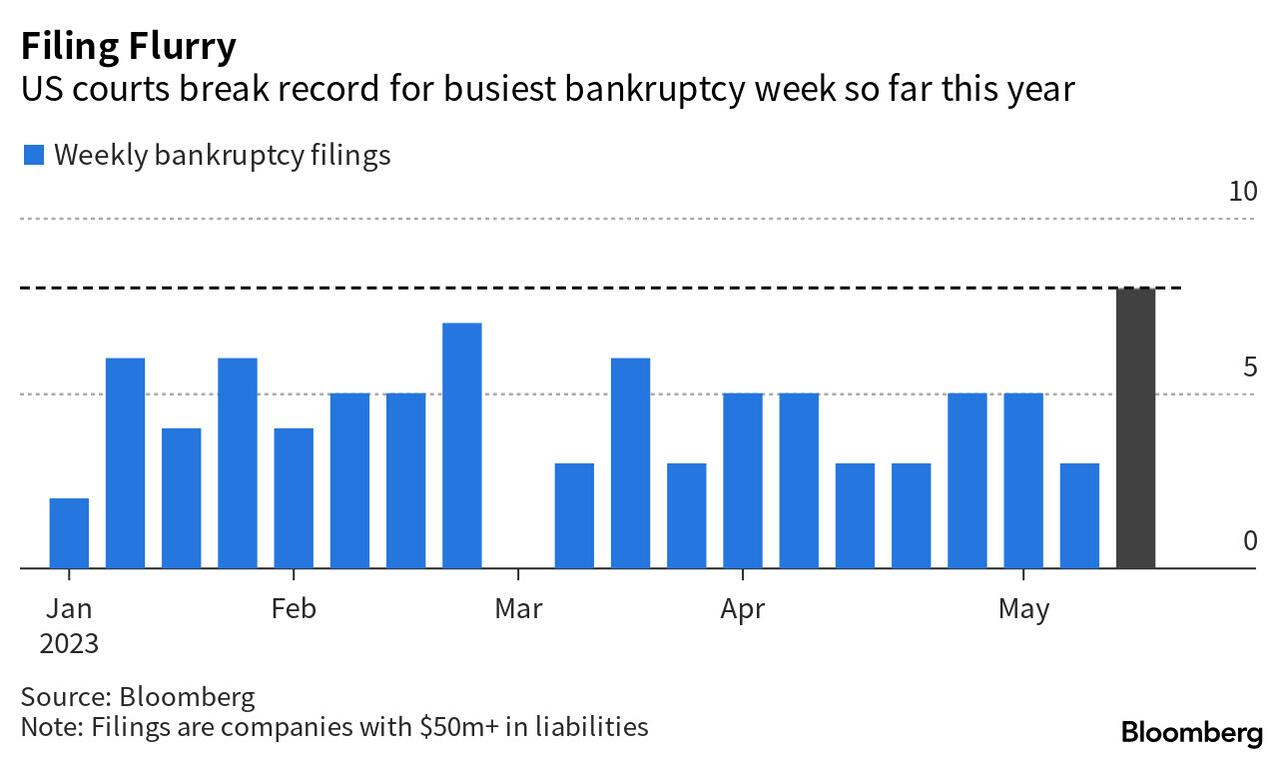
The bankruptcies did not slow down in May, when just the past week saw eight companies with more than $500 million in liabilities file for Chapter 11 bankruptcy, including five in a single 24-hour stretch last week, making this the busiest week for chapter 11 filings so far this year. In 2022 the monthly average was just over three filings.
Last week’s eight large filings, those with at least $50 million of liabilities, included those of now defunct woke "media empire" Vice Media, Envision Healthcare and Monitronics International. Prior to last week, the busiest seven-day stretch this year belonged to a week in late February that saw firms including Covid-19 testmaker Lucira Health, generic drugmaker Akorn and former SPAC Starry Group kick off insolvency proceedings
In total, twenty-seven large debtors have filed for bankruptcy so far in 2023 compared to 40 for all of 2022, according to figures compiled by bankruptcydata.com.
Among all types of companies, large and small, the increase in bankruptcies is somewhat more muted, with filings remaining below pre-pandemic levels and historic norms, according to Mark Zandi, chief economist at Moody’s Analytics. However filings, especially among large, unprofitable companies, are ramping at a frenzied pace as interest rates rise, pandemic-era government support dries up and sales growth slows amid a cooling economy.
There were about 16,200 bankruptcy filings among all types of companies in U.S. District Courts in the first quarter — up from 12,200 a year earlier, but still well below the 21,000-or-more-a-quarter in the pre-pandemic period, data from Moody’s Analytics shows. Even those pre-pandemic numbers were relatively low in historic terms, in part because low interest rates made it easy for companies to borrow.
Now, S&P Global forecasts that the 12-month trailing default rate for speculative-grade securities will jump from the current 2.5% to 4.5% by early 2024.
“The era of low interest rates and pandemic-related government support programs helped keep companies afloat that may have otherwise had few other options," S&P analysts said of their large-company data. “Now that interest rates are back to pre-Great Recession levels and pandemic support programs are largely over, we’re seeing a fresh uptick in a possible sign that companies are running out of time.”
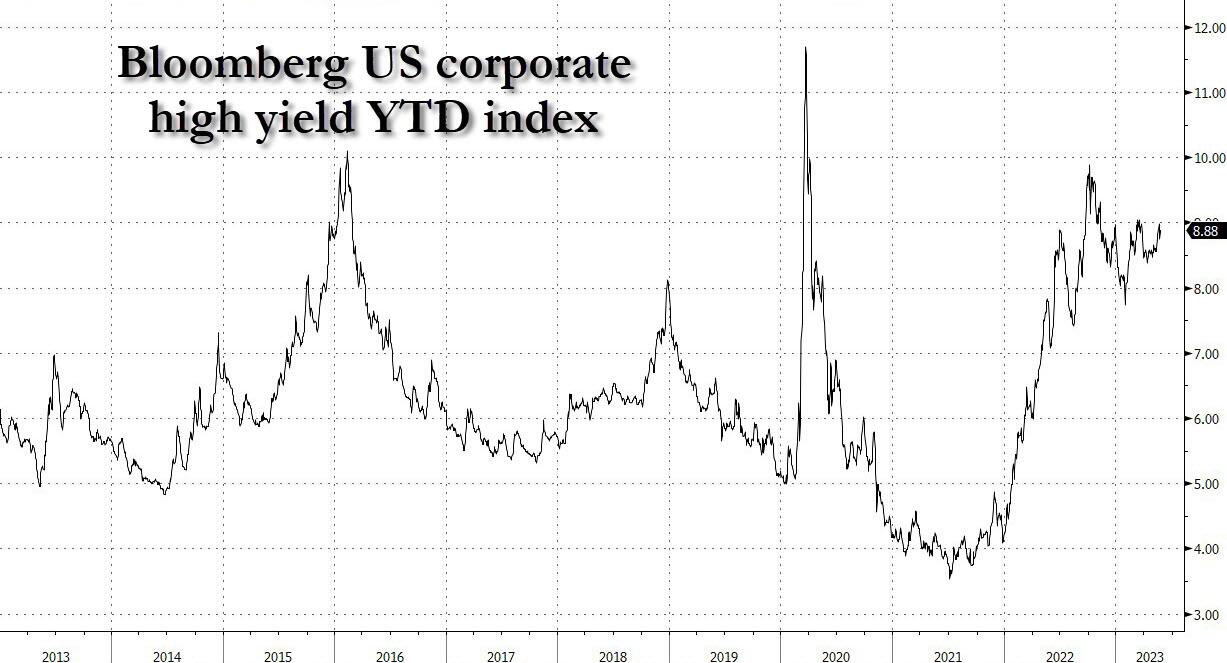
Yields on junk bonds have more than doubled from less than 4% in mid-2021, as measured by the Bloomberg US High Yield Index. The Fed has warned that lenders could further contract the supply of credit to businesses after recent turmoil in the banking sector.
“Our general view is that we are going to see an increase in ‘hard restructurings’, driven by the combination of higher debt levels from the borrowing binge of Covid and rising interest rates. The triggers will be running out money and inability to refinance maturing debt,” said Bill Derrough, an investment banker at Moelis who advises clients across distressed situations. “Some companies have used every trick in the book and now have run out of tricks.”
Companies that sell nonessential consumer items have been harder hit than other sectors as Americans curb their spending amid high inflation, S&P said. Plant-Based Pizza Boston, catalogue retailer AmeriMark Interactive and the Party City retail chain are among the recent casualties.
Last month, the dress retailer David’s Bridal filed for bankruptcy for the second time in 5 years, and said it was seeking a buyer, days after informing state labor departments that it planned to lay off more than 9,000 employees nationwide. The 70-year-old company said its business was weighed down by “the post-covid environment and uncertain economic conditions.”
Perhaps the most notable recent bankruptcy was that of long-struggling Bed Bath & Beyond, which filed for bankruptcy in late April, got a boost from the wave of consumer spending during the pandemic — when Americans spent more time at home. But when the economic climate shifted and stubbornly high inflation reduced discretionary purchases, the retailer’s fortunes tumbled.
Recent filings make clear how some large, indebted companies were clobbered by the end of easy money. A Vice Media bankruptcy filing last week disclosed that the company had been cash flow negative for several years, forcing it to borrow heavily to fund operations. As interest rates rose, it became costlier for Vice to refinance those loans. For a delightful read on the collapse of the faux-woke media empire, which at one point was valued by idiots at almost $6 billion, read the following FT report.
Turmoil in the banking business in March also contributed to a small rise in bankruptcy filings in that sector this year, S&P said. The most notable filing was SVB Financial Group, the parent company of Silicon Valley Bank, which collapsed after a run on the bank’s deposits.
Meet the Bitcoinetas, a fleet of transformative vehicles on a mission to spread the bitcoin message everywhere they go. From Argentina to South Africa,…
You may have seen that picture of Michael Saylor in a bitcoin-branded van, with a cheerful guy right next to the car door. This one:
Ariel Aguilar and La Bitcoineta European Edition at BTC Prague.
That car is the Bitcoineta European Edition, and the cheerful guy is Ariel Aguilar. Ariel is part of the European Bitcoineta team, and has previously driven another similar car in Argentina. In fact, there are currently five cars around the world that carry the name Bitcoineta (in some cases preceded with the Spanish definite article “La”).
Argentina: the original La Bitcoineta
The story of Bitcoinetas begins with the birth of 'La Bitcoineta' in Argentina, back in 2017. Inspired by the vibrancy of the South American Bitcoin community, the original Bitcoineta was conceived after an annual Latin American Conference (Labitconf), where the visionaries behind it recognized a unique opportunity to promote Bitcoin education in remote areas. Armed with a bright orange Bitcoin-themed exterior and a mission to bridge the gap in financial literacy, La Bitcoineta embarked on a journey to bring awareness of Bitcoin's potential benefits to villages and towns that often remained untouched by mainstream financial education initiatives. Operated by a team of dedicated volunteers, it was more than just a car; it was a symbol of hope and empowerment for those living on the fringes of financial inclusion.
The concept drawing for La Bitcoineta from December 2017.
Ariel was part of that initial Argentinian Bitcoineta team, and spent weeks on the road when the car became a reality. The original dream to bring bitcoin education even to remote areas within Argentina and other South American countries came true, and the La Bitcoineta team took part in dozens of local bitcoin meetups in the subsequent years.
The original La Bitcoineta from Argentina.
One major hiccup came in late 2018, when the car was crashed into while parked in Puerto Madryn. The car was pretty much destroyed, but since the team was possessed by a honey badger spirit, nothing could stop them from keeping true to their mission. It is a testament to the determination and resilience of the Argentinian team that the car was quickly restored and returned on its orange-pilling quest soon after.
Argentinian Bitcoineta after a major accident (no-one got hurt); the car was restored shortly after.
Over the more than 5 years that the Argentinian Bitcoineta has been running, it has traveled more than 80,000 kilometers - and as we’ll see further, it inspired multiple similar initiatives around the world.
In early 2021, the president of El Salvador passed the Bitcoin Law, making bitcoin legal tender in the country. The Labitconf team decided to celebrate this major step forward in bitcoin adoption by hosting the annual conference in San Salvador, the capital city of El Salvador. And correspondingly, the Argentinian Bitcoineta team made plans for a bold 7000-kilometer road trip to visit the Bitcoin country with the iconic Bitcoin car.
However, it proved to be impossible to cross so many borders separating Argentina and Salvador, since many governments were still imposing travel restrictions due to a Covid pandemic. So two weeks before the November event, the Labitconf team decided to fund a second Bitcoineta directly in El Salvador, as part of the Bitcoin Beach circular economy. Thus the second Bitcoineta was born.
Salvadoran’s Bitcoineta operates in the El Zonte region, where the Bitcoin Beach circular economy is located.
The eye-catching Volkswagen minibus has been donated to the Bitcoin Beach team, which uses the car for the needs of its circular economy based in El Zonte.
Late 2021 saw one other major development in terms of grassroots bitcoin adoption. On the other side of the planet, in South Africa, Hermann Vivier initiated the Bitcoin Ekasi project. “Ekasi” is a colloquial term for a township, and a township in the South African context is an underdeveloped urban area with a predominantly black population, a remnant of the segregationist apartheid regime. Bitcoin Ekasi emerged as an attempt to introduce bitcoin into the economy of the JCC Camp township located in Mossel Bay, and has gained a lot of success on that front.
Bitcoin Ekasi was in large part inspired by the success of the Bitcoin Beach circular economy back in El Salvador, and the respect was mutual. The Bitcoin Beach team thus decided to pass on the favor they received from the Argentinian Bitcoineta team, and provided funds to Bitcoin Ekasi for them to build a Bitcoineta of their own.
Bitcoin Ekasi’s Bitcoineta as seen at the Adopting Bitcoin Cape Town conference.Bitcoin Ekasi’s Bitcoineta as seen at the Adopting Bitcoin Cape Town conference. Hermann Vivier is seen in the background. South African Bitcoineta serves the needs of Bitcoin Ekasi, a local bitcoin circular economy in the JCC Camp township.
Bitcoin Ekasi emerged as a sister organization of Surfer Kids, a non-profit organization with a mission to empower marginalized youths through surfing. The Ekasi Bitcoineta thus partially serves as a means to get the kids to visit various surfer competitions in South Africa. A major highlight in this regard was when the kids got to meet Jordy Smith, one of the most successful South African surfers worldwide.
Coincidentally, South African surfers present an intriguing demographic for understanding Bitcoin due to their unique circumstances and needs. To make it as a professional surfer, the athletes need to attend competitions abroad; but since South Africa has tight currency controls in place, it is often a headache to send money abroad for travel and competition expenses. The borderless nature of Bitcoin offers a solution to these constraints, providing surfers with an alternative means of moving funds across borders without any obstacles.
Photo taken at the South African Junior Surfing Championships 2023. Back row, left to right:
Mbasa, Chuma, Jordy Smith, Sandiso. Front, left to right: Owethu, Sibulele.
To find out more about Bitcoineta South Africa and the non-profit endeavors it serves, watch Lekker Feeling, a documentary by Aubrey Strobel:
The European Bitcoineta started its journey in early 2023, with Ariel Aguilar being one of the main catalysts behind the idea. Unlike its predecessors in El Salvador and South Africa, the European Bitcoineta was not funded by a previous team but instead secured support from individual donors, reflecting a grassroots approach to spreading financial literacy.
European Bitcoineta sports a hard-to-overlook bitcoin logo along with the message “Bitcoin is Work. Bitcoin is Time. Bitcoin is Hope.”
The European Bitcoineta is a Mercedes box van adorned with a prominent Bitcoin logo and inspiring messages, and serves as a mobile hub for education and discussion at numerous European Bitcoin conferences and local meetups. Inside its spacious interior, both notable bitcoiners and bitcoin plebs share their insights on the walls, fostering a sense of camaraderie and collaboration.
Inside the European Bitcoineta, one can find the wall of fame, where visitors can read messages from prominent bitcoiners such as Michael Saylor, Uncle Rockstar, Javier Bastardo, Hodlonaut, and many others.On the “pleb wall”, any bitcoiner can share their message (as long as space permits).
Introduced in December 2023 at the Africa Bitcoin Conference in Ghana, the fifth Bitcoineta was donated to the Ghanaian Bitcoin Cowries educational initiative as part of the Trezor Academy program.
Bitcoineta West Africa was launched in December 2023 at the Africa Bitcoin Conference. Among its elements, it bears the motto of the Trezor Academy initiative: Bitcoin. Education. Freedom.
Bitcoineta West Africa was funded by the proceeds from the bitcoin-only limited edition Trezor device, which was sold out within one day of its launch at the Bitcoin Amsterdam conference.
With plans for an extensive tour spanning Ghana, Togo, Benin, Nigeria, and potentially other countries within the ECOWAS political and economic union, Bitcoineta West Africa embodies the spirit of collaboration and solidarity in driving Bitcoin adoption and financial inclusion throughout the Global South.
Bitcoineta West Africa surrounded by a group of enthusiastic bitcoiners at the Black Star Square, Accra, Ghana.
All the Bitcoineta cars around the world share one overarching mission: to empower their local communities through bitcoin education, and thus improve the lives of common people that might have a strong need for bitcoin without being currently aware of such need. As they continue to traverse borders and break down barriers, Bitcoinetas serve as a reminder of the power of grassroots initiatives and the importance of financial education in shaping a more inclusive future. The tradition of Bitcoinetas will continue to flourish, and in the years to come we will hopefully encounter a brazenly decorated bitcoin car everywhere we go.
If the inspiring stories of Bitcoinetas have ignited a passion within you to make a difference in your community, we encourage you to take action! Reach out to one of the existing Bitcoineta teams for guidance, support, and inspiration on how to start your own initiative. Whether you're interested in spreading Bitcoin education, promoting financial literacy, or fostering empowerment in underserved areas, the Bitcoineta community is here to help you every step of the way. Together, we will orange pill the world!
This is a guest post by Josef Tetek. Opinions expressed are entirely their own and do not necessarily reflect those of BTC Inc or Bitcoin Magazine.
Over the last few years, digital currencies and gold have become decent barometers of speculative investor appetite. Such isn’t surprising given the evolution…
Over the last few years, digital currencies and gold have become decent barometers of speculative investor appetite. Such isn’t surprising given the evolution of the market into a “casino” following the pandemic, where retail traders have increased their speculative appetites.
“Such is unsurprising, given that retail investors often fall victim to the psychological behavior of the “fear of missing out.” The chart below shows the “dumb money index” versus the S&P 500. Once again, retail investors are very long equities relative to the institutional players ascribed to being the “smart money.””
“The difference between “smart” and “dumb money” investors shows that, more often than not, the “dumb money” invests near market tops and sells near market bottoms.”
That enthusiasm has increased sharply since last November as stocks surged in hopes that the Federal Reserve would cut interest rates. As noted by Sentiment Trader:
“Over the past 18 weeks, the straight-up rally has moved us to an interesting juncture in the Sentiment Cycle. For the past few weeks, the S&P 500 has demonstrated a high positive correlation to the ‘Enthusiasm’ part of the cycle and a highly negative correlation to the ‘Panic’ phase.”
That frenzy to chase the markets, driven by the psychological bias of the “fear of missing out,” has permeated the entirety of the market. As noted in “This Is Nuts:”
“Since then, the entire market has surged higher following last week’s earnings report from Nvidia (NVDA). The reason I say “this is nuts” is the assumption that all companies were going to grow earnings and revenue at Nvidia’s rate. There is little doubt about Nvidia’s earnings and revenue growth rates. However, to maintain that growth pace indefinitely, particularly at 32x price-to-sales, means others like AMD and Intel must lose market share.”
Of course, it is not just a speculative frenzy in the markets for stocks, specifically anything related to “artificial intelligence,” but that exuberance has spilled over into gold and cryptocurrencies.
Birds Of A Feather
There are a couple of ways to measure exuberance in the assets. While sentiment measures examine the broad market, technical indicators can reflect exuberance on individual asset levels. However, before we get to our charts, we need a brief explanation of statistics, specifically, standard deviation.
“Like a rubber band that has been stretched too far – it must be relaxed in order to be stretched again. This is exactly the same for stock prices that are anchored to their moving averages. Trends that get overextended in one direction, or another, always return to their long-term average. Even during a strong uptrend or strong downtrend, prices often move back (revert) to a long-term moving average.”
The idea of “stretching the rubber band” can be measured in several ways, but I will limit our discussion this week to Standard Deviation and measuring deviation with “Bollinger Bands.”
“Standard Deviation” is defined as:
“A measure of the dispersion of a set of data from its mean. The more spread apart the data, the higher the deviation. Standard deviation is calculated as the square root of the variance.”
In plain English,this meansthat the further away from the average that an event occurs, the more unlikely it becomes. As shown below, out of 1000 occurrences, only three will fall outside the area of 3 standard deviations. 95.4% of the time, events will occur within two standard deviations.
A second measure of “exuberance” is “relative strength.”
“In technical analysis, the relative strength index (RSI) is a momentum indicator that measures the magnitude of recent price changes to evaluate overbought or oversold conditions in the price of a stock or other asset. The RSI is displayed as an oscillator (a line graph that moves between two extremes) and can read from 0 to 100.
Traditional interpretation and usage of the RSI are that values of 70 or above indicate that a security is becoming overbought or overvalued and may be primed for a trend reversal or corrective pullback in price. An RSI reading of 30 or below indicates an oversold or undervalued condition.” – Investopedia
With those two measures, let’s look at Nvidia (NVDA), the poster child of speculative momentum trading in the markets. Nvidia trades more than 3 standard deviations above its moving average, and its RSI is 81. The last time this occurred was in July of 2023 when Nvidia consolidated and corrected prices through November.
Interestingly, gold also trades well into 3 standard deviation territory with an RSI reading of 75. Given that gold is supposed to be a “safe haven” or “risk off” asset, it is instead getting swept up in the current market exuberance.
The same is seen with digital currencies. Given the recent approval of spot, Bitcoin exchange-traded funds (ETFs), the panic bid to buy Bitcoin has pushed the price well into 3 standard deviation territory with an RSI of 73.
In other words, the stock market frenzy to “buy anything that is going up” has spread from just a handful of stocks related to artificial intelligence to gold and digital currencies.
It’s All Relative
We can see the correlation between stock market exuberance and gold and digital currency, which has risen since 2015 but accelerated following the post-pandemic, stimulus-fueled market frenzy. Since the market, gold and cryptocurrencies, or Bitcoin for our purposes, have disparate prices, we have rebased the performance to 100 in 2015.
Gold was supposed to be an inflation hedge. Yet, in 2022, gold prices fell as the market declined and inflation surged to 9%. However, as inflation has fallen and the stock market surged, so has gold. Notably, since 2015, gold and the market have moved in a more correlated pattern, which has reduced the hedging effect of gold in portfolios. In other words, during the subsequent market decline, gold will likely track stocks lower, failing to provide its “wealth preservation” status for investors.
The same goes for cryptocurrencies. Bitcoin is substantially more volatile than gold and tends to ebb and flow with the overall market. As sentiment surges in the S&P 500, Bitcoin and other cryptocurrencies follow suit as speculative appetites increase. Unfortunately, for individuals once again piling into Bitcoin to chase rising prices, if, or when, the market corrects, the decline in cryptocurrencies will likely substantially outpace the decline in market-based equities. This is particularly the case as Wall Street can now short the spot-Bitcoin ETFs, creating additional selling pressure on Bitcoin.
Just for added measure, here is Bitcoin versus gold.
Not A Recommendation
There are many narratives surrounding the markets, digital currency, and gold. However, in today’s market, more than in previous years, all assets are getting swept up into the investor-feeding frenzy.
Sure, this time could be different. I am only making an observation and not an investment recommendation.
However, from a portfolio management perspective, it will likely pay to remain attentive to the correlated risk between asset classes. If some event causes a reversal in bullish exuberance, cash and bonds may be the only place to hide.
BUFFALO, NY- March 11, 2024 – Impact Journals publishes scholarly journals in the biomedical sciences with a focus on all areas of cancer and aging research. Aging is one of the most prominent journals published by Impact Journals.
Credit: Impact Journals
BUFFALO, NY- March 11, 2024 – Impact Journals publishes scholarly journals in the biomedical sciences with a focus on all areas of cancer and aging research. Aging is one of the most prominent journals published by Impact Journals.
Impact Journals will be participating as an exhibitor at the American Association for Cancer Research (AACR) Annual Meeting 2024 from April 5-10 at the San Diego Convention Center in San Diego, California. This year, the AACR meeting theme is “Inspiring Science • Fueling Progress • Revolutionizing Care.”
Visit booth #4159 at the AACR Annual Meeting 2024 to connect with members of the Agingteam.
About Aging-US:
Agingpublishes research papers in all fields of aging research including but not limited, aging from yeast to mammals, cellular senescence, age-related diseases such as cancer and Alzheimer’s diseases and their prevention and treatment, anti-aging strategies and drug development and especially the role of signal transduction pathways such as mTOR in aging and potential approaches to modulate these signaling pathways to extend lifespan. The journal aims to promote treatment of age-related diseases by slowing down aging, validation of anti-aging drugs by treating age-related diseases, prevention of cancer by inhibiting aging. Cancer and COVID-19 are age-related diseases.
Agingis indexed and archived byPubMed/Medline (abbreviated as “Aging (Albany NY)”), PubMed Central, Web of Science: Science Citation Index Expanded (abbreviated as “Aging‐US” and listed in the Cell Biology and Geriatrics & Gerontology categories), Scopus (abbreviated as “Aging” and listed in the Cell Biology and Aging categories), Biological Abstracts, BIOSIS Previews, EMBASE, META (Chan Zuckerberg Initiative) (2018-2022), and Dimensions (Digital Science).
Please visit our website at www.Aging-US.com and connect with us:
We use cookies on our website to give you the most relevant experience by remembering your preferences and repeat visits. By clicking “Accept”, you consent to the use of ALL the cookies.
This website uses cookies to improve your experience while you navigate through the website. Out of these, the cookies that are categorized as necessary are stored on your browser as they are essential for the working of basic functionalities of the website. We also use third-party cookies that help us analyze and understand how you use this website. These cookies will be stored in your browser only with your consent. You also have the option to opt-out of these cookies. But opting out of some of these cookies may affect your browsing experience.
Necessary cookies are absolutely essential for the website to function properly. These cookies ensure basic functionalities and security features of the website, anonymously.
Cookie
Duration
Description
cookielawinfo-checbox-analytics
11 months
This cookie is set by GDPR Cookie Consent plugin. The cookie is used to store the user consent for the cookies in the category "Analytics".
cookielawinfo-checbox-functional
11 months
The cookie is set by GDPR cookie consent to record the user consent for the cookies in the category "Functional".
cookielawinfo-checbox-others
11 months
This cookie is set by GDPR Cookie Consent plugin. The cookie is used to store the user consent for the cookies in the category "Other.
cookielawinfo-checkbox-necessary
11 months
This cookie is set by GDPR Cookie Consent plugin. The cookies is used to store the user consent for the cookies in the category "Necessary".
cookielawinfo-checkbox-performance
11 months
This cookie is set by GDPR Cookie Consent plugin. The cookie is used to store the user consent for the cookies in the category "Performance".
viewed_cookie_policy
11 months
The cookie is set by the GDPR Cookie Consent plugin and is used to store whether or not user has consented to the use of cookies. It does not store any personal data.
Functional cookies help to perform certain functionalities like sharing the content of the website on social media platforms, collect feedbacks, and other third-party features.
Performance cookies are used to understand and analyze the key performance indexes of the website which helps in delivering a better user experience for the visitors.
Analytical cookies are used to understand how visitors interact with the website. These cookies help provide information on metrics the number of visitors, bounce rate, traffic source, etc.
Advertisement cookies are used to provide visitors with relevant ads and marketing campaigns. These cookies track visitors across websites and collect information to provide customized ads.


