Uncategorized
Turmoil Lurks Around The Corner
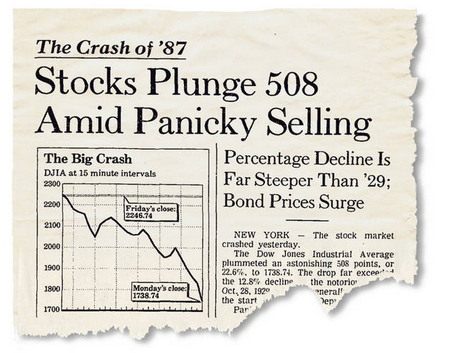
On October 12, 1987, a week before Black Monday, the Wall Street Journal warned of the potential for significant market turmoil. Per the article: The use…
Share this:


On October 12, 1987, a week before Black Monday, the Wall Street Journal warned of the potential for significant market turmoil. Per the article: The use of portfolio insurance “could snowball into a stunning rout for stocks.” Today, we are increasingly alarmed that another trading tool similar to portfolio insurance could set markets up for a bout of turmoil.
The quote above and a detailed analysis of Black Monday can be found in a Federal Reserve white paper entitled A Brief history of the 1987 Stock Market Crash.
Despite the growing risk to foster market turmoil, 0DTE is a term few investors have heard of.
0DTE stands for zero days to options expiration. These are put-and-call options on individual stocks and indexes that expire within 24 hours. 0DTE options may seem like speculative YOLO (you only live once) bets at first glance. However, when one appreciates how brokers hedge options, they then grasp the potential for these options to generate significant volatility in individual stocks and the market.
Before exploring 0DTE options, it’s worth briefly discussing portfolio insurance’s role in Black Monday 1987.
1987 Portfolio Insurance
One of our first reactions to hearing of the recent popularity of 0DTE trades was to recall Black Monday and the 22.6% crash of the Dow Jones Industrial Average on October 19, 1987. There are several causes for the turmoil, but the factor that significantly amplified the decline was portfolio insurance.
At the time, institutional investors were buying portfolio insurance from Wall Street brokers to help protect against losses. During market declines, the brokers’ computer algorithms would automatically sell S&P 500 futures contracts short. As the market sold off further, the algorithms would sell more contracts.
As the programs sold, they pushed markets lower, necessitating more portfolio insurance-related selling. Selling begat selling, and a correction turned into an avalanche of panic.
The following quote is from a Wall Street Journal article rehashing the turmoil:
The strategy backfired, probably because too many institutions were doing the same thing at more or less the same time. They pushed stock prices into free fall and individual investors under the bus.
0DTE Options
The popularity of 0DTE options is rising precipitously. As the graph below shows, half of the volume of options on S&P 500 futures are 0DTE. That dwarfs the 5-10% share existing before the pandemic.

Individual and institutional investors are using options that have a very short time until expiry for speculative and hedging purposes. It is also likely investors may be using 0DTE options to manipulate markets. Regardless of the objectives, 0DTE options have a similar feature as portfolio insurance; they can significantly intensify market moves.
To reiterate the WSJ quote: “The strategy backfired, probably because too many institutions were doing the same thing at more or less the same time.” Sound familiar?
How Manipulation Creates Signifcant Instability
To help better appreciate the risk of 0DTE options, we walk through a hypothetical example using Tesla stock. This case uses data from the early afternoon on January 25, 2023. After the close that day, Tesla reported its quarterly earnings.
Hypothetical hedge Fund ABC owns 100,000 shares of Tesla stock (TSLA). TSLA was trading for $144, which meant ABC had a $14,400,000 investment in TSLA. With earnings due shortly, ABC wanted a low-cost trade to juice their returns if earnings were better than expected.
One such way is 0DTE options. To do so, they could buy calls with a $160 strike that expired in a day. At the time, the price per 0DTE call was $1.36. Each call option controls 100 shares. If they chose, buying 1,000 calls would give them the right to purchase 100,000 shares at $160. The options cost was $136,000 or about 1% of their total Tesla investment. If TSLA shares flopped on earnings, they would lose 1% on the options. If the stock rose, they would likely sell the options and could easily double or triple their return. More importantly, their calls could force significantly more buying if the stock rose.
Delta Hedging Begets Delta Hedging
As frequently occurs, ABC indirectly buys calls from a Wall Street dealer. Most dealers run managed books meaning they have limited risk-taking tolerance. Accordingly, they often hedge their risks. In this case, the dealer’s risk is an increase in the price of Tesla.
Dealers use a hedging method called delta hedging. An option’s delta estimates how much an option’s value may change for a $1 move up or down in the underlying security. The delta at the time of the trade was .15. For each $1 that TSLA shares rose, the options would increase by 15 cents. The delta increases toward 1.0 as the price approaches the strike price and falls toward zero as the price declines.
The dealer might initially delta-hedge the calls in our scenario by buying 15,000 shares (.15*100,000). As the price rises or falls, the number of shares they own will change according to the delta. The table below approximates the delta for Tesla shares on that day for a range of prices.

If the hedge fund is right and Tesla has excellent earnings, the stock will jump and force the dealer to buy more Tesla. The further it rises, the more shares they must buy. As the dealer and other dealers increase their hedges, the buying pressure on Tesla shares increases and pushes the delta higher. Buying begets buying.
Options on The Market
The Tesla 0DTE example pertains to the movement of one stock. While Tesla’s price may be more volatile than it would have been without 0DTE options, its effect on the broad market is limited.
More concerning, investors are buying 0DTE calls and puts on the S&P 500 and other indexes. Often such options are purchased in advance of potentially market-moving events. Recently, CPI, Fed meetings, and employment reports have drawn sizeable interest from 0DTE traders.
Suppose 0DTE volume is large enough, and options buyers are betting on the same directional market move. In that case, the environment becomes ripe for significant market instability if dealers are forced to aggressively delta hedge. Adding strength to such an event, investors become irrational when markets fall precipitously. A considerable downward move could trigger other investors to panic sell. Selling could beget selling, and a few percent loss could quickly turn into a severe decline.
Summary
If you take one thing away from this article, it is that for every option, there is likely a bank/dealer on the other side of the trade. Risk management protocols force dealers to buy or sell up to 100 shares of the stock or index for each option. It takes little money for a hedge fund to manipulate stock or index prices and, therefore, little money to create market turmoil.
Unlike portfolio insurance, delta hedging is limited as the delta can only go to one or zero. However, a heavy dose of delta hedging could cause panic selling among other market players. Fear can beget fear!
Closing Note
When we calculated the TSLA 0DTE example, Tesla closed the day at 144.43 minutes before the company reported its Q4 earnings. Its shares shot 10% higher the next day on the most volume in six months. 0DTE certainly helped TSLA shareholders!

The post Turmoil Lurks Around The Corner appeared first on RIA.
dow jones sp 500 stocks pandemic fed federal reserveUncategorized
February Employment Situation
By Paul Gomme and Peter Rupert The establishment data from the BLS showed a 275,000 increase in payroll employment for February, outpacing the 230,000…
Share this:


By Paul Gomme and Peter Rupert
The establishment data from the BLS showed a 275,000 increase in payroll employment for February, outpacing the 230,000 average over the previous 12 months. The payroll data for January and December were revised down by a total of 167,000. The private sector added 223,000 new jobs, the largest gain since May of last year.

Temporary help services employment continues a steep decline after a sharp post-pandemic rise.


Average hours of work increased from 34.2 to 34.3. The increase, along with the 223,000 private employment increase led to a hefty increase in total hours of 5.6% at an annualized rate, also the largest increase since May of last year.

The establishment report, once again, beat “expectations;” the WSJ survey of economists was 198,000. Other than the downward revisions, mentioned above, another bit of negative news was a smallish increase in wage growth, from $34.52 to $34.57.

The household survey shows that the labor force increased 150,000, a drop in employment of 184,000 and an increase in the number of unemployed persons of 334,000. The labor force participation rate held steady at 62.5, the employment to population ratio decreased from 60.2 to 60.1 and the unemployment rate increased from 3.66 to 3.86. Remember that the unemployment rate is the number of unemployed relative to the labor force (the number employed plus the number unemployed). Consequently, the unemployment rate can go up if the number of unemployed rises holding fixed the labor force, or if the labor force shrinks holding the number unemployed unchanged. An increase in the unemployment rate is not necessarily a bad thing: it may reflect a strong labor market drawing “marginally attached” individuals from outside the labor force. Indeed, there was a 96,000 decline in those workers.


Earlier in the week, the BLS announced JOLTS (Job Openings and Labor Turnover Survey) data for January. There isn’t much to report here as the job openings changed little at 8.9 million, the number of hires and total separations were little changed at 5.7 million and 5.3 million, respectively.

As has been the case for the last couple of years, the number of job openings remains higher than the number of unemployed persons.

Also earlier in the week the BLS announced that productivity increased 3.2% in the 4th quarter with output rising 3.5% and hours of work rising 0.3%.

The bottom line is that the labor market continues its surprisingly (to some) strong performance, once again proving stronger than many had expected. This strength makes it difficult to justify any interest rate cuts soon, particularly given the recent inflation spike.
unemployment pandemic unemploymentUncategorized
Mortgage rates fall as labor market normalizes
Jobless claims show an expanding economy. We will only be in a recession once jobless claims exceed 323,000 on a four-week moving average.
Share this:


Everyone was waiting to see if this week’s jobs report would send mortgage rates higher, which is what happened last month. Instead, the 10-year yield had a muted response after the headline number beat estimates, but we have negative job revisions from previous months. The Federal Reserve’s fear of wage growth spiraling out of control hasn’t materialized for over two years now and the unemployment rate ticked up to 3.9%. For now, we can say the labor market isn’t tight anymore, but it’s also not breaking.
The key labor data line in this expansion is the weekly jobless claims report. Jobless claims show an expanding economy that has not lost jobs yet. We will only be in a recession once jobless claims exceed 323,000 on a four-week moving average.
From the Fed: In the week ended March 2, initial claims for unemployment insurance benefits were flat, at 217,000. The four-week moving average declined slightly by 750, to 212,250
Below is an explanation of how we got here with the labor market, which all started during COVID-19.
1. I wrote the COVID-19 recovery model on April 7, 2020, and retired it on Dec. 9, 2020. By that time, the upfront recovery phase was done, and I needed to model out when we would get the jobs lost back.
2. Early in the labor market recovery, when we saw weaker job reports, I doubled and tripled down on my assertion that job openings would get to 10 million in this recovery. Job openings rose as high as to 12 million and are currently over 9 million. Even with the massive miss on a job report in May 2021, I didn’t waver.
Currently, the jobs openings, quit percentage and hires data are below pre-COVID-19 levels, which means the labor market isn’t as tight as it once was, and this is why the employment cost index has been slowing data to move along the quits percentage.

3. I wrote that we should get back all the jobs lost to COVID-19 by September of 2022. At the time this would be a speedy labor market recovery, and it happened on schedule, too
Total employment data
4. This is the key one for right now: If COVID-19 hadn’t happened, we would have between 157 million and 159 million jobs today, which would have been in line with the job growth rate in February 2020. Today, we are at 157,808,000. This is important because job growth should be cooling down now. We are more in line with where the labor market should be when averaging 140K-165K monthly. So for now, the fact that we aren’t trending between 140K-165K means we still have a bit more recovery kick left before we get down to those levels.

From BLS: Total nonfarm payroll employment rose by 275,000 in February, and the unemployment rate increased to 3.9 percent, the U.S. Bureau of Labor Statistics reported today. Job gains occurred in health care, in government, in food services and drinking places, in social assistance, and in transportation and warehousing.
Here are the jobs that were created and lost in the previous month:

In this jobs report, the unemployment rate for education levels looks like this:
- Less than a high school diploma: 6.1%
- High school graduate and no college: 4.2%
- Some college or associate degree: 3.1%
- Bachelor’s degree or higher: 2.2%

Today’s report has continued the trend of the labor data beating my expectations, only because I am looking for the jobs data to slow down to a level of 140K-165K, which hasn’t happened yet. I wouldn’t categorize the labor market as being tight anymore because of the quits ratio and the hires data in the job openings report. This also shows itself in the employment cost index as well. These are key data lines for the Fed and the reason we are going to see three rate cuts this year.
recession unemployment covid-19 fed federal reserve mortgage rates recession recovery unemploymentUncategorized
Inside The Most Ridiculous Jobs Report In History: Record 1.2 Million Immigrant Jobs Added In One Month
Inside The Most Ridiculous Jobs Report In History: Record 1.2 Million Immigrant Jobs Added In One Month
Last month we though that the January…
Share this:


Last month we though that the January jobs report was the "most ridiculous in recent history" but, boy, were we wrong because this morning the Biden department of goalseeked propaganda (aka BLS) published the February jobs report, and holy crap was that something else. Even Goebbels would blush.
What happened? Let's take a closer look.
On the surface, it was (almost) another blockbuster jobs report, certainly one which nobody expected, or rather just one bank out of 76 expected. Starting at the top, the BLS reported that in February the US unexpectedly added 275K jobs, with just one research analyst (from Dai-Ichi Research) expecting a higher number.
Some context: after last month's record 4-sigma beat, today's print was "only" 3 sigma higher than estimates. Needless to say, two multiple sigma beats in a row used to only happen in the USSR... and now in the US, apparently.

Before we go any further, a quick note on what last month we said was "the most ridiculous jobs report in recent history": it appears the BLS read our comments and decided to stop beclowing itself. It did that by slashing last month's ridiculous print by over a third, and revising what was originally reported as a massive 353K beat to just 229K, a 124K revision, which was the biggest one-month negative revision in two years!

Of course, that does not mean that this month's jobs print won't be revised lower: it will be, and not just that month but every other month until the November election because that's the only tool left in the Biden admin's box: pretend the economic and jobs are strong, then revise them sharply lower the next month, something we pointed out first last summer and which has not failed to disappoint once.
In the past month the Biden department of goalseeking stuff higher before revising it lower, has revised the following data sharply lower:
— zerohedge (@zerohedge) August 30, 2023
- Jobs
- JOLTS
- New Home sales
- Housing Starts and Permits
- Industrial Production
- PCE and core PCE
To be fair, not every aspect of the jobs report was stellar (after all, the BLS had to give it some vague credibility). Take the unemployment rate, after flatlining between 3.4% and 3.8% for two years - and thus denying expectations from Sahm's Rule that a recession may have already started - in February the unemployment rate unexpectedly jumped to 3.9%, the highest since February 2022 (with Black unemployment spiking by 0.3% to 5.6%, an indicator which the Biden admin will quickly slam as widespread economic racism or something).

And then there were average hourly earnings, which after surging 0.6% MoM in January (since revised to 0.5%) and spooking markets that wage growth is so hot, the Fed will have no choice but to delay cuts, in February the number tumbled to just 0.1%, the lowest in two years...

... for one simple reason: last month's average wage surge had nothing to do with actual wages, and everything to do with the BLS estimate of hours worked (which is the denominator in the average wage calculation) which last month tumbled to just 34.1 (we were led to believe) the lowest since the covid pandemic...

... but has since been revised higher while the February print rose even more, to 34.3, hence why the latest average wage data was once again a product not of wages going up, but of how long Americans worked in any weekly period, in this case higher from 34.1 to 34.3, an increase which has a major impact on the average calculation.

While the above data points were examples of some latent weakness in the latest report, perhaps meant to give it a sheen of veracity, it was everything else in the report that was a problem starting with the BLS's latest choice of seasonal adjustments (after last month's wholesale revision), which have gone from merely laughable to full clownshow, as the following comparison between the monthly change in BLS and ADP payrolls shows. The trend is clear: the Biden admin numbers are now clearly rising even as the impartial ADP (which directly logs employment numbers at the company level and is far more accurate), shows an accelerating slowdown.

But it's more than just the Biden admin hanging its "success" on seasonal adjustments: when one digs deeper inside the jobs report, all sorts of ugly things emerge... such as the growing unprecedented divergence between the Establishment (payrolls) survey and much more accurate Household (actual employment) survey. To wit, while in January the BLS claims 275K payrolls were added, the Household survey found that the number of actually employed workers dropped for the third straight month (and 4 in the past 5), this time by 184K (from 161.152K to 160.968K).

This means that while the Payrolls series hits new all time highs every month since December 2020 (when according to the BLS the US had its last month of payrolls losses), the level of Employment has not budged in the past year. Worse, as shown in the chart below, such a gaping divergence has opened between the two series in the past 4 years, that the number of Employed workers would need to soar by 9 million (!) to catch up to what Payrolls claims is the employment situation.

There's more: shifting from a quantitative to a qualitative assessment, reveals just how ugly the composition of "new jobs" has been. Consider this: the BLS reports that in February 2024, the US had 132.9 million full-time jobs and 27.9 million part-time jobs. Well, that's great... until you look back one year and find that in February 2023 the US had 133.2 million full-time jobs, or more than it does one year later! And yes, all the job growth since then has been in part-time jobs, which have increased by 921K since February 2023 (from 27.020 million to 27.941 million).

Here is a summary of the labor composition in the past year: all the new jobs have been part-time jobs!

But wait there's even more, because now that the primary season is over and we enter the heart of election season and political talking points will be thrown around left and right, especially in the context of the immigration crisis created intentionally by the Biden administration which is hoping to import millions of new Democratic voters (maybe the US can hold the presidential election in Honduras or Guatemala, after all it is their citizens that will be illegally casting the key votes in November), what we find is that in February, the number of native-born workers tumbled again, sliding by a massive 560K to just 129.807 million. Add to this the December data, and we get a near-record 2.4 million plunge in native-born workers in just the past 3 months (only the covid crash was worse)!

The offset? A record 1.2 million foreign-born (read immigrants, both legal and illegal but mostly illegal) workers added in February!

Said otherwise, not only has all job creation in the past 6 years has been exclusively for foreign-born workers...

... but there has been zero job-creation for native born workers since June 2018!

This is a huge issue - especially at a time of an illegal alien flood at the southwest border...

... and is about to become a huge political scandal, because once the inevitable recession finally hits, there will be millions of furious unemployed Americans demanding a more accurate explanation for what happened - i.e., the illegal immigration floodgates that were opened by the Biden admin.
Which is also why Biden's handlers will do everything in their power to insure there is no official recession before November... and why after the election is over, all economic hell will finally break loose. Until then, however, expect the jobs numbers to get even more ridiculous.


Mortgage rates fall as labor market normalizes


Economic Earthquake Ahead? The Cracks Are Spreading Fast


February Employment Situation


Wendy’s teases new $3 offer for upcoming holiday


Inside The Most Ridiculous Jobs Report In History: Record 1.2 Million Immigrant Jobs Added In One Month
-

 Uncategorized2 weeks ago
All Of The Elements Are In Place For An Economic Crisis Of Staggering Proportions
-

 Uncategorized1 month ago
Cathie Wood sells a major tech stock (again)
-

 Uncategorized3 weeks ago
California Counties Could Be Forced To Pay $300 Million To Cover COVID-Era Program
-

 Uncategorized2 weeks ago
Apparel Retailer Express Moving Toward Bankruptcy
-

 Uncategorized3 weeks ago
Industrial Production Decreased 0.1% in January
-

 International2 days ago
Walmart launches clever answer to Target’s new membership program
-

 International2 days ago
EyePoint poaches medical chief from Apellis; Sandoz CFO, longtime BioNTech exec to retire
-

 Uncategorized3 weeks ago
RFK Jr: The Wuhan Cover-Up & The Rise Of The Biowarfare-Industrial Complex