Trucking Industry Will Be In Dire Straits If Demand Drops To Pre-COVID Levels
Trucking Industry Will Be In Dire Straits If Demand Drops To Pre-COVID Levels
By Craig Fuller, CEO of FreightWaves
Trucking spot rates are…
Share this:


By Craig Fuller, CEO of FreightWaves
Trucking spot rates are way up, but so are operating expenses. What does this mean for carriers?
“Demand is just falling back to pre-pandemic levels.” I’ve heard this rebuttal to my earlier articles about a 2022 trucking “bloodbath” (here and here) for the past week. If “demand falls back to pre-pandemic levels” turns out to be true, the situation for truckers will actually be much worse than even I have predicted.
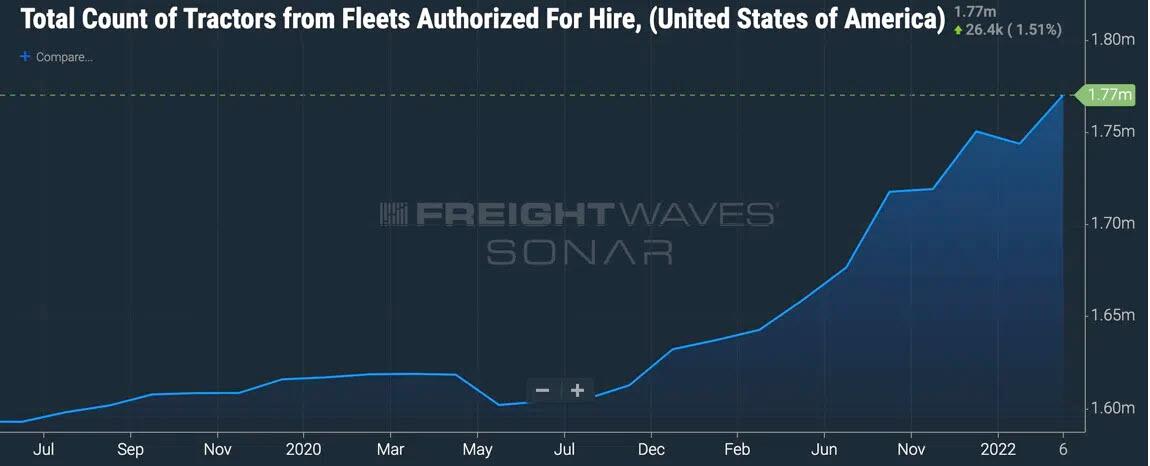
Since the pandemic began, the number of dispatchable trucks in the for-hire trucking market (trucks with a driver and available to haul a load) is up approximately 10%. Since trucking rates are contingent upon the balance of supply and demand, if volumes were to drop back to pre-pandemic levels (with far more capacity in the market), rates would collapse.
But even more worrisome is that the operating expenses of carriers are at much higher levels than before COVID. FreightWaves estimates that operating expenses for nearly all carriers have surged by as much as $0.38 per mile over pre-COVID levels. This calculation only includes maintenance, insurance and fuel costs.

The calculation does not include driver wages or equipment purchase/finance, which could nearly double the increased amount of operating expenses.
If a trucking fleet were to start up today with an employee driver, its operating cash expenses would be as much as $0.72 per mile higher than a trucking fleet that was started in 2019.
Fuel
The cost of fuel is one of the largest variable operating expenses in the trucking industry. During 2019, retail diesel prices ranged between $2.97 and $3.11 per gallon. For the most part, retail diesel prices hardly moved in 2019.
Using an average of 7 miles per gallon, the cost of fuel during 2019 ranged from $0.42 to $0.44 per mile for a Class 8 truck. For most carriers operating in 2019, fuel was incredibly stable and was largely an afterthought.
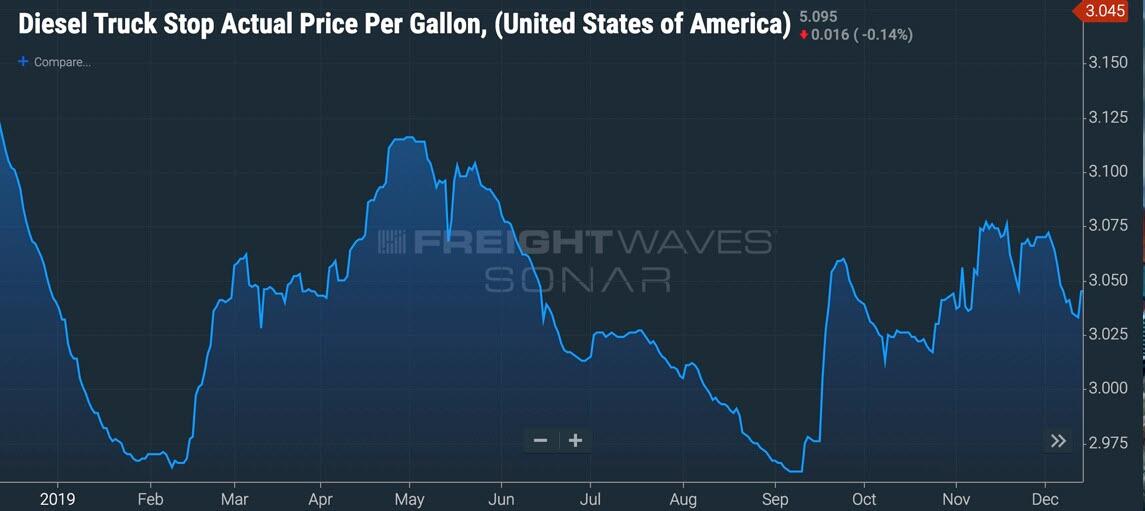
Fast forward to April 5, 2022. The retail diesel price is $5.10/gallon. At 7 miles per gallon, that equates to $0.73/mile. This $0.30 increase per mile will significantly impact the cash flows of carriers.

Fuel is often paid for at the point of sale, when a truck is fueled. But shippers and brokers often pay a carrier a month or two after the load has been delivered.
According to data from the Truckload Carriers Association (TCA), an average carrier runs about 6,500 miles in a given month. At $0.30 per mile, the additional cash outlay for an operator compared to 2019 is approximately $1,950 per month. This is cash that a fleet must advance before collecting it from a broker or shipper. While carriers that have fuel surcharges will be able to pass on some of their fuel expenses to their shipper customers, carriers that operate in the spot market will not. Spot freight typically doesn’t include a surcharge for fuel.
Insurance and maintenance
Referencing TCA data, insurance costs per mile were $0.07 in 2019. In 2022, these costs have increased to $0.09 per mile. Using the same dataset, maintenance costs have increased from $0.20 to $0.26 per mile. In total, insurance and maintenance are up $0.08 per mile.
When added together (fuel, insurance, and maintenance) nearly every trucking company has experienced increases of at least $0.38 per mile versus 2019, regardless of when they consummated operations.
Lots of new entrants bought at the top of the market
The trucking market has experienced the highest number of new fleet startups in its history. The chart of new startup fleets could easily be confused with a meme stock.
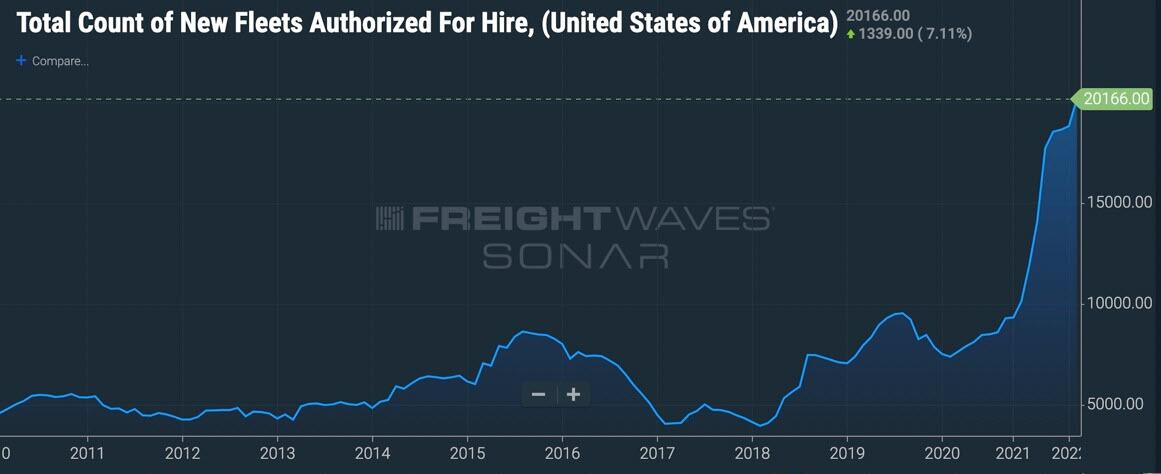
Entrepreneurs and aspiring fleet executives registered a new carrier with the FMCSA and then went out and purchased a truck. Since it was nearly impossible for these carriers to order a new truck from a truck manufacturer, we can assume that they bought a truck that was at least three years old from another carrier.
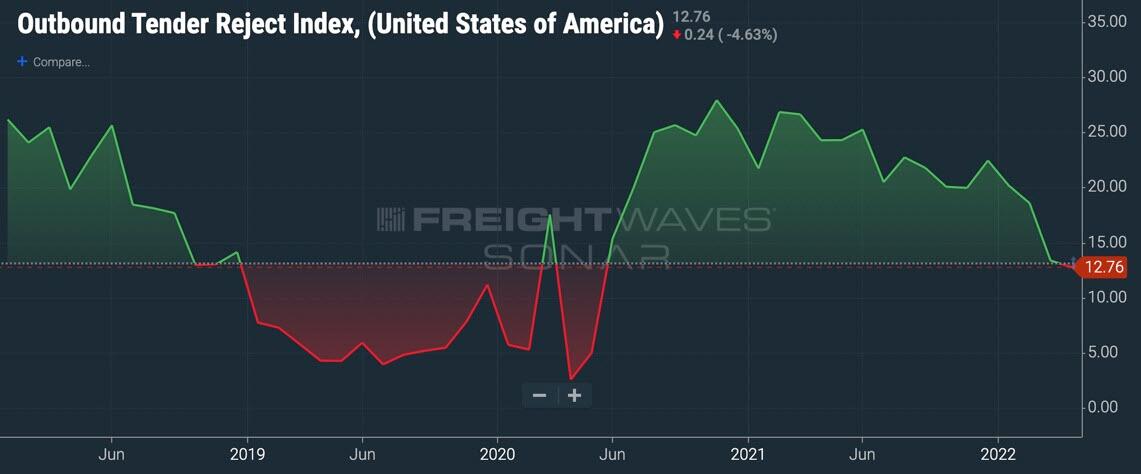
The worst thing anyone can do in any situation is to buy at the top of the market. With tender reject data warning that trucking companies are quickly losing pricing power for hauling loads, equipment values will soon follow.
Equipment purchase and finance
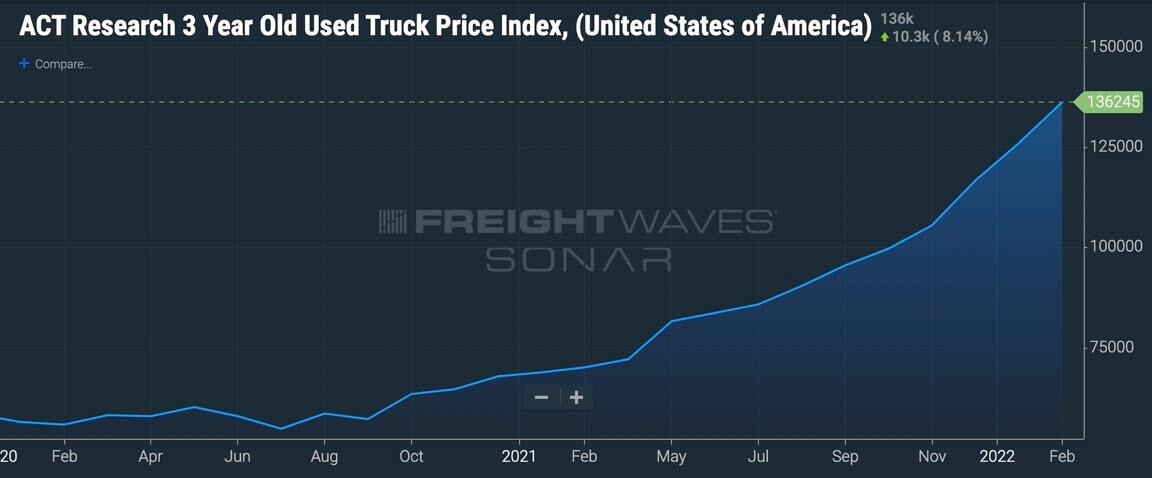
One of the largest expense increases is the truck itself. The cost of purchasing a new or used truck is mostly dependent upon when the truck was purchased. Therefore, there is a wide range in costs.
According to ACT data, a 3-year-old used truck could have been purchased for $69,000 in 2019. In early March 2022, the price of a 3-year-old truck had nearly doubled – to $136,000. This $67,000 increase in the cost of a used truck is unprecedented.
For this example, I will use a finance rate of 5% and a 60-month finance schedule. I will also assume that the buyer put no money down on the purchase and that there was 7% sales tax on the truck. I will also assume that a truck is being driven 6,500 miles per month.
At a 2019 sales price of $69,000, the monthly payment would be $1,393. At 6,500 miles per month, the fleet would need to generate $0.21 per mile in cash flow just to cover the equipment purchase.
The truck will have a residual value when it is sold five years later, but it is hard to predict what the market will be at that point. For our calculations, we are going to use cash flow and not GAAP.
If a similar truck was purchased in 2022, it would cost $136,000. The monthly payment would be $2,746, or $0.42 per mile.
While it is hard to predict how many used trucks traded at these extremely high levels, we know that many fleets have been growing quickly throughout the past few quarters and some fleets will be saddled with these headwinds.
Taken all together, a fleet that is relatively new to trucking, operating a used truck purchased in 2022, would need to generate $0.59/mile more than they would have if it had started operations in 2019. If there is an employee driver to consider, an over-the-road driver in 2022 can expect to make around $0.60/mile. In 2019, the same driver would have made around $0.47/mile.
With an employee driver, plus a truck purchased in 2022, a new fleet entering the market would have operating cash requirements that are $0.72 per mile more than the same fleet in 2019. Therefore, if a fleet is paying out an additional $0.72 per mile in operating cash compared to pre-pandemic, it will have an incredibly difficult time surviving in a dropping spot rate environment.
The spot rate environment is changing – and quickly
According to Truckstop.com, the current van truckload spot rate is $3.29 per mile (as of April 5, 2022). The Truckstop.com spot rate in SONAR includes fuel in the entire rate. All references to spot rates will include fuel.
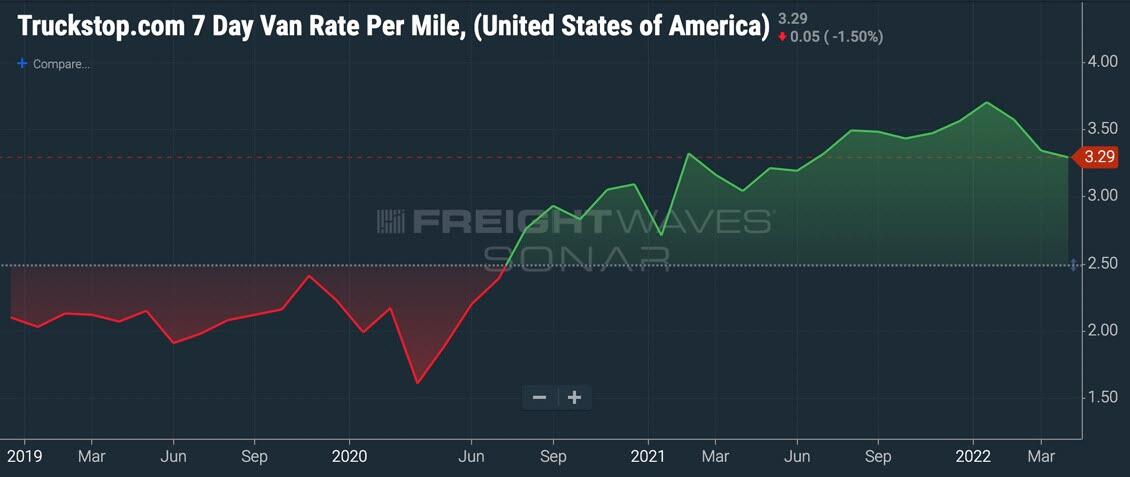
Trucking spot rates peaked on Jan. 9, 2022 at $3.83 per mile. The $0.54 drop per mile is significant, but in historical context trucking spot rates are still way up – by over $1.00 per mile.
Looking back at 2019, which was when we experienced the last freight recession, trucking spot rates ranged from $1.91 to $2.54 per mile. While these ranges are the low and highs, the typical range during 2019 was closer to $2.00-2.20 per mile.
But here is where it gets tricky. The trucking spot rate is only one part of the story. It doesn’t tell us how profitable trucking carriers are.
Trucking is a very difficult business to make money in
A lot of this depends on whether or not spot rates drop to levels that drain the cash flow of carriers to the point that they run out of money.
Trucking is a notoriously difficult business, with violent swings between bull and bear markets. Even in the best of times, trucking companies struggle for every penny of profit.
The best trucking market in history took place in 2021, marked by record volume and unprecedented trucking spot rates. Nonetheless, average trucking companies struggled to make money.
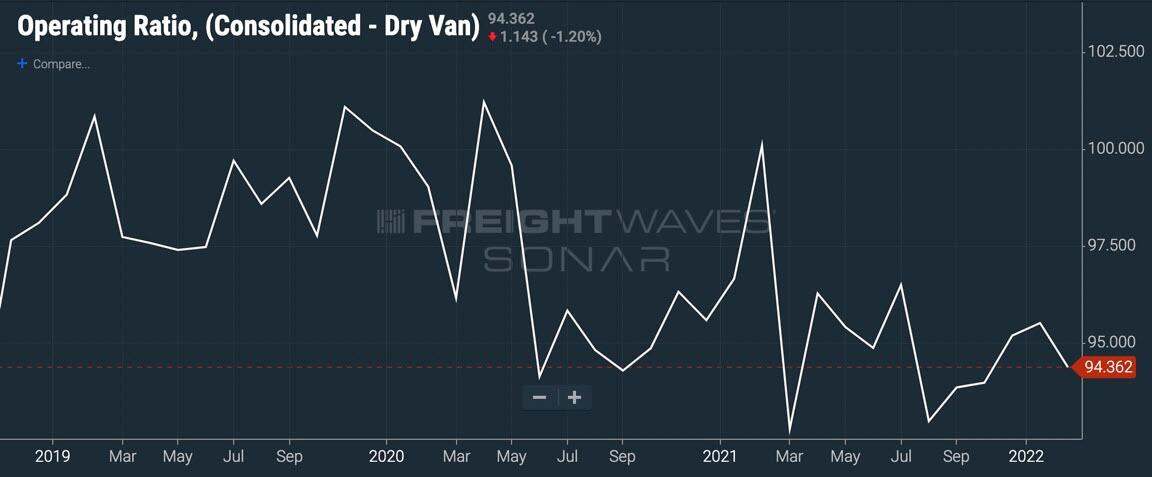
The operating ratio for dry van truckload carriers in 2021 across TCA’s benchmarking program ranged from 92 to 97. That means for every $100 of revenue the fleet generated, it generated an operating profit of just $3 to $8. This was before the fleet paid for any working capital lines of credit (debt) or taxes.
Is a bloodbath on the way?
The bloodbath of 2019 was marked by the highest number of trucking fleet bankruptcies in history. If we see trucking spot rates continue to drop, we may see similar or worse conditions in the market.
The operating ratio for truckload carriers in 2019 ranged from 97 to 101. A significant deterioration in spot rates, combined with the surge in operating expenses that fleets are contending with, could spell disaster for many.
The low for trucking spot rates in 2019 was $1.91/mile. I am assuming that this is the baseline for which many small carriers will struggle to survive. Fuel is a part of the spot rate, so the calculation should be adjusted.
The $0.30/mile increase in fuel means the adjusted 2019 spot rate “bloodbath baseline” would be around $2.21 per mile. Since fuel bills are paid immediately, I assume that anything below this spot rate level will be dire for many small trucking companies and could result in a rapid acceleration in fleet bankruptcies.
Insurance and maintenance are not “instant” killers of fleets, but kill over time. As long as spot rates are above $2.34 per mile for most of 2022 the majority of small fleets that entered the market prior to 2020 will survive – at least until their insurance bills hit or they have a breakdown.

But new fleets will be at a major disadvantage to existing fleets
If a fleet is new to trucking and purchased a truck in 2022, it has the worst operating environment of any carrier. Assuming that the truck is being driven by an employee driver, spot rates below $2.63 per mile could spell disaster for trucking fleets if that rate persists for long.
All of this could change – and quickly.
If retail diesel prices move up, the break-even point for carriers would move up as well. If fuel drops, the break-even point would be lower. Watch the direction of retail diesel; it has a lot to do with the profitability of trucking fleets, especially small carriers.
If fuel continues to surge, the “bloodbath baseline” will also move up as well. On the other hand, if fuel drops, there could be significant relief for the small spot market carriers.
There is a great deal of disagreement on the direction of fuel and trucking spot rates, but one thing is certain – there will be volatility. Hopefully, we all avoid vertigo along the way.
Uncategorized
Mortgage rates fall as labor market normalizes
Jobless claims show an expanding economy. We will only be in a recession once jobless claims exceed 323,000 on a four-week moving average.
Share this:


Everyone was waiting to see if this week’s jobs report would send mortgage rates higher, which is what happened last month. Instead, the 10-year yield had a muted response after the headline number beat estimates, but we have negative job revisions from previous months. The Federal Reserve’s fear of wage growth spiraling out of control hasn’t materialized for over two years now and the unemployment rate ticked up to 3.9%. For now, we can say the labor market isn’t tight anymore, but it’s also not breaking.
The key labor data line in this expansion is the weekly jobless claims report. Jobless claims show an expanding economy that has not lost jobs yet. We will only be in a recession once jobless claims exceed 323,000 on a four-week moving average.
From the Fed: In the week ended March 2, initial claims for unemployment insurance benefits were flat, at 217,000. The four-week moving average declined slightly by 750, to 212,250
Below is an explanation of how we got here with the labor market, which all started during COVID-19.
1. I wrote the COVID-19 recovery model on April 7, 2020, and retired it on Dec. 9, 2020. By that time, the upfront recovery phase was done, and I needed to model out when we would get the jobs lost back.
2. Early in the labor market recovery, when we saw weaker job reports, I doubled and tripled down on my assertion that job openings would get to 10 million in this recovery. Job openings rose as high as to 12 million and are currently over 9 million. Even with the massive miss on a job report in May 2021, I didn’t waver.
Currently, the jobs openings, quit percentage and hires data are below pre-COVID-19 levels, which means the labor market isn’t as tight as it once was, and this is why the employment cost index has been slowing data to move along the quits percentage.

3. I wrote that we should get back all the jobs lost to COVID-19 by September of 2022. At the time this would be a speedy labor market recovery, and it happened on schedule, too
Total employment data
4. This is the key one for right now: If COVID-19 hadn’t happened, we would have between 157 million and 159 million jobs today, which would have been in line with the job growth rate in February 2020. Today, we are at 157,808,000. This is important because job growth should be cooling down now. We are more in line with where the labor market should be when averaging 140K-165K monthly. So for now, the fact that we aren’t trending between 140K-165K means we still have a bit more recovery kick left before we get down to those levels.

From BLS: Total nonfarm payroll employment rose by 275,000 in February, and the unemployment rate increased to 3.9 percent, the U.S. Bureau of Labor Statistics reported today. Job gains occurred in health care, in government, in food services and drinking places, in social assistance, and in transportation and warehousing.
Here are the jobs that were created and lost in the previous month:

In this jobs report, the unemployment rate for education levels looks like this:
- Less than a high school diploma: 6.1%
- High school graduate and no college: 4.2%
- Some college or associate degree: 3.1%
- Bachelor’s degree or higher: 2.2%

Today’s report has continued the trend of the labor data beating my expectations, only because I am looking for the jobs data to slow down to a level of 140K-165K, which hasn’t happened yet. I wouldn’t categorize the labor market as being tight anymore because of the quits ratio and the hires data in the job openings report. This also shows itself in the employment cost index as well. These are key data lines for the Fed and the reason we are going to see three rate cuts this year.
recession unemployment covid-19 fed federal reserve mortgage rates recession recovery unemploymentUncategorized
Inside The Most Ridiculous Jobs Report In History: Record 1.2 Million Immigrant Jobs Added In One Month
Inside The Most Ridiculous Jobs Report In History: Record 1.2 Million Immigrant Jobs Added In One Month
Last month we though that the January…
Share this:


Last month we though that the January jobs report was the "most ridiculous in recent history" but, boy, were we wrong because this morning the Biden department of goalseeked propaganda (aka BLS) published the February jobs report, and holy crap was that something else. Even Goebbels would blush.
What happened? Let's take a closer look.
On the surface, it was (almost) another blockbuster jobs report, certainly one which nobody expected, or rather just one bank out of 76 expected. Starting at the top, the BLS reported that in February the US unexpectedly added 275K jobs, with just one research analyst (from Dai-Ichi Research) expecting a higher number.
Some context: after last month's record 4-sigma beat, today's print was "only" 3 sigma higher than estimates. Needless to say, two multiple sigma beats in a row used to only happen in the USSR... and now in the US, apparently.

Before we go any further, a quick note on what last month we said was "the most ridiculous jobs report in recent history": it appears the BLS read our comments and decided to stop beclowing itself. It did that by slashing last month's ridiculous print by over a third, and revising what was originally reported as a massive 353K beat to just 229K, a 124K revision, which was the biggest one-month negative revision in two years!

Of course, that does not mean that this month's jobs print won't be revised lower: it will be, and not just that month but every other month until the November election because that's the only tool left in the Biden admin's box: pretend the economic and jobs are strong, then revise them sharply lower the next month, something we pointed out first last summer and which has not failed to disappoint once.
In the past month the Biden department of goalseeking stuff higher before revising it lower, has revised the following data sharply lower:
— zerohedge (@zerohedge) August 30, 2023
- Jobs
- JOLTS
- New Home sales
- Housing Starts and Permits
- Industrial Production
- PCE and core PCE
To be fair, not every aspect of the jobs report was stellar (after all, the BLS had to give it some vague credibility). Take the unemployment rate, after flatlining between 3.4% and 3.8% for two years - and thus denying expectations from Sahm's Rule that a recession may have already started - in February the unemployment rate unexpectedly jumped to 3.9%, the highest since February 2022 (with Black unemployment spiking by 0.3% to 5.6%, an indicator which the Biden admin will quickly slam as widespread economic racism or something).

And then there were average hourly earnings, which after surging 0.6% MoM in January (since revised to 0.5%) and spooking markets that wage growth is so hot, the Fed will have no choice but to delay cuts, in February the number tumbled to just 0.1%, the lowest in two years...

... for one simple reason: last month's average wage surge had nothing to do with actual wages, and everything to do with the BLS estimate of hours worked (which is the denominator in the average wage calculation) which last month tumbled to just 34.1 (we were led to believe) the lowest since the covid pandemic...

... but has since been revised higher while the February print rose even more, to 34.3, hence why the latest average wage data was once again a product not of wages going up, but of how long Americans worked in any weekly period, in this case higher from 34.1 to 34.3, an increase which has a major impact on the average calculation.

While the above data points were examples of some latent weakness in the latest report, perhaps meant to give it a sheen of veracity, it was everything else in the report that was a problem starting with the BLS's latest choice of seasonal adjustments (after last month's wholesale revision), which have gone from merely laughable to full clownshow, as the following comparison between the monthly change in BLS and ADP payrolls shows. The trend is clear: the Biden admin numbers are now clearly rising even as the impartial ADP (which directly logs employment numbers at the company level and is far more accurate), shows an accelerating slowdown.

But it's more than just the Biden admin hanging its "success" on seasonal adjustments: when one digs deeper inside the jobs report, all sorts of ugly things emerge... such as the growing unprecedented divergence between the Establishment (payrolls) survey and much more accurate Household (actual employment) survey. To wit, while in January the BLS claims 275K payrolls were added, the Household survey found that the number of actually employed workers dropped for the third straight month (and 4 in the past 5), this time by 184K (from 161.152K to 160.968K).

This means that while the Payrolls series hits new all time highs every month since December 2020 (when according to the BLS the US had its last month of payrolls losses), the level of Employment has not budged in the past year. Worse, as shown in the chart below, such a gaping divergence has opened between the two series in the past 4 years, that the number of Employed workers would need to soar by 9 million (!) to catch up to what Payrolls claims is the employment situation.

There's more: shifting from a quantitative to a qualitative assessment, reveals just how ugly the composition of "new jobs" has been. Consider this: the BLS reports that in February 2024, the US had 132.9 million full-time jobs and 27.9 million part-time jobs. Well, that's great... until you look back one year and find that in February 2023 the US had 133.2 million full-time jobs, or more than it does one year later! And yes, all the job growth since then has been in part-time jobs, which have increased by 921K since February 2023 (from 27.020 million to 27.941 million).

Here is a summary of the labor composition in the past year: all the new jobs have been part-time jobs!

But wait there's even more, because now that the primary season is over and we enter the heart of election season and political talking points will be thrown around left and right, especially in the context of the immigration crisis created intentionally by the Biden administration which is hoping to import millions of new Democratic voters (maybe the US can hold the presidential election in Honduras or Guatemala, after all it is their citizens that will be illegally casting the key votes in November), what we find is that in February, the number of native-born workers tumbled again, sliding by a massive 560K to just 129.807 million. Add to this the December data, and we get a near-record 2.4 million plunge in native-born workers in just the past 3 months (only the covid crash was worse)!

The offset? A record 1.2 million foreign-born (read immigrants, both legal and illegal but mostly illegal) workers added in February!

Said otherwise, not only has all job creation in the past 6 years has been exclusively for foreign-born workers...

... but there has been zero job-creation for native born workers since June 2018!

This is a huge issue - especially at a time of an illegal alien flood at the southwest border...

... and is about to become a huge political scandal, because once the inevitable recession finally hits, there will be millions of furious unemployed Americans demanding a more accurate explanation for what happened - i.e., the illegal immigration floodgates that were opened by the Biden admin.
Which is also why Biden's handlers will do everything in their power to insure there is no official recession before November... and why after the election is over, all economic hell will finally break loose. Until then, however, expect the jobs numbers to get even more ridiculous.
International
Angry Shouting Aside, Here’s What Biden Is Running On
Angry Shouting Aside, Here’s What Biden Is Running On
Last night, Joe Biden gave an extremely dark, threatening, angry State of the Union…
Share this:


Last night, Joe Biden gave an extremely dark, threatening, angry State of the Union address - in which he insisted that the American economy is doing better than ever, blamed inflation on 'corporate greed,' and warned that Donald Trump poses an existential threat to the republic.
But in between the angry rhetoric, he also laid out his 2024 election platform - for which additional details will be released on March 11, when the White House sends its proposed budget to Congress.
To that end, Goldman Sachs' Alec Phillips and Tim Krupa have summarized the key points:
Taxes
While railing against billionaires (nothing new there), Biden repeated the claim that anyone making under $400,000 per year won't see an increase in their taxes. He also proposed a 21% corporate minimum tax, up from 15% on book income outlined in the Inflation Reduction Act (IRA), as well as raising the corporate tax rate from 21% to 28% (which would promptly be passed along to consumers in the form of more inflation). Goldman notes that "Congress is unlikely to consider any of these proposals this year, they would only come into play in a second Biden term, if Democrats also won House and Senate majorities."
Biden once again tells the complete lie that "nobody earning less than $400,000/year will pay additional penny in federal taxes."
— RNC Research (@RNCResearch) March 8, 2024
FACT: Biden has *already* raised the tax burden on Americans making as little as $20,000 per year. pic.twitter.com/VrZ1m0rzG3
Biden also called on Congress to restore the pandemic-era child tax credit.
Immigration
Instead of simply passing a slew of border security Executive Orders like the Trump ones he shredded on day one, Biden repeated the lie that Congress 'needs to act' before he can (translation: send money to Ukraine or the US border will continue to be a sieve).
As immigration comes into even greater focus heading into the election, we continue to expect the Administration to tighten policy (e.g., immigration has surged 20pp the last 7 months to first place with 28% in Gallup’s “most important problem” survey). As such, we estimate the foreign-born contribution to monthly labor force growth will moderate from 110k/month in 2023 to around 70-90k/month in 2024. -GS
SEE IT: Biden gets boo-ed while talking about his immigration bill. WATCH pic.twitter.com/O5FmkYx3xM
— Simon Ateba (@simonateba) March 8, 2024
Ukraine
Biden, with House Speaker Mike Johnson doing his best impression of a bobble-head, urged Congress to pass additional assistance for Ukraine based entirely on the premise that Russia 'won't stop' there (and would what, trigger article 5 and WW3 no matter what?), despite the fact that Putin explicitly told Tucker Carlson he has no further ambitions, and in fact seeks a settlement.
‼️ Breaking: Putin wants a negotiated settlement to what’s happening in Ukraine.
— Ed (@EdMagari) February 9, 2024
In a surprising turn of events, Tucker Carlson could be the key to peace, potentially playing a crucial role in ending the current conflict????️ pic.twitter.com/IKN8ajlEUX
As Goldman estimates, "While there is still a clear chance that such a deal could come together, for now there is no clear path forward for Ukraine aid in Congress."
China
Biden, forgetting about all the aggressive tariffs, suggested that Trump had been soft on China, and that he will stand up "against China's unfair economic practices" and "for peace and stability across the Taiwan Strait."
SOTU FACT CHECK:
— Wesley Hunt (@WesleyHuntTX) March 8, 2024
Biden claims we’re in a strong position to take on China.
No president in our lifetime has been WEAKER on China than Biden. pic.twitter.com/Y73JsIzmM3
Healthcare
Lastly, Biden proposed to expand drug price negotiations to 50 additional drugs each year (an increase from 20 outlined in the IRA), which Goldman said would likely require bipartisan support "even if Democrats controlled Congress and the White House," as such policies would likely be ineligible for the budget "reconciliation" process which has been used in previous years to pass the IRA and other major fiscal party when Congressional margins are just too thin.
So there you have it. With no actual accomplishments to speak of, Biden can only attack Trump, lie, and make empty promises.


Walmart launches clever answer to Target’s new membership program


Wendy’s has a new deal for daylight savings time haters


EyePoint poaches medical chief from Apellis; Sandoz CFO, longtime BioNTech exec to retire


Watch Live: President Biden Reminds Americans Just How Good They’ve Got It Thanks To Him


Catastrophic Risk: Investing and Business Implications


Redefining Poverty: Towards a Transpartisan Approach


The Digest #187


Gather ’round the crystal ball: A multi-commodity outlook from PDAC 2024


Watch: President Biden Delivers The “Darkest, Most Un-American Speech Given By A President”


Where Is R‑Star and the End of the Refi Boom: The Top 5 Posts of 2023
-

 Uncategorized2 weeks ago
All Of The Elements Are In Place For An Economic Crisis Of Staggering Proportions
-

 Uncategorized1 month ago
Cathie Wood sells a major tech stock (again)
-

 Uncategorized3 weeks ago
California Counties Could Be Forced To Pay $300 Million To Cover COVID-Era Program
-

 Uncategorized2 weeks ago
Apparel Retailer Express Moving Toward Bankruptcy
-

 Uncategorized3 weeks ago
Industrial Production Decreased 0.1% in January
-
International10 hours ago
Walmart launches clever answer to Target’s new membership program
-

 Uncategorized3 weeks ago
RFK Jr: The Wuhan Cover-Up & The Rise Of The Biowarfare-Industrial Complex
-

 Uncategorized3 weeks ago
GOP Efforts To Shore Up Election Security In Swing States Face Challenges