Travel Insurance Market Size to Grow by USD 9.88 Billion, Growing Tourism and Business Travels will Present Growth Opportunities – Technavio
Travel Insurance Market Size to Grow by USD 9.88 Billion, Growing Tourism and Business Travels will Present Growth Opportunities – Technavio
PR Newswire
NEW YORK, Sept. 19, 2022
NEW YORK, Sept. 19, 2022 /PRNewswire/ — The travel insurance market w…
Share this:

Travel Insurance Market Size to Grow by USD 9.88 Billion, Growing Tourism and Business Travels will Present Growth Opportunities - Technavio
PR Newswire
NEW YORK, Sept. 19, 2022
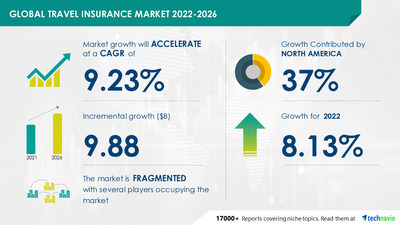
NEW YORK, Sept. 19, 2022 /PRNewswire/ -- The travel insurance market will be dominated by North America during the forecast period. Many people in the region opt for adventure sports, which pose high risks. Therefore, vendors offer special and customized policies to meet customers' requirements. This will drive the travel insurance market growth in North America during the forecast period. However, market growth in this region will be slower than the growth of the market in other regions. The US and Canada are the key countries for the travel insurance market in North America.
The global travel insurance market size is expected to grow by USD 9.88 bn from 2021 to 2026, as per Technavio's report. In addition, the growth momentum of the market is expected to accelerate at a CAGR of 9.23% during the forecast period.
Technavio provides a comprehensive report summary describing the market size and forecast along with research methodology. The FREE sample report is available in PDF format
The growing tourism and business travel is driving the growth of the market. The rise in disposable incomes, increase in business travel, and the easy availability of online travel bookings have led to the growth of the travel and tourism industry. Governments of various countries, such as the US, the UK, Australia, Germany, and Belgium, have made travel insurance mandatory for visas, which is also contributing to market growth. Major vendors are integrating digital tools, such as artificial intelligence (AI), application program interface (API), data analytics, and global positioning system (GPS), to improve distribution systems and provide a personalized user experience. Some insurers also offer insurance cover for COVID-19-related medical expenses.
Insurance for unconventional expenses is a trend in the market. In the US, vacation rentals are popular. Most vacation rentals have cancelation policies that protect the guests and hosts and generate little or no reimbursements. People can list and choose rentals on websites such as Airbnb, Home Away, and Roomorama. If a tourist books a rental offered by these vendors, then the travel is covered under the travel insurance policy. The cost includes deposits, expenses, and cancelation fees in such rentals.
- Allianz Group
- American Express Co.
- American International Group Inc.
- Arch Capital Group Ltd.
- Aviva Plc
- AXA Group
- Berkshire Hathaway Specialty Insurance Co.
- Groupama Assurances Mutuelles
- HanseMerkur Reiseversicherung AG
- HDFC Bank Ltd.
- HTH Travel Insurance
- IMG Travel Insurance
- Insure and Go Insurance Services Ltd.
- Seven Corners Inc.
- Travel Insured International
- Travelex Group Companies
- TravelSafe Insurance
- Trip Mate Inc.
- USI Insurance Services
- Zurich Insurance Co. Ltd.
Get lifetime access to our Technavio Insights! Subscribe to our "Basic Plan" billed annually at USD 5000
- Senior citizens - size and forecast 2021-2026
- Business travel - size and forecast 2021-2026
- Family travel - size and forecast 2021-2026
- Others - size and forecast 2021-2026
- North America - size and forecast 2021-2026
- Europe - size and forecast 2021-2026
- APAC - size and forecast 2021-2026
- Middle East and Africa - size and forecast 2021-2026
- South America - size and forecast 2021-2026
Learn about the contribution of each segment summarized in concise infographics and thorough descriptions. View a FREE PDF Sample Report
Reinsurance Market Growth, Size, Trends, Analysis Report by Type, Application, Region and Segment Forecast 2022-2026: The reinsurance market share is expected to increase by USD 328.62 billion from 2021 to 2026.
Pet Insurance Market Growth, Size, Trends, Analysis Report by Type, Application, Region and Segment Forecast 2022-2026: The pet insurance market share is expected to increase by USD 12.05 billion from 2021 to 2026.
Travel Insurance Market Scope | |
Report Coverage | Details |
Page number | 120 |
Base year | 2021 |
Forecast period | 2022-2026 |
Growth momentum & CAGR | Accelerate at a CAGR of 9.23% |
Market growth 2022-2026 | USD 9.88 billion |
Market structure | Fragmented |
YoY growth (%) | 8.13 |
Regional analysis | North America, Europe, APAC, Middle East and Africa, and South America |
Performing market contribution | North America at 37% |
Key consumer countries | US, Canada, China, Germany, and UK |
Competitive landscape | Leading companies, Competitive strategies, Consumer engagement scope |
Key companies profiled | Allianz Group, American Express Co., American International Group Inc., Arch Capital Group Ltd., Aviva Plc, AXA Group, Berkshire Hathaway Specialty Insurance Co., Groupama Assurances Mutuelles, HanseMerkur Reiseversicherung AG, HDFC Bank Ltd., HTH Travel Insurance, IMG Travel Insurance, Insure and Go Insurance Services Ltd., Seven Corners Inc., Travel Insured International, Travelex Group Companies, TravelSafe Insurance, Trip Mate Inc., USI Insurance Services, and Zurich Insurance Co. Ltd. |
Market dynamics | Parent market analysis, market growth inducers and obstacles, fast-growing and slow-growing segment analysis, COVID-19 impact and recovery analysis and future consumer dynamics, and market condition analysis for the forecast period. |
Customization purview | If our report has not included the data that you are looking for, you can reach out to our analysts and get segments customized. |
Browse Consumer Discretionary Market Reports
1 Executive Summary
- 1.1 Market overview
- Exhibit 01: Executive Summary – Chart on Market Overview
- Exhibit 02: Executive Summary – Data Table on Market Overview
- Exhibit 03: Executive Summary – Chart on Global Market Characteristics
- Exhibit 04: Executive Summary – Chart on Market by Geography
- Exhibit 05: Executive Summary – Chart on Market Segmentation by End-user
- Exhibit 06: Executive Summary – Chart on Incremental Growth
- Exhibit 07: Executive Summary – Data Table on Incremental Growth
- Exhibit 08: Executive Summary – Chart on Vendor Market Positioning
2 Market Landscape
- 2.1 Market ecosystem
- Exhibit 09: Parent market
- Exhibit 10: Market Characteristics
3 Market Sizing
- 3.1 Market definition
- Exhibit 11: Offerings of vendors included in the market definition
- 3.2 Market segment analysis
- Exhibit 12: Market segments
- 3.3 Market size 2021
- 3.4 Market outlook: Forecast for 2021-2026
- Exhibit 13: Chart on Global - Market size and forecast 2021-2026 ($ million)
- Exhibit 14: Data Table on Global - Market size and forecast 2021-2026 ($ million)
- Exhibit 15: Chart on Global Market: Year-over-year growth 2021-2026 (%)
- Exhibit 16: Data Table on Global Market: Year-over-year growth 2021-2026 (%)
4 Five Forces Analysis
- 4.1 Five forces summary
- Exhibit 17: Five forces analysis - Comparison between 2021 and 2026
- 4.2 Bargaining power of buyers
- Exhibit 18: Chart on Bargaining power of buyers – Impact of key factors 2021 and 2026
- 4.3 Bargaining power of suppliers
- Exhibit 19: Bargaining power of suppliers – Impact of key factors in 2021 and 2026
- 4.4 Threat of new entrants
- Exhibit 20: Threat of new entrants – Impact of key factors in 2021 and 2026
- 4.5 Threat of substitutes
- Exhibit 21: Threat of substitutes – Impact of key factors in 2021 and 2026
- 4.6 Threat of rivalry
- Exhibit 22: Threat of rivalry – Impact of key factors in 2021 and 2026
- 4.7 Market condition
- Exhibit 23: Chart on Market condition - Five forces 2021 and 2026
5 Market Segmentation by End-user
- 5.1 Market segments
- Exhibit 24: Chart on End-user - Market share 2021-2026 (%)
- Exhibit 25: Data Table on End-user - Market share 2021-2026 (%)
- 5.2 Comparison by End-user
- Exhibit 26: Chart on Comparison by End-user
- Exhibit 27: Data Table on Comparison by End-user
- 5.3 Senior citizens - Market size and forecast 2021-2026
- Exhibit 28: Chart on Senior citizens - Market size and forecast 2021-2026 ($ million)
- Exhibit 29: Data Table on Senior citizens - Market size and forecast 2021-2026 ($ million)
- Exhibit 30: Chart on Senior citizens - Year-over-year growth 2021-2026 (%)
- Exhibit 31: Data Table on Senior citizens - Year-over-year growth 2021-2026 (%)
- 5.4 Business Travel - Market size and forecast 2021-2026
- Exhibit 32: Chart on Business Travel - Market size and forecast 2021-2026 ($ million)
- Exhibit 33: Data Table on Business Travel - Market size and forecast 2021-2026 ($ million)
- Exhibit 34: Chart on Business Travel - Year-over-year growth 2021-2026 (%)
- Exhibit 35: Data Table on Business Travel - Year-over-year growth 2021-2026 (%)
- 5.5 Family Travel - Market size and forecast 2021-2026
- Exhibit 36: Chart on Family Travel - Market size and forecast 2021-2026 ($ million)
- Exhibit 37: Data Table on Family Travel - Market size and forecast 2021-2026 ($ million)
- Exhibit 38: Chart on Family Travel - Year-over-year growth 2021-2026 (%)
- Exhibit 39: Data Table on Family Travel - Year-over-year growth 2021-2026 (%)
- 5.6 Others - Market size and forecast 2021-2026
- Exhibit 40: Chart on Others - Market size and forecast 2021-2026 ($ million)
- Exhibit 41: Data Table on Others - Market size and forecast 2021-2026 ($ million)
- Exhibit 42: Chart on Others - Year-over-year growth 2021-2026 (%)
- Exhibit 43: Data Table on Others - Year-over-year growth 2021-2026 (%)
- 5.7 Market opportunity by End-user
- Exhibit 44: Market opportunity by End-user ($ million)
6 Customer Landscape
- 6.1 Customer landscape overview
- Exhibit 45: Analysis of price sensitivity, lifecycle, customer purchase basket, adoption rates, and purchase criteria
7 Geographic Landscape
- 7.1 Geographic segmentation
- Exhibit 46: Chart on Market share by geography 2021-2026 (%)
- Exhibit 47: Data Table on Market share by geography 2021-2026 (%)
- 7.2 Geographic comparison
- Exhibit 48: Chart on Geographic comparison
- Exhibit 49: Data Table on Geographic comparison
- 7.3 North America - Market size and forecast 2021-2026
- Exhibit 50: Chart on North America - Market size and forecast 2021-2026 ($ million)
- Exhibit 51: Data Table on North America - Market size and forecast 2021-2026 ($ million)
- Exhibit 52: Chart on North America - Year-over-year growth 2021-2026 (%)
- Exhibit 53: Data Table on North America - Year-over-year growth 2021-2026 (%)
- 7.4 Europe - Market size and forecast 2021-2026
- Exhibit 54: Chart on Europe - Market size and forecast 2021-2026 ($ million)
- Exhibit 55: Data Table on Europe - Market size and forecast 2021-2026 ($ million)
- Exhibit 56: Chart on Europe - Year-over-year growth 2021-2026 (%)
- Exhibit 57: Data Table on Europe - Year-over-year growth 2021-2026 (%)
- 7.5 APAC - Market size and forecast 2021-2026
- Exhibit 58: Chart on APAC - Market size and forecast 2021-2026 ($ million)
- Exhibit 59: Data Table on APAC - Market size and forecast 2021-2026 ($ million)
- Exhibit 60: Chart on APAC - Year-over-year growth 2021-2026 (%)
- Exhibit 61: Data Table on APAC - Year-over-year growth 2021-2026 (%)
- 7.6 Middle East and Africa - Market size and forecast 2021-2026
- Exhibit 62: Chart on Middle East and Africa - Market size and forecast 2021-2026 ($ million)
- Exhibit 63: Data Table on Middle East and Africa - Market size and forecast 2021-2026 ($ million)
- Exhibit 64: Chart on Middle East and Africa - Year-over-year growth 2021-2026 (%)
- Exhibit 65: Data Table on Middle East and Africa - Year-over-year growth 2021-2026 (%)
- 7.7 South America - Market size and forecast 2021-2026
- Exhibit 66: Chart on South America - Market size and forecast 2021-2026 ($ million)
- Exhibit 67: Data Table on South America - Market size and forecast 2021-2026 ($ million)
- Exhibit 68: Chart on South America - Year-over-year growth 2021-2026 (%)
- Exhibit 69: Data Table on South America - Year-over-year growth 2021-2026 (%)
- 7.8 US - Market size and forecast 2021-2026
- Exhibit 70: Chart on US - Market size and forecast 2021-2026 ($ million)
- Exhibit 71: Data Table on US - Market size and forecast 2021-2026 ($ million)
- Exhibit 72: Chart on US - Year-over-year growth 2021-2026 (%)
- Exhibit 73: Data Table on US - Year-over-year growth 2021-2026 (%)
- 7.9 China - Market size and forecast 2021-2026
- Exhibit 74: Chart on China - Market size and forecast 2021-2026 ($ million)
- Exhibit 75: Data Table on China - Market size and forecast 2021-2026 ($ million)
- Exhibit 76: Chart on China - Year-over-year growth 2021-2026 (%)
- Exhibit 77: Data Table on China - Year-over-year growth 2021-2026 (%)
- 7.10 Germany - Market size and forecast 2021-2026
- Exhibit 78: Chart on Germany - Market size and forecast 2021-2026 ($ million)
- Exhibit 79: Data Table on Germany - Market size and forecast 2021-2026 ($ million)
- Exhibit 80: Chart on Germany - Year-over-year growth 2021-2026 (%)
- Exhibit 81: Data Table on Germany - Year-over-year growth 2021-2026 (%)
- 7.11 UK - Market size and forecast 2021-2026
- Exhibit 82: Chart on UK - Market size and forecast 2021-2026 ($ million)
- Exhibit 83: Data Table on UK - Market size and forecast 2021-2026 ($ million)
- Exhibit 84: Chart on UK - Year-over-year growth 2021-2026 (%)
- Exhibit 85: Data Table on UK - Year-over-year growth 2021-2026 (%)
- 7.12 Canada - Market size and forecast 2021-2026
- Exhibit 86: Chart on Canada - Market size and forecast 2021-2026 ($ million)
- Exhibit 87: Data Table on Canada - Market size and forecast 2021-2026 ($ million)
- Exhibit 88: Chart on Canada - Year-over-year growth 2021-2026 (%)
- Exhibit 89: Data Table on Canada - Year-over-year growth 2021-2026 (%)
- 7.13 Market opportunity by geography
- Exhibit 90: Market opportunity by geography ($ million)
8 Drivers, Challenges, and Trends
- 8.1 Market drivers
- 8.2 Market challenges
- 8.3 Impact of drivers and challenges
- Exhibit 91: Impact of drivers and challenges in 2021 and 2026
- 8.4 Market trends
9 Vendor Landscape
- 9.1 Overview
- 9.2 Vendor landscape
- Exhibit 92: Overview on Criticality of inputs and Factors of differentiation
- 9.3 Landscape disruption
- Exhibit 93: Overview on factors of disruption
- 9.4 Industry risks
- Exhibit 94: Impact of key risks on business
10 Vendor Analysis
- 10.1 Vendors covered
- Exhibit 95: Vendors covered
- 10.2 Market positioning of vendors
- Exhibit 96: Matrix on vendor position and classification
- 10.3 Allianz Group
- Exhibit 97: Allianz Group - Overview
- Exhibit 98: Allianz Group - Business segments
- Exhibit 99: Allianz Group - Key news
- Exhibit 100: Allianz Group - Key offerings
- Exhibit 101: Allianz Group - Segment focus
- 10.4 American Express Co.
- Exhibit 102: American Express Co. - Overview
- Exhibit 103: American Express Co. - Business segments
- Exhibit 104: American Express Co. - Key offerings
- Exhibit 105: American Express Co. - Segment focus
- 10.5 American International Group Inc.
- Exhibit 106: American International Group Inc. - Overview
- Exhibit 107: American International Group Inc. - Business segments
- Exhibit 108: American International Group Inc. - Key news
- Exhibit 109: American International Group Inc. - Key offerings
- Exhibit 110: American International Group Inc. - Segment focus
- 10.6 AXA Group
- Exhibit 111: AXA Group - Overview
- Exhibit 112: AXA Group - Business segments
- Exhibit 113: AXA Group - Key offerings
- Exhibit 114: AXA Group - Segment focus
- 10.7 Insure and Go Insurance Services Ltd.
- Exhibit 115: Insure and Go Insurance Services Ltd. - Overview
- Exhibit 116: Insure and Go Insurance Services Ltd. - Product / Service
- Exhibit 117: Insure and Go Insurance Services Ltd. - Key offerings
- 10.8 Seven Corners Inc.
- Exhibit 118: Seven Corners Inc. - Overview
- Exhibit 119: Seven Corners Inc. - Product / Service
- Exhibit 120: Seven Corners Inc. - Key offerings
- 10.9 Travel Insured International
- Exhibit 121: Travel Insured International - Overview
- Exhibit 122: Travel Insured International - Product / Service
- Exhibit 123: Travel Insured International - Key offerings
- 10.10 Trip Mate Inc.
- Exhibit 124: Trip Mate Inc. - Overview
- Exhibit 125: Trip Mate Inc. - Product / Service
- Exhibit 126: Trip Mate Inc. - Key offerings
- 10.11 USI Insurance Services
- Exhibit 127: USI Insurance Services - Overview
- Exhibit 128: USI Insurance Services - Product / Service
- Exhibit 129: USI Insurance Services - Key offerings
- 10.12 Zurich Insurance Co. Ltd.
- Exhibit 130: Zurich Insurance Co. Ltd. - Overview
- Exhibit 131: Zurich Insurance Co. Ltd. - Business segments
- Exhibit 132: Zurich Insurance Co. Ltd. - Key offerings
- Exhibit 133: Zurich Insurance Co. Ltd. - Segment focus
11 Appendix
- 11.1 Scope of the report
- 11.2 Inclusions and exclusions checklist
- Exhibit 134: Inclusions checklist
- Exhibit 135: Exclusions checklist
- 11.3 Currency conversion rates for US$
- Exhibit 136: Currency conversion rates for US$
- 11.4 Research methodology
- Exhibit 137: Research methodology
- Exhibit 138: Validation techniques employed for market sizing
- Exhibit 139: Information sources
- 11.5 List of abbreviations
- Exhibit 140: List of abbreviations
Technavio is a leading global technology research and advisory company. Their research and analysis focus on emerging market trends and provide actionable insights to help businesses identify market opportunities and develop effective strategies to optimize their market positions.
With over 500 specialized analysts, Technavio's report library consists of more than 17,000 reports and counting, covering 800 technologies, spanning across 50 countries. Their client base consists of enterprises of all sizes, including more than 100 Fortune 500 companies. This growing client base relies on Technavio's comprehensive coverage, extensive research, and actionable market insights to identify opportunities in existing and potential markets and assess their competitive positions within changing market scenarios.
Contacts
Technavio Research
Jesse Maida
Media & Marketing Executive
US: +1 844 364 1100
UK: +44 203 893 3200
Email: media@technavio.com
Website: www.technavio.com/

View original content to download multimedia:https://www.prnewswire.com/news-releases/travel-insurance-market-size-to-grow-by-usd-9-88-billion-growing-tourism-and-business-travels-will-present-growth-opportunities---technavio-301626265.html
SOURCE Technavio
Uncategorized
February Employment Situation
By Paul Gomme and Peter Rupert The establishment data from the BLS showed a 275,000 increase in payroll employment for February, outpacing the 230,000…
Share this:


By Paul Gomme and Peter Rupert
The establishment data from the BLS showed a 275,000 increase in payroll employment for February, outpacing the 230,000 average over the previous 12 months. The payroll data for January and December were revised down by a total of 167,000. The private sector added 223,000 new jobs, the largest gain since May of last year.

Temporary help services employment continues a steep decline after a sharp post-pandemic rise.


Average hours of work increased from 34.2 to 34.3. The increase, along with the 223,000 private employment increase led to a hefty increase in total hours of 5.6% at an annualized rate, also the largest increase since May of last year.

The establishment report, once again, beat “expectations;” the WSJ survey of economists was 198,000. Other than the downward revisions, mentioned above, another bit of negative news was a smallish increase in wage growth, from $34.52 to $34.57.

The household survey shows that the labor force increased 150,000, a drop in employment of 184,000 and an increase in the number of unemployed persons of 334,000. The labor force participation rate held steady at 62.5, the employment to population ratio decreased from 60.2 to 60.1 and the unemployment rate increased from 3.66 to 3.86. Remember that the unemployment rate is the number of unemployed relative to the labor force (the number employed plus the number unemployed). Consequently, the unemployment rate can go up if the number of unemployed rises holding fixed the labor force, or if the labor force shrinks holding the number unemployed unchanged. An increase in the unemployment rate is not necessarily a bad thing: it may reflect a strong labor market drawing “marginally attached” individuals from outside the labor force. Indeed, there was a 96,000 decline in those workers.


Earlier in the week, the BLS announced JOLTS (Job Openings and Labor Turnover Survey) data for January. There isn’t much to report here as the job openings changed little at 8.9 million, the number of hires and total separations were little changed at 5.7 million and 5.3 million, respectively.

As has been the case for the last couple of years, the number of job openings remains higher than the number of unemployed persons.

Also earlier in the week the BLS announced that productivity increased 3.2% in the 4th quarter with output rising 3.5% and hours of work rising 0.3%.

The bottom line is that the labor market continues its surprisingly (to some) strong performance, once again proving stronger than many had expected. This strength makes it difficult to justify any interest rate cuts soon, particularly given the recent inflation spike.
unemployment pandemic unemploymentSpread & Containment
Another beloved brewery files Chapter 11 bankruptcy
The beer industry has been devastated by covid, changing tastes, and maybe fallout from the Bud Light scandal.
Share this:


Before the covid pandemic, craft beer was having a moment. Most cities had multiple breweries and taprooms with some having so many that people put together the brewery version of a pub crawl.
It was a period where beer snobbery ruled the day and it was not uncommon to hear bar patrons discuss the makeup of the beer the beer they were drinking. This boom period always seemed destined for failure, or at least a retraction as many markets seemed to have more craft breweries than they could support.
Related: Fast-food chain closes more stores after Chapter 11 bankruptcy
The pandemic, however, hastened that downfall. Many of these local and regional craft breweries counted on in-person sales to drive their business.
And while many had local and regional distribution, selling through a third party comes with much lower margins. Direct sales drove their business and the pandemic forced many breweries to shut down their taprooms during the period where social distancing rules were in effect.
During those months the breweries still had rent and employees to pay while little money was coming in. That led to a number of popular beermakers including San Francisco's nationally-known Anchor Brewing as well as many regional favorites including Chicago’s Metropolitan Brewing, New Jersey’s Flying Fish, Denver’s Joyride Brewing, Tampa’s Zydeco Brew Werks, and Cleveland’s Terrestrial Brewing filing bankruptcy.
Some of these brands hope to survive, but others, including Anchor Brewing, fell into Chapter 7 liquidation. Now, another domino has fallen as a popular regional brewery has filed for Chapter 11 bankruptcy protection.
Image source: Shutterstock
Covid is not the only reason for brewery bankruptcies
While covid deserves some of the blame for brewery failures, it's not the only reason why so many have filed for bankruptcy protection. Overall beer sales have fallen driven by younger people embracing non-alcoholic cocktails, and the rise in popularity of non-beer alcoholic offerings,
Beer sales have fallen to their lowest levels since 1999 and some industry analysts
"Sales declined by more than 5% in the first nine months of the year, dragged down not only by the backlash and boycotts against Anheuser-Busch-owned Bud Light but the changing habits of younger drinkers," according to data from Beer Marketer’s Insights published by the New York Post.
Bud Light parent Anheuser Busch InBev (BUD) faced massive boycotts after it partnered with transgender social media influencer Dylan Mulvaney. It was a very small partnership but it led to a right-wing backlash spurred on by Kid Rock, who posted a video on social media where he chastised the company before shooting up cases of Bud Light with an automatic weapon.
Another brewery files Chapter 11 bankruptcy
Gizmo Brew Works, which does business under the name Roth Brewing Company LLC, filed for Chapter 11 bankruptcy protection on March 8. In its filing, the company checked the box that indicates that its debts are less than $7.5 million and it chooses to proceed under Subchapter V of Chapter 11.
"Both small business and subchapter V cases are treated differently than a traditional chapter 11 case primarily due to accelerated deadlines and the speed with which the plan is confirmed," USCourts.gov explained.
Roth Brewing/Gizmo Brew Works shared that it has 50-99 creditors and assets $100,000 and $500,000. The filing noted that the company does expect to have funds available for unsecured creditors.
The popular brewery operates three taprooms and sells its beer to go at those locations.
"Join us at Gizmo Brew Works Craft Brewery and Taprooms located in Raleigh, Durham, and Chapel Hill, North Carolina. Find us for entertainment, live music, food trucks, beer specials, and most importantly, great-tasting craft beer by Gizmo Brew Works," the company shared on its website.
The company estimates that it has between $1 and $10 million in liabilities (a broad range as the bankruptcy form does not provide a space to be more specific).
Gizmo Brew Works/Roth Brewing did not share a reorganization or funding plan in its bankruptcy filing. An email request for comment sent through the company's contact page was not immediately returned.
bankruptcy pandemic social distancing
Government
Walmart joins Costco in sharing key pricing news
The massive retailers have both shared information that some retailers keep very close to the vest.
Share this:


As we head toward a presidential election, the presumed candidates for both parties will look for issues that rally undecided voters.
The economy will be a key issue, with Democrats pointing to job creation and lowering prices while Republicans will cite the layoffs at Big Tech companies, high housing prices, and of course, sticky inflation.
The covid pandemic created a perfect storm for inflation and higher prices. It became harder to get many items because people getting sick slowed down, or even stopped, production at some factories.
Related: Popular mall retailer shuts down abruptly after bankruptcy filing
It was also a period where demand increased while shipping, trucking and delivery systems were all strained or thrown out of whack. The combination led to product shortages and higher prices.
You might have gone to the grocery store and not been able to buy your favorite paper towel brand or find toilet paper at all. That happened partly because of the supply chain and partly due to increased demand, but at the end of the day, it led to higher prices, which some consumers blamed on President Joe Biden's administration.
Biden, of course, was blamed for the price increases, but as inflation has dropped and grocery prices have fallen, few companies have been up front about it. That's probably not a political choice in most cases. Instead, some companies have chosen to lower prices more slowly than they raised them.
However, two major retailers, Walmart (WMT) and Costco, have been very honest about inflation. Walmart Chief Executive Doug McMillon's most recent comments validate what Biden's administration has been saying about the state of the economy. And they contrast with the economic picture being painted by Republicans who support their presumptive nominee, Donald Trump.
Image source: Joe Raedle/Getty Images
Walmart sees lower prices
McMillon does not talk about lower prices to make a political statement. He's communicating with customers and potential customers through the analysts who cover the company's quarterly-earnings calls.
During Walmart's fiscal-fourth-quarter-earnings call, McMillon was clear that prices are going down.
"I'm excited about the omnichannel net promoter score trends the team is driving. Across countries, we continue to see a customer that's resilient but looking for value. As always, we're working hard to deliver that for them, including through our rollbacks on food pricing in Walmart U.S. Those were up significantly in Q4 versus last year, following a big increase in Q3," he said.
He was specific about where the chain has seen prices go down.
"Our general merchandise prices are lower than a year ago and even two years ago in some categories, which means our customers are finding value in areas like apparel and hard lines," he said. "In food, prices are lower than a year ago in places like eggs, apples, and deli snacks, but higher in other places like asparagus and blackberries."
McMillon said that in other areas prices were still up but have been falling.
"Dry grocery and consumables categories like paper goods and cleaning supplies are up mid-single digits versus last year and high teens versus two years ago. Private-brand penetration is up in many of the countries where we operate, including the United States," he said.
Costco sees almost no inflation impact
McMillon avoided the word inflation in his comments. Costco (COST) Chief Financial Officer Richard Galanti, who steps down on March 15, has been very transparent on the topic.
The CFO commented on inflation during his company's fiscal-first-quarter-earnings call.
"Most recently, in the last fourth-quarter discussion, we had estimated that year-over-year inflation was in the 1% to 2% range. Our estimate for the quarter just ended, that inflation was in the 0% to 1% range," he said.
Galanti made clear that inflation (and even deflation) varied by category.
"A bigger deflation in some big and bulky items like furniture sets due to lower freight costs year over year, as well as on things like domestics, bulky lower-priced items, again, where the freight cost is significant. Some deflationary items were as much as 20% to 30% and, again, mostly freight-related," he added.
bankruptcy pandemic trump

Walmart launches clever answer to Target’s new membership program


EyePoint poaches medical chief from Apellis; Sandoz CFO, longtime BioNTech exec to retire


Wendy’s has a new deal for daylight savings time haters


Watch Live: President Biden Reminds Americans Just How Good They’ve Got It Thanks To Him


Catastrophic Risk: Investing and Business Implications


The Digest #187


When Military Rule Supplants Democracy


Racial and Ethnic Wealth Inequality in the Post‑Pandemic Era


Redefining Poverty: Towards a Transpartisan Approach


Gather ’round the crystal ball: A multi-commodity outlook from PDAC 2024
-

 Uncategorized2 weeks ago
All Of The Elements Are In Place For An Economic Crisis Of Staggering Proportions
-

 Uncategorized1 month ago
Cathie Wood sells a major tech stock (again)
-

 Uncategorized3 weeks ago
California Counties Could Be Forced To Pay $300 Million To Cover COVID-Era Program
-

 Uncategorized2 weeks ago
Apparel Retailer Express Moving Toward Bankruptcy
-

 Uncategorized3 weeks ago
Industrial Production Decreased 0.1% in January
-
International1 day ago
Walmart launches clever answer to Target’s new membership program
-

 Uncategorized3 weeks ago
RFK Jr: The Wuhan Cover-Up & The Rise Of The Biowarfare-Industrial Complex
-

 Uncategorized3 weeks ago
GOP Efforts To Shore Up Election Security In Swing States Face Challenges