Don’t be fooled by the news, the bitcoin price and stock market is stabilizing and natural gas stores are more than full. We may be past the worst days.
“Fed Watch” is a macro podcast, true to bitcoin’s rebel nature. In each episode, we question mainstream and Bitcoin narratives by examining current events in macro from across the globe, with an emphasis on central banks and currencies.
In this episode, CK and I cover a large chunk of the ongoing macro news. First, we update the situation in the U.K. gilt market. Then swing over to China to cover developments from the 20th Party Congress, the real estate market and the general investment climate. Lastly, we discuss the European energy crisis and current storage situation.
Charts And Bitcoin Sentiment
Each week, CK and I lead off with a few charts including bitcoin and other currencies to center our macro conversation from that perspective.
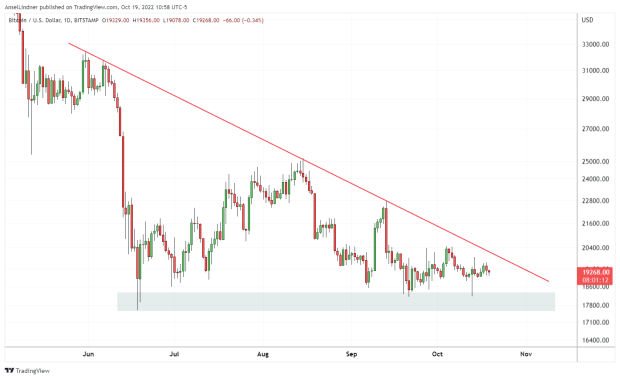
In the week of October 17, 2022, the bitcoin chart was showing continuing strong support in the range of $17,500-$18,500 despite all the geopolitical and global economic stresses happening. The stability of bitcoin relative to most other assets must be getting noticed by people managing large capital pools in the world.
Bitcoin daily chart
CK and I also spoke briefly about the U.S. stock market and its similarly stable performance. If you were only to listen and read the mainstream financial press and never look at the charts, you might be fooled into thinking stocks were much lower, or at least falling on a daily basis. However, as it stands now, the S&P 500 is abovethe June low.
S&P 500 chart
Below is my dueling dollar indices chart, showing the DXY which is heavily weighted toward the euro and yen, and the broad trade-weighted dollar index that includes many more currencies depending on their share of trade with the United States. Importantly, this includes the Chinese yuan and Mexican peso.
As you can see, the trade-weighted dollar performed better during the initial COVID-19 crash, but has lagged the euro-heavy DXY. What this means is dollar strength has become more broad-based in the last couple of weeks.
DXY versus trade-weighted Dollar
The last currency chart we analyze is the Japanese yen, which is crashing versus the dollar, reaching 150 yen to the dollar. In the broadcast, I mention that this is an example of the dollar’s current effects throughout East Asian currencies.
USD/JPY
United Kingdom Gilt Recap And Credit Suisse
Admittedly, CK and I have not watched the crisis in the U.K. as closely as other things, so we take an opportunity to recap the timeline of what’s gone on there so far.
The Bank of England (BoE) announced intervention on September 28, after the long-term gilt market sold off from roughly 2% yields to 4.5% yields in a matter of weeks. On earlier shows, I mentioned the importance of the end of the Q3 for financial stress, which is well known, but for some reason the BoE decided to begin quantitative tightening (QT) one week prior to the end of the quarter.
On October 3, the BoE adjusted their intervention size up to £10 billion per day, and an end date for the program of October 14. Most economic commentators did not think it would be possible to end it so quickly and in such a telegraphed manner. They were proven wrong, as the “no quantitative easing” program ended on the projected date. The latest is that the BoE will resume their QT attempts on November 1.
We also spoke about the interesting coincidence of the emergency swap lines between the Federal Reserve and the Swiss National Bank (SNB) that took place during the peak of the BoE’s troubles. I speculated that this swap line could have served as an obscured bailout of these troubled financial institutions in London, routed through the SNB.
The crisis seems to be under control for the moment, but the damage may have been done. In these financial crisis episodes, confidence is broken and despite the acute panic being over, the market is shifted to a more fragile state of mind going forward. This can lead to the crisis popping back up after a few months.
China’s Economy And The 20th Party Congress
I did not pull any quotes for the show from Xi Jinping’s two-hour opening speech. I provided a link to the full transcript and I encourage people to read it for themselves. It is eye-opening to see the rhetoric, the devotion to Marxist-Leninist communism and the hubris of authoritarian central planners.
What I did cover directly in the episode was a blog post by BlackRock and a tweet thread by Michael Pettis, confirming some of my views on the state of China today and their path in the near term.
BlackRock’s words are important as they represent what large capital pools think about China. From their post, we learn that Chinese export volumes are likely to be down 6% this year and next, although in nominal dollar terms they will be up 3%. The authors also note the horrific demographic situation in China and say it precludes the needed domestic growth to counteract the effect of shrinking exports. In a country with massive debt and demographic issues, this is not a recipe for economic growth.
“Recession is looming now for the U.S., U.K. and Europe. But this time, China won’t be coming to its own, or anyone else’s, rescue.”
Michael Pettis, Senior Fellow at the Carnegie Endowment and professor of finance at Peking University’s Guanghua School of Management, seems to agree with the direction of the Chinese economy in the medium term. His tweet thread exposes the no-win situation faced by the Ministry of Finance in China.
The Ministry of Finance said that state-backed entities are strictly prohibited from purchasing land by raising debt. Pettis agrees with this prohibition, because “local governments [reversing] the decline in land-sale revenues by setting up SPVs to buy land from themselves [as] a way for them to borrow money and pretend the proceeds were actually land-sale revenues.”
Pettis, however, emphasizes the same no-win scenario facing the Ministry of Finance that the BlackRock comments did. Namely, that Beijing has no room to stimulate. They are cracking down, but not offering any help.
“The MoF stopped them from faking revenues without addressing the reasons they had to do so.”
Pettis continues:
“Beijing must know how difficult the circumstances are that local governments face, and yet isn't doing much to help. I think we are probably seeing the beginning of what over the next few years will be a very contentious relationship between local governments and Beijing.”
This does not bode well for Beijing and Xi, especially as the U.S. rhetoric, sanctions on chip manufacturing and arming of Taiwan is picking up pace. There is a real existential threat to the Chinese Communist Party appearing.
European Energy Non-Crisis?
We had Andreas Steno on the show a few weeks ago, because I wanted to hear his sober analysis of the European energy crisis. He was the one analyst I saw pushing back against the panic narrative.
He is back in the form of a tweet thread this week and on the show I quickly read through the highlights. They are:
Natural gas storage is nearly full in Europe way ahead of schedule.
Energy prices are rapidly coming down to normal.
There is a huge backlog in liquid natural gas ships off Europe’s coasts waiting to unload.
What struck me about this analysis is how much it reminded me of the April 2020 oil futures crash. At the time, oil storage was full and tankers were loitering around the world — also full. There was simply no place to take delivery of the futures contracts, so holders had to sell at any price, causing a flash crash to zero.
Could we see the same thing in Europe this month? Not quite yet, but it is at least a possibility. What a clown world turn of events. From massive record highs to a zero price being a possibility in a matter of months.
This is a guest post by Ansel Lindner. Opinions expressed are entirely their own and do not necessarily reflect those of BTC Inc. or Bitcoin Magazine.
BUFFALO, NY- March 11, 2024 – Impact Journals publishes scholarly journals in the biomedical sciences with a focus on all areas of cancer and aging research. Aging is one of the most prominent journals published by Impact Journals.
Credit: Impact Journals
BUFFALO, NY- March 11, 2024 – Impact Journals publishes scholarly journals in the biomedical sciences with a focus on all areas of cancer and aging research. Aging is one of the most prominent journals published by Impact Journals.
Impact Journals will be participating as an exhibitor at the American Association for Cancer Research (AACR) Annual Meeting 2024 from April 5-10 at the San Diego Convention Center in San Diego, California. This year, the AACR meeting theme is “Inspiring Science • Fueling Progress • Revolutionizing Care.”
Visit booth #4159 at the AACR Annual Meeting 2024 to connect with members of the Agingteam.
About Aging-US:
Agingpublishes research papers in all fields of aging research including but not limited, aging from yeast to mammals, cellular senescence, age-related diseases such as cancer and Alzheimer’s diseases and their prevention and treatment, anti-aging strategies and drug development and especially the role of signal transduction pathways such as mTOR in aging and potential approaches to modulate these signaling pathways to extend lifespan. The journal aims to promote treatment of age-related diseases by slowing down aging, validation of anti-aging drugs by treating age-related diseases, prevention of cancer by inhibiting aging. Cancer and COVID-19 are age-related diseases.
Agingis indexed and archived byPubMed/Medline (abbreviated as “Aging (Albany NY)”), PubMed Central, Web of Science: Science Citation Index Expanded (abbreviated as “Aging‐US” and listed in the Cell Biology and Geriatrics & Gerontology categories), Scopus (abbreviated as “Aging” and listed in the Cell Biology and Aging categories), Biological Abstracts, BIOSIS Previews, EMBASE, META (Chan Zuckerberg Initiative) (2018-2022), and Dimensions (Digital Science).
Please visit our website at www.Aging-US.com and connect with us:
NY Fed Finds Medium, Long-Term Inflation Expectations Jump Amid Surge In Stock Market Optimism
One month after the inflation outlook tracked by the NY Fed Consumer Survey extended their late 2023 slide, with 3Y inflation expectations in January sliding to a record low 2.4% (from 2.6% in December), even as 1 and 5Y inflation forecasts remained flat, moments ago the NY Fed reported that in February there was a sharp rebound in longer-term inflation expectations, rising to 2.7% from 2.4% at the three-year ahead horizon, and jumping to 2.9% from 2.5% at the five-year ahead horizon, while the 1Y inflation outlook was flat for the 3rd month in a row, stuck at 3.0%.
The increases in both the three-year ahead and five-year ahead measures were most pronounced for respondents with at most high school degrees (in other words, the "really smart folks" are expecting deflation soon). The survey’s measure of disagreement across respondents (the difference between the 75th and 25th percentile of inflation expectations) decreased at all horizons, while the median inflation uncertainty—or the uncertainty expressed regarding future inflation outcomes—declined at the one- and three-year ahead horizons and remained unchanged at the five-year ahead horizon.
Going down the survey, we find that the median year-ahead expected price changes increased by 0.1 percentage point to 4.3% for gas; decreased by 1.8 percentage points to 6.8% for the cost of medical care (its lowest reading since September 2020); decreased by 0.1 percentage point to 5.8% for the cost of a college education; and surprisingly decreased by 0.3 percentage point for rent to 6.1% (its lowest reading since December 2020), and remained flat for food at 4.9%.
We find the rent expectations surprising because it is happening just asking rents are rising across the country.
At the same time as consumers erroneously saw sharply lower rents, median home price growth expectations remained unchanged for the fifth consecutive month at 3.0%.
Turning to the labor market, the survey found that the average perceived likelihood of voluntary and involuntary job separations increased, while the perceived likelihood of finding a job (in the event of a job loss) declined. "The mean probability of leaving one’s job voluntarily in the next 12 months also increased, by 1.8 percentage points to 19.5%."
Mean unemployment expectations - or the mean probability that the U.S. unemployment rate will be higher one year from now - decreased by 1.1 percentage points to 36.1%, the lowest reading since February 2022. Additionally, the median one-year-ahead expected earnings growth was unchanged at 2.8%, remaining slightly below its 12-month trailing average of 2.9%.
Turning to household finance, we find the following:
The median expected growth in household income remained unchanged at 3.1%. The series has been moving within a narrow range of 2.9% to 3.3% since January 2023, and remains above the February 2020 pre-pandemic level of 2.7%.
Median household spending growth expectations increased by 0.2 percentage point to 5.2%. The increase was driven by respondents with a high school degree or less.
Median year-ahead expected growth in government debt increased to 9.3% from 8.9%.
The mean perceived probability that the average interest rate on saving accounts will be higher in 12 months increased by 0.6 percentage point to 26.1%, remaining below its 12-month trailing average of 30%.
Perceptions about households’ current financial situations deteriorated somewhat with fewer respondents reporting being better off than a year ago. Year-ahead expectations also deteriorated marginally with a smaller share of respondents expecting to be better off and a slightly larger share of respondents expecting to be worse off a year from now.
The mean perceived probability that U.S. stock prices will be higher 12 months from now increased by 1.4 percentage point to 38.9%.
At the same time, perceptions and expectations about credit access turned less optimistic: "Perceptions of credit access compared to a year ago deteriorated with a larger share of respondents reporting tighter conditions and a smaller share reporting looser conditions compared to a year ago."
Also, a smaller percentage of consumers, 11.45% vs 12.14% in prior month, expect to not be able to make minimum debt payment over the next three months
Last, and perhaps most humorous, is the now traditional cognitive dissonance one observes with these polls, because at a time when long-term inflation expectations jumped, which clearly suggests that financial conditions will need to be tightened, the number of respondents expecting higher stock prices one year from today jumped to the highest since November 2021... which incidentally is just when the market topped out during the last cycle before suffering a painful bear market.
Homes listed for sale in early June sell for $7,700 more
New Zillow research suggests the spring home shopping season may see a second wave this summer if mortgage rates fall
The post Homes listed for sale in…
A Zillow analysis of 2023 home sales finds homes listed in the first two weeks of June sold for 2.3% more.
The best time to list a home for sale is a month later than it was in 2019, likely driven by mortgage rates.
The best time to list can be as early as the second half of February in San Francisco, and as late as the first half of July in New York and Philadelphia.
Spring home sellers looking to maximize their sale price may want to wait it out and list their home for sale in the first half of June. A new Zillow® analysis of 2023 sales found that homes listed in the first two weeks of June sold for 2.3% more, a $7,700 boost on a typical U.S. home.
The best time to list consistently had been early May in the years leading up to the pandemic. The shift to June suggests mortgage rates are strongly influencing demand on top of the usual seasonality that brings buyers to the market in the spring. This home-shopping season is poised to follow a similar pattern as that in 2023, with the potential for a second wave if the Federal Reserve lowers interest rates midyear or later.
The 2.3% sale price premium registered last June followed the first spring in more than 15 years with mortgage rates over 6% on a 30-year fixed-rate loan. The high rates put home buyers on the back foot, and as rates continued upward through May, they were still reassessing and less likely to bid boldly. In June, however, rates pulled back a little from 6.79% to 6.67%, which likely presented an opportunity for determined buyers heading into summer. More buyers understood their market position and could afford to transact, boosting competition and sale prices.
The old logic was that sellers could earn a premium by listing in late spring, when search activity hit its peak. Now, with persistently low inventory, mortgage rate fluctuations make their own seasonality. First-time home buyers who are on the edge of qualifying for a home loan may dip in and out of the market, depending on what’s happening with rates. It is almost certain the Federal Reserve will push back any interest-rate cuts to mid-2024 at the earliest. If mortgage rates follow, that could bring another surge of buyers later this year.
Mortgage rates have been impacting affordability and sale prices since they began rising rapidly two years ago. In 2022, sellers nationwide saw the highest sale premium when they listed their home in late March, right before rates barreled past 5% and continued climbing.
Zillow’s research finds the best time to list can vary widely by metropolitan area. In 2023, it was as early as the second half of February in San Francisco, and as late as the first half of July in New York. Thirty of the top 35 largest metro areas saw for-sale listings command the highest sale prices between May and early July last year.
Zillow also found a wide range in the sale price premiums associated with homes listed during those peak periods. At the hottest time of the year in San Jose, homes sold for 5.5% more, a $88,000 boost on a typical home. Meanwhile, homes in San Antonio sold for 1.9% more during that same time period.
We use cookies on our website to give you the most relevant experience by remembering your preferences and repeat visits. By clicking “Accept”, you consent to the use of ALL the cookies.
This website uses cookies to improve your experience while you navigate through the website. Out of these, the cookies that are categorized as necessary are stored on your browser as they are essential for the working of basic functionalities of the website. We also use third-party cookies that help us analyze and understand how you use this website. These cookies will be stored in your browser only with your consent. You also have the option to opt-out of these cookies. But opting out of some of these cookies may affect your browsing experience.
Necessary cookies are absolutely essential for the website to function properly. These cookies ensure basic functionalities and security features of the website, anonymously.
Cookie
Duration
Description
cookielawinfo-checbox-analytics
11 months
This cookie is set by GDPR Cookie Consent plugin. The cookie is used to store the user consent for the cookies in the category "Analytics".
cookielawinfo-checbox-functional
11 months
The cookie is set by GDPR cookie consent to record the user consent for the cookies in the category "Functional".
cookielawinfo-checbox-others
11 months
This cookie is set by GDPR Cookie Consent plugin. The cookie is used to store the user consent for the cookies in the category "Other.
cookielawinfo-checkbox-necessary
11 months
This cookie is set by GDPR Cookie Consent plugin. The cookies is used to store the user consent for the cookies in the category "Necessary".
cookielawinfo-checkbox-performance
11 months
This cookie is set by GDPR Cookie Consent plugin. The cookie is used to store the user consent for the cookies in the category "Performance".
viewed_cookie_policy
11 months
The cookie is set by the GDPR Cookie Consent plugin and is used to store whether or not user has consented to the use of cookies. It does not store any personal data.
Functional cookies help to perform certain functionalities like sharing the content of the website on social media platforms, collect feedbacks, and other third-party features.
Performance cookies are used to understand and analyze the key performance indexes of the website which helps in delivering a better user experience for the visitors.
Analytical cookies are used to understand how visitors interact with the website. These cookies help provide information on metrics the number of visitors, bounce rate, traffic source, etc.
Advertisement cookies are used to provide visitors with relevant ads and marketing campaigns. These cookies track visitors across websites and collect information to provide customized ads.


