The Playbook
Maverick is back and given the Top Gun sequel has raked in more than $800 million to date, it is already the biggest blockbuster of Tom Cruise’s career….
Share this:

Maverick is back and given the Top Gun sequel has raked in more than $800 million to date, it is already the biggest blockbuster of Tom Cruise’s career. A lot has changed since the original nearly four decades ago, but the secret to its success lies in what hasn’t changed — its “playbook.”
When one of the movie’s producers recently described how his team approached the script, he highlighted a conversation he had with Cruise shortly before the project started. The message was clear. Cruise said,
“This is a competition film. It’s about family, emotion, and the characters. We have to stay true to the original.”
While the Top Gun sequel employed modern technology and implemented a plot to fit the times, Cruise knew that its ultimate success (or lack thereof) would boil down to how well it followed the playbook that made the original so successful. The producers executed on that vision.
Top Gun’s playbook is simple — appeal to the nostalgia of those who saw the movie in the theaters in the mid-80’s. Remind them of the time they bought their first aviators after seeing Maverick wear them on the runway at Miramar, echoed the line “you can be my wingman anytime”, and rolled down their car windows, cranked up the volume, and driven a little faster when Kenny Loggins’ “Danger Zone” came on the radio.
The journalist Rich Eisen said it better on his show a couple weeks ago after seeing the movie,
“I cannot tell you how awesome this movie is. It was spectacular. It made me feel like I was back in high school again in 1986. It was great. Just terrific. It gives you everything you want, everything you are hoping for. You get the sunrise over the tarmac, Cruise on a motorcycle, Kenny Loggins singing Danger Zone, and the script is straight out of the original Top Gun. The flying scenes are incredible and Cruise looks the same. You have to see it in the theater. It is everything you’d want out of a sequel. I was just flying man, literally and figuratively.”
The key to Top Gun’s playbook is that it did not require the perfect backdrop, environment, or ideal release date to be successful. After all, it has generated nearly a billion dollars at the box office despite Covid-19 still making parts of the country hesitant to attend the movies. It just needed to stick to the durable themes from the original script, echo those emotions, and highlight the characters in the film that reminded the viewers of Goose, Slider, Charlie, and others. It has done just that.
Investing Playbooks
The same is true for the most effective investment playbooks. They are not constrained by or dependent on a certain time period, geography, sector, or interest rate environment. Instead, they are effective across a wide variety of situations and circumstances.
Few in the investment world have implemented a better playbook than David Swensen. When Swensen took over Yale’s endowment in 1986, coincidentally just months before the original Top Gun was released, he believed the university could generate stronger returns with similar (or even less) risk by taking advantage of the “illiquidity premium” that existed in the private markets. As a result, over the next three decades he and his team transformed Yale’s endowment from one invested 100% in liquid securities to one that is nearly 70% illiquid today. It was such a novel concept that it even received a new moniker - “The Yale Model.”
Yet, while Yale’s “liquidity trade off” has been an integral part of the endowment’s strong performance, Swensen still did not consider it the “secret” to Yale’s success. If not, what has been?
People.
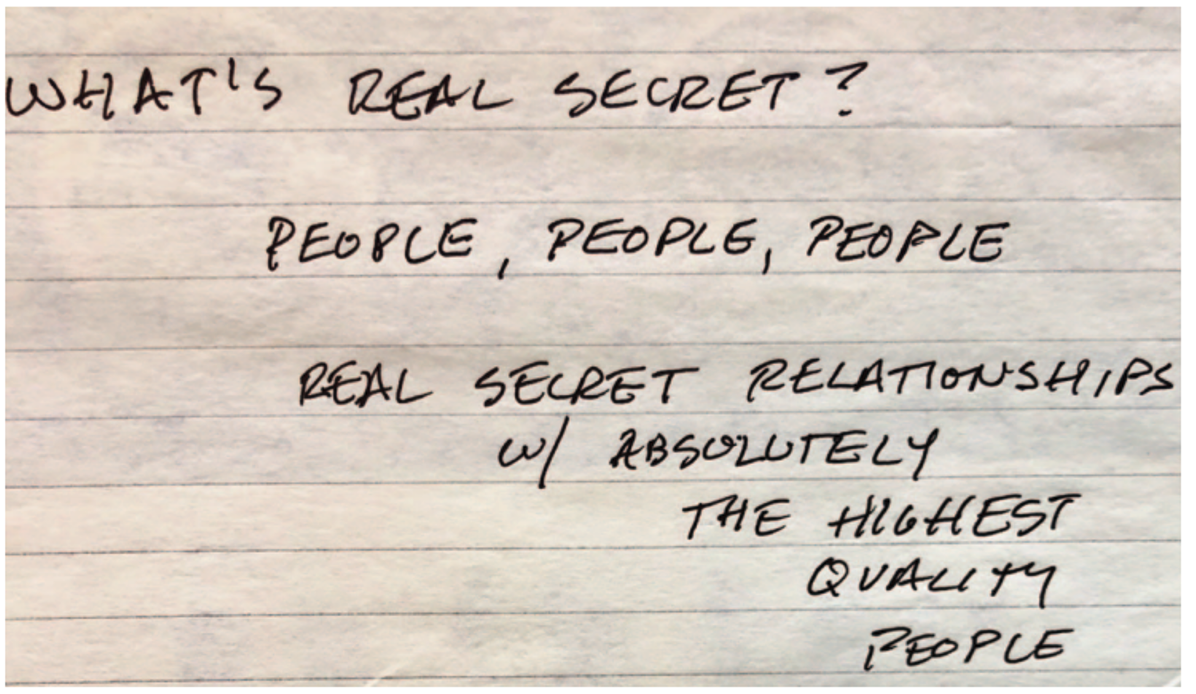
Sadly, Swensen passed away almost one year ago after a long battle with cancer. In a tribute to his life and career at Yale, the university dedicated its 2021 annual report exclusively to him. The report included a photo of an index card that Swensen had written on some years earlier as a reminder. It read,
Despite all of Yale’s sophisticated asset allocation decisions, quantitative investment analysis, and calculated portfolio adjustments, Swensen still defined Yale’s real secret as “People, People, People.” This applied not only to the people he invested with, but also to the people on his team, the students he taught, and the countless external charitable organizations he worked with (including my current employer). As Yale President Rick Levin said in the tribute, “The ‘Yale Model’s’ success for more than three decades was a function not just of analytical rigor, but also Swensen’s extraordinary judgment of people.”
The results speak for themselves. According to the annual report,
“When Swensen assumed management of the endowment in 1985, it stood at $1.3 billion. During his 36-year term as chief investment officer, his stewardship led to $57.6 billion of investment gains for Yale and more than $21.8 billion of spending to support Yale’s operations.”
This equates to an annualized gain of 13.7%, outperforming the average endowment (as measured by Cambridge Associates) by 3.4%. Without accounting for spending, $1 invested at the beginning of his tenure would have grown to nearly $103 by the end. By comparison, a dollar invested in the S&P 500 would be worth slightly more than $50.
Sounds like an effective playbook.
New Playbooks
Over the years, countless investors have attempted to copy Swensen’s playbook. In fact, the Yale Model has become synonymous with managing large pools of capital. Yet, the real indication of David Swensen’s legacy is the fact that today there are at least fourteen current CIOs at major institutions who worked for him.
One “alum” that has done an especially good job has been Seth Alexander at The Massachusetts Institute of Technology (“MIT”). Since joining MIT, Alexander has adopted a number or Swensen’s core principles, but has also created his own playbook by incorporating a number of his own unique principles. Namely, he and his team dedicate less attention to the traditional asset class silos (i.e., equities, fixed income, private equity, venture, etc.) and more on identifying managers that they believe will outperform regardless of what market, sector, or geography they operate in. Additionally, Alexander has flattened his team structure and broken down internal silos by making everyone a generalist.
This has manifested itself in Alexander’s decision to “favor duration over evidence”. This means that instead of focusing too heavily on an investor’s long-term track record, the team at MIT prioritizes identifying high quality people and investment teams well before they have appeared on others’ radars. He described the rationale recently on a “Going Long” podcast,
“We’ve come to a point where we err on the side of less evidence and more duration because the power of duration and long relationships is so powerful. If we can invest a piece of our endowment in a manager that’s relationship with us will last decades, that is a piece of the portfolio we don’t have to invest in every year (or five years). This then enables us to turn our attention to other parts of the portfolio. The more capital we can get into these parts of the portfolio that are working well, the more focus we can give to the rest of the portfolio and the higher quality decisions we can make because our attention is more focused. In a world that is often frenetic, the value of being able to only have to move a little bit of our capital each year is extraordinary.”
Finding a manager that’s “relationship with MIT will last decades” is another way of saying finding a manager that “Alexander and his team can trust implicitly”. Doing so then frees up more time for them to find additional people he can trust, invest more capital in them, and dedicate more time to making higher quality decisions.
The results speak for themselves as MIT has consistently posted some of the strongest returns among the endowment and foundation community (+11.7% for 15 years, +14.5% for 10 years, and +18.9% for 5 years).
People
I unfortunately never had the opportunity to meet David Swensen. Yet, I believe the reason why he wrote down the word “People” three times on that index card is because the most effective way to invest through both strong and difficult markets is to partner with high quality people. More importantly, high quality people who work well together as a team. Look no further than the article titled “All Stars: Is a great team more than the sum of its players? Complexity science reveals the role of strategy, synergy, swarming, and more.”
The authors, Jessica Flack of the Sante Fe Institute and Cade Massey of the Wharton School, highlight how the some of the greatest performance throughout history, be it The Manhattan Project, the Michael Jordan-era Chicago Bulls, or a chorus of frogs singing at night, are not due to each having the best individual scientist, basketball player, or amphibian. Rather, they are due to their synergistic interactions. “To how well strategies and individual attributes combine to produce team performance, individuals coordinate in space and time, and what roles leadership and larger organizational environments play in bringing out their best.”
Said another way, superior performance most often results comes from colleagues, teammates, and partners who make each other better. It’s why Robert Oppenheimer was only able to complete the most significant large-scale science project in history with the help of Leo Szilard and Leslie Groves, why Michael Jordan didn’t win an NBA title until players like Scottie Pippen and Steve Kerr showed up, and why a single frog singing in a field isn’t heard by a soul.
I write about this topic a lot because I find that nothing else in investing, or life for that matter, is more important. If you invest, partner, or work with people whom you trust and who compliment your skill set, it creates powerful synergies. From an investment perspective, as Seth Alexander highlighted, doing so enables you to comfortably commit capital that doesn’t need to be over analyzed, monitored, or scrutinized. This subsequently frees up more time to focus your attention and time on other things.
In a period like the one we are currently living through, one defined by increasing uncertainty, declining confidence, and an unclear road ahead, sticking to a proven playbook focused on high quality people is as important as ever.
sp 500 equities covid-19Uncategorized
Q4 Update: Delinquencies, Foreclosures and REO
Today, in the Calculated Risk Real Estate Newsletter: Q4 Update: Delinquencies, Foreclosures and REO
A brief excerpt: I’ve argued repeatedly that we would NOT see a surge in foreclosures that would significantly impact house prices (as happened followi…
Share this:


A brief excerpt:
I’ve argued repeatedly that we would NOT see a surge in foreclosures that would significantly impact house prices (as happened following the housing bubble). The two key reasons are mortgage lending has been solid, and most homeowners have substantial equity in their homes..There is much more in the article. You can subscribe at https://calculatedrisk.substack.com/ mortgage rates real estate mortgages pandemic interest rates
...
And on mortgage rates, here is some data from the FHFA’s National Mortgage Database showing the distribution of interest rates on closed-end, fixed-rate 1-4 family mortgages outstanding at the end of each quarter since Q1 2013 through Q3 2023 (Q4 2023 data will be released in a two weeks).
This shows the surge in the percent of loans under 3%, and also under 4%, starting in early 2020 as mortgage rates declined sharply during the pandemic. Currently 22.6% of loans are under 3%, 59.4% are under 4%, and 78.7% are under 5%.
With substantial equity, and low mortgage rates (mostly at a fixed rates), few homeowners will have financial difficulties.
Uncategorized
‘Bougie Broke’ – The Financial Reality Behind The Facade
‘Bougie Broke’ – The Financial Reality Behind The Facade
Authored by Michael Lebowitz via RealInvestmentAdvice.com,
Social media users claiming…
Share this:


Authored by Michael Lebowitz via RealInvestmentAdvice.com,
Social media users claiming to be Bougie Broke share pictures of their fancy cars, high-fashion clothing, and selfies in exotic locations and expensive restaurants. Yet they complain about living paycheck to paycheck and lacking the means to support their lifestyle.
Bougie broke is like “keeping up with the Joneses,” spending beyond one’s means to impress others.
Bougie Broke gives us a glimpse into the financial condition of a growing number of consumers. Since personal consumption represents about two-thirds of economic activity, it’s worth diving into the Bougie Broke fad to appreciate if a large subset of the population can continue to consume at current rates.
The Wealth Divide Disclaimer
Forecasting personal consumption is always tricky, but it has become even more challenging in the post-pandemic era. To appreciate why we share a joke told by Mike Green.
Bill Gates and I walk into the bar…
Bartender: “Wow… a couple of billionaires on average!”
Bill Gates, Jeff Bezos, Elon Musk, Mark Zuckerberg, and other billionaires make us all much richer, on average. Unfortunately, we can’t use the average to pay our bills.
According to Wikipedia, Bill Gates is one of 756 billionaires living in the United States. Many of these billionaires became much wealthier due to the pandemic as their investment fortunes proliferated.
To appreciate the wealth divide, consider the graph below courtesy of Statista. 1% of the U.S. population holds 30% of the wealth. The wealthiest 10% of households have two-thirds of the wealth. The bottom half of the population accounts for less than 3% of the wealth.
The uber-wealthy grossly distorts consumption and savings data. And, with the sharp increase in their wealth over the past few years, the consumption and savings data are more distorted.
Furthermore, and critical to appreciate, the spending by the wealthy doesn’t fluctuate with the economy. Therefore, the spending of the lower wealth classes drives marginal changes in consumption. As such, the condition of the not-so-wealthy is most important for forecasting changes in consumption.
Revenge Spending
Deciphering personal data has also become more difficult because our spending habits have changed due to the pandemic.
A great example is revenge spending. Per the New York Times:
Ola Majekodunmi, the founder of All Things Money, a finance site for young adults, explained revenge spending as expenditures meant to make up for “lost time” after an event like the pandemic.
So, between the growing wealth divide and irregular spending habits, let’s quantify personal savings, debt usage, and real wages to appreciate better if Bougie Broke is a mass movement or a silly meme.
The Means To Consume
Savings, debt, and wages are the three primary sources that give consumers the ability to consume.
Savings
The graph below shows the rollercoaster on which personal savings have been since the pandemic. The savings rate is hovering at the lowest rate since those seen before the 2008 recession. The total amount of personal savings is back to 2017 levels. But, on an inflation-adjusted basis, it’s at 10-year lows. On average, most consumers are drawing down their savings or less. Given that wages are increasing and unemployment is historically low, they must be consuming more.
Now, strip out the savings of the uber-wealthy, and it’s probable that the amount of personal savings for much of the population is negligible. A survey by Payroll.org estimates that 78% of Americans live paycheck to paycheck.

More on Insufficient Savings
The Fed’s latest, albeit old, Report on the Economic Well-Being of U.S. Households from June 2023 claims that over a third of households do not have enough savings to cover an unexpected $400 expense. We venture to guess that number has grown since then. To wit, the number of households with essentially no savings rose 5% from their prior report a year earlier.
Relatively small, unexpected expenses, such as a car repair or a modest medical bill, can be a hardship for many families. When faced with a hypothetical expense of $400, 63 percent of all adults in 2022 said they would have covered it exclusively using cash, savings, or a credit card paid off at the next statement (referred to, altogether, as “cash or its equivalent”). The remainder said they would have paid by borrowing or selling something or said they would not have been able to cover the expense.
Debt
After periods where consumers drained their existing savings and/or devoted less of their paychecks to savings, they either slowed their consumption patterns or borrowed to keep them up. Currently, it seems like many are choosing the latter option. Consumer borrowing is accelerating at a quicker pace than it was before the pandemic.
The first graph below shows outstanding credit card debt fell during the pandemic as the economy cratered. However, after multiple stimulus checks and broad-based economic recovery, consumer confidence rose, and with it, credit card balances surged.
The current trend is steeper than the pre-pandemic trend. Some may be a catch-up, but the current rate is unsustainable. Consequently, borrowing will likely slow down to its pre-pandemic trend or even below it as consumers deal with higher credit card balances and 20+% interest rates on the debt.

The second graph shows that since 2022, credit card balances have grown faster than our incomes. Like the first graph, the credit usage versus income trend is unsustainable, especially with current interest rates.

With many consumers maxing out their credit cards, is it any wonder buy-now-pay-later loans (BNPL) are increasing rapidly?
Insider Intelligence believes that 79 million Americans, or a quarter of those over 18 years old, use BNPL. Lending Tree claims that “nearly 1 in 3 consumers (31%) say they’re at least considering using a buy now, pay later (BNPL) loan this month.”More telling, according to their survey, only 52% of those asked are confident they can pay off their BNPL loan without missing a payment!
Wage Growth
Wages have been growing above trend since the pandemic. Since 2022, the average annual growth in compensation has been 6.28%. Higher incomes support more consumption, but higher prices reduce the amount of goods or services one can buy. Over the same period, real compensation has grown by less than half a percent annually. The average real compensation growth was 2.30% during the three years before the pandemic.
In other words, compensation is just keeping up with inflation instead of outpacing it and providing consumers with the ability to consume, save, or pay down debt.
It’s All About Employment
The unemployment rate is 3.9%, up slightly from recent lows but still among the lowest rates in the last seventy-five years.

The uptick in credit card usage, decline in savings, and the savings rate argue that consumers are slowly running out of room to keep consuming at their current pace.
However, the most significant means by which we consume is income. If the unemployment rate stays low, consumption may moderate. But, if the recent uptick in unemployment continues, a recession is extremely likely, as we have seen every time it turned higher.
It’s not just those losing jobs that consume less. Of greater impact is a loss of confidence by those employed when they see friends or neighbors being laid off.
Accordingly, the labor market is probably the most important leading indicator of consumption and of the ability of the Bougie Broke to continue to be Bougie instead of flat-out broke!
Summary
There are always consumers living above their means. This is often harmless until their means decline or disappear. The Bougie Broke meme and the ability social media gives consumers to flaunt their “wealth” is a new medium for an age-old message.
Diving into the data, it argues that consumption will likely slow in the coming months. Such would allow some consumers to save and whittle down their debt. That situation would be healthy and unlikely to cause a recession.
The potential for the unemployment rate to continue higher is of much greater concern. The combination of a higher unemployment rate and strapped consumers could accentuate a recession.
Government
Congress’ failure so far to deliver on promise of tens of billions in new research spending threatens America’s long-term economic competitiveness
A deal that avoided a shutdown also slashed spending for the National Science Foundation, putting it billions below a congressional target intended to…
Share this:


Federal spending on fundamental scientific research is pivotal to America’s long-term economic competitiveness and growth. But less than two years after agreeing the U.S. needed to invest tens of billions of dollars more in basic research than it had been, Congress is already seriously scaling back its plans.
A package of funding bills recently passed by Congress and signed by President Joe Biden on March 9, 2024, cuts the current fiscal year budget for the National Science Foundation, America’s premier basic science research agency, by over 8% relative to last year. That puts the NSF’s current allocation US$6.6 billion below targets Congress set in 2022.
And the president’s budget blueprint for the next fiscal year, released on March 11, doesn’t look much better. Even assuming his request for the NSF is fully funded, it would still, based on my calculations, leave the agency a total of $15 billion behind the plan Congress laid out to help the U.S. keep up with countries such as China that are rapidly increasing their science budgets.
I am a sociologist who studies how research universities contribute to the public good. I’m also the executive director of the Institute for Research on Innovation and Science, a national university consortium whose members share data that helps us understand, explain and work to amplify those benefits.
Our data shows how underfunding basic research, especially in high-priority areas, poses a real threat to the United States’ role as a leader in critical technology areas, forestalls innovation and makes it harder to recruit the skilled workers that high-tech companies need to succeed.
A promised investment
Less than two years ago, in August 2022, university researchers like me had reason to celebrate.
Congress had just passed the bipartisan CHIPS and Science Act. The science part of the law promised one of the biggest federal investments in the National Science Foundation in its 74-year history.
The CHIPS act authorized US$81 billion for the agency, promised to double its budget by 2027 and directed it to “address societal, national, and geostrategic challenges for the benefit of all Americans” by investing in research.
But there was one very big snag. The money still has to be appropriated by Congress every year. Lawmakers haven’t been good at doing that recently. As lawmakers struggle to keep the lights on, fundamental research is quickly becoming a casualty of political dysfunction.
Research’s critical impact
That’s bad because fundamental research matters in more ways than you might expect.
For instance, the basic discoveries that made the COVID-19 vaccine possible stretch back to the early 1960s. Such research investments contribute to the health, wealth and well-being of society, support jobs and regional economies and are vital to the U.S. economy and national security.
Lagging research investment will hurt U.S. leadership in critical technologies such as artificial intelligence, advanced communications, clean energy and biotechnology. Less support means less new research work gets done, fewer new researchers are trained and important new discoveries are made elsewhere.
But disrupting federal research funding also directly affects people’s jobs, lives and the economy.
Businesses nationwide thrive by selling the goods and services – everything from pipettes and biological specimens to notebooks and plane tickets – that are necessary for research. Those vendors include high-tech startups, manufacturers, contractors and even Main Street businesses like your local hardware store. They employ your neighbors and friends and contribute to the economic health of your hometown and the nation.
Nearly a third of the $10 billion in federal research funds that 26 of the universities in our consortium used in 2022 directly supported U.S. employers, including:
A Detroit welding shop that sells gases many labs use in experiments funded by the National Institutes of Health, National Science Foundation, Department of Defense and Department of Energy.
A Dallas-based construction company that is building an advanced vaccine and drug development facility paid for by the Department of Health and Human Services.
More than a dozen Utah businesses, including surveyors, engineers and construction and trucking companies, working on a Department of Energy project to develop breakthroughs in geothermal energy.
When Congress shortchanges basic research, it also damages businesses like these and people you might not usually associate with academic science and engineering. Construction and manufacturing companies earn more than $2 billion each year from federally funded research done by our consortium’s members.

Jobs and innovation
Disrupting or decreasing research funding also slows the flow of STEM – science, technology, engineering and math – talent from universities to American businesses. Highly trained people are essential to corporate innovation and to U.S. leadership in key fields, such as AI, where companies depend on hiring to secure research expertise.
In 2022, federal research grants paid wages for about 122,500 people at universities that shared data with my institute. More than half of them were students or trainees. Our data shows that they go on to many types of jobs but are particularly important for leading tech companies such as Google, Amazon, Apple, Facebook and Intel.
That same data lets me estimate that over 300,000 people who worked at U.S. universities in 2022 were paid by federal research funds. Threats to federal research investments put academic jobs at risk. They also hurt private sector innovation because even the most successful companies need to hire people with expert research skills. Most people learn those skills by working on university research projects, and most of those projects are federally funded.
High stakes
If Congress doesn’t move to fund fundamental science research to meet CHIPS and Science Act targets – and make up for the $11.6 billion it’s already behind schedule – the long-term consequences for American competitiveness could be serious.
Over time, companies would see fewer skilled job candidates, and academic and corporate researchers would produce fewer discoveries. Fewer high-tech startups would mean slower economic growth. America would become less competitive in the age of AI. This would turn one of the fears that led lawmakers to pass the CHIPS and Science Act into a reality.
Ultimately, it’s up to lawmakers to decide whether to fulfill their promise to invest more in the research that supports jobs across the economy and in American innovation, competitiveness and economic growth. So far, that promise is looking pretty fragile.
This is an updated version of an article originally published on Jan. 16, 2024.
Jason Owen-Smith receives research support from the National Science Foundation, the National Institutes of Health, the Alfred P. Sloan Foundation and Wellcome Leap.
economic growth covid-19 grants congress vaccine china

IFM’s Hat Trick and Reflections On Option-To-Buy M&A


Four Years Ago This Week, Freedom Was Torched


Red Candle In The Wind


Digital Currency And Gold As Speculative Warnings


Analyst reviews Apple stock price target amid challenges


CDC Warns Thousands Of Children Sent To ER After Taking Common Sleep Aid


Economic Trends, Risks and the Industrial Market


Trump “Clearly Hasn’t Learned From His COVID-Era Mistakes”, RFK Jr. Says


The next pandemic? It’s already here for Earth’s wildlife


Chronic stress and inflammation linked to societal and environmental impacts in new study
-

 Uncategorized3 weeks ago
All Of The Elements Are In Place For An Economic Crisis Of Staggering Proportions
-

 International5 days ago
EyePoint poaches medical chief from Apellis; Sandoz CFO, longtime BioNTech exec to retire
-

 Uncategorized4 weeks ago
California Counties Could Be Forced To Pay $300 Million To Cover COVID-Era Program
-

 Uncategorized3 weeks ago
Apparel Retailer Express Moving Toward Bankruptcy
-

 Uncategorized4 weeks ago
Industrial Production Decreased 0.1% in January
-

 International5 days ago
Walmart launches clever answer to Target’s new membership program
-

 Uncategorized4 weeks ago
RFK Jr: The Wuhan Cover-Up & The Rise Of The Biowarfare-Industrial Complex
-

 Uncategorized3 weeks ago
GOP Efforts To Shore Up Election Security In Swing States Face Challenges