After 12 years of a liquidity-fueled, Fed-induced bull market, are the markets set to start another "secular" bear market? In an interview with the Financial…
After 12 years of a liquidity-fueled, Fed-induced bull market, are the markets set to start another “secular” bear market? In an interview with the Financial Times, Boaz Weinstein, founder of Saba Capital Management, suggested such.
“There isn’t a rainbow at the end of all this. There’s no reason that this difficult economic period will only last two to three quarters and no reason to think we’ll have a soft landing or a shallow recession.”
Before you dismiss his opinion as hyperbole, Saba Capital was one of the world’s top-performing hedge funds in 2020 and is up by almost a third in 2022.
Before we go further with our analysis, we must distinguish between a cyclical and secular market cycle.
“A secular market trend is a long-term trend which lasts 5 to 25 years and consists of a series of primary trends. A secular bear market consists of smaller bull markets and larger bear markets; a secular bull market consists of larger bull markets and smaller bear markets.”
The prevailing trend in a “secular bull” market is “bullish” or upward-moving. In a “secular bear,” the market tends to trend sideways with severe drawdowns and sharp rallies.
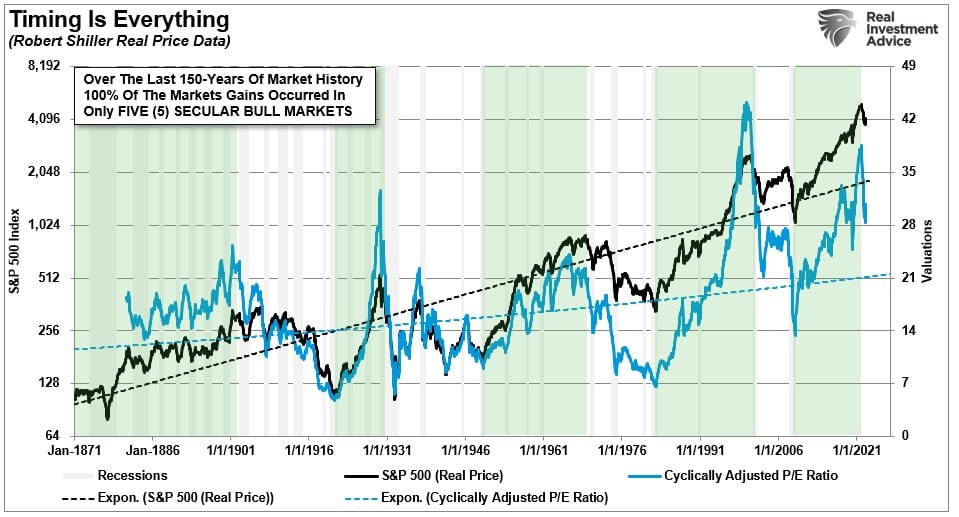
The chart below shows the market from 1871 to the present, with secular bull market cycles highlighted.
Notably, as an investor, only 5-periods are secular bull markets (where prices are increasing) over the last 150 years. Those five periods account for 100% of all the index gains. In other words, the outcome was disappointing if you invested on a buy-and-hold basis during any other period.
Valuations & Earnings
Three items drive secular bull markets: 1) valuation expansion, 2) earnings growth, and 3) falling interest rates. The most prominent driver of secular returns are periods of valuation expansion and contractions.
The chart above shows the history of secular market periods going back to 1871 using data from Dr. Robert Shiller. You will notice that secular bull markets begin with CAPE valuations around 10x earnings or even less. Secular bear markets tend to start with valuations of 23-25x earnings or greater. (Over the long-term, valuations do matter.) Most notably, secular BEAR market periods are defined by near-zero returns during the valuation contraction process.
It is imperative to remember valuations are very predictive of long-term returns from the investment process. However, they are horrible timing indicators. Because valuations, and fundamentals in general, take a long-time to play out in the markets, it is not surprising investors dismiss them during a secular bull market.
As noted, what drives long-term secular “bear” markets is “valuation contraction.” Such is driven by investor re-evaluation of earning power by companies due to changes in interest rates, inflation, and, most importantly, prospects for economic growth. Unfortunately, forward prospects for more robust economic growth remain challenging due to high debt levels, which is a deflationary headwind.
The problem of overvaluation in a slow-growth economic environment is problematic. The massive surge in earnings during the pandemic-driven shutdown is unsustainable as the economy normalizes. Massive stimulus programs, combined with enormous unemployment, led to surging profits that are not replicable in the future. As shown, earnings are one of the most mean-reverting data series in existence, and ultimately if earnings don’t revert, capitalism is no longer functioning correctly.
The most obvious indication that a secular bear market may be upon us is the deviation of earnings from their underlying growth trend. Earnings can not, over the long term, outgrow the economy. Such is because it is economic activity that creates corporate revenues. The eventual reversion in economic growth and corporate earnings suggests that asset prices are vulnerable to a much more significant repricing to reflect future economic realities.
Don’t Be Afraid. Just Be Aware Of The Bear
As stated above, the stock market reflects the underlying economic activity over the long term. Personal consumption makes up roughly 70% of that activity. The consumer is more heavily leveraged than ever, making it doubtful they can become a significantly larger chunk of the economy. With savings low, income growth lagging inflation, and debt back at record levels, the fundamental capacity to re-leverage to similar extremes is no longer available.
Let’s also not forget the singular most important fact.
Following the two previous bear markets, the breakout of the markets in 2013was NOT one based on organic economic fundamentals. Instead, it was from massive monetary interventions by Central Banks globally. All previous secular bull markets were afunction of extreme under-valuations, washed-out financial markets, and falling interest rates.
Such is not the case currently.
Hopefully, I am wrong, and the secular bull market that began in 2013 has years of life left in it. However, given high debt levels, a rise in socialistic policies, and the shift from capitalism to corporatism, there is a risk of a reversion.
Such doesn’t mean you can’t make money in a secular bear market. You can, as there will be fantastic rallies. However, those rallies will likely get repeatedly met with disappointing declines. Such means that market returns will probably be exceptionally low on a “buy and hold” basis. However, investors with a bit of skill, a little luck, and a lot of work can likely continue to build wealth as the market reprices to a slow economic growth environment.
One thing is sure. Until Central Banks revert to all-out monetary accommodation, investors will face a challenging investment environment as valuation contraction continues to drive future returns.
BUFFALO, NY- March 11, 2024 – Impact Journals publishes scholarly journals in the biomedical sciences with a focus on all areas of cancer and aging research. Aging is one of the most prominent journals published by Impact Journals.
Credit: Impact Journals
BUFFALO, NY- March 11, 2024 – Impact Journals publishes scholarly journals in the biomedical sciences with a focus on all areas of cancer and aging research. Aging is one of the most prominent journals published by Impact Journals.
Impact Journals will be participating as an exhibitor at the American Association for Cancer Research (AACR) Annual Meeting 2024 from April 5-10 at the San Diego Convention Center in San Diego, California. This year, the AACR meeting theme is “Inspiring Science • Fueling Progress • Revolutionizing Care.”
Visit booth #4159 at the AACR Annual Meeting 2024 to connect with members of the Agingteam.
About Aging-US:
Agingpublishes research papers in all fields of aging research including but not limited, aging from yeast to mammals, cellular senescence, age-related diseases such as cancer and Alzheimer’s diseases and their prevention and treatment, anti-aging strategies and drug development and especially the role of signal transduction pathways such as mTOR in aging and potential approaches to modulate these signaling pathways to extend lifespan. The journal aims to promote treatment of age-related diseases by slowing down aging, validation of anti-aging drugs by treating age-related diseases, prevention of cancer by inhibiting aging. Cancer and COVID-19 are age-related diseases.
Agingis indexed and archived byPubMed/Medline (abbreviated as “Aging (Albany NY)”), PubMed Central, Web of Science: Science Citation Index Expanded (abbreviated as “Aging‐US” and listed in the Cell Biology and Geriatrics & Gerontology categories), Scopus (abbreviated as “Aging” and listed in the Cell Biology and Aging categories), Biological Abstracts, BIOSIS Previews, EMBASE, META (Chan Zuckerberg Initiative) (2018-2022), and Dimensions (Digital Science).
Please visit our website at www.Aging-US.com and connect with us:
NY Fed Finds Medium, Long-Term Inflation Expectations Jump Amid Surge In Stock Market Optimism
One month after the inflation outlook tracked by the NY Fed Consumer Survey extended their late 2023 slide, with 3Y inflation expectations in January sliding to a record low 2.4% (from 2.6% in December), even as 1 and 5Y inflation forecasts remained flat, moments ago the NY Fed reported that in February there was a sharp rebound in longer-term inflation expectations, rising to 2.7% from 2.4% at the three-year ahead horizon, and jumping to 2.9% from 2.5% at the five-year ahead horizon, while the 1Y inflation outlook was flat for the 3rd month in a row, stuck at 3.0%.
The increases in both the three-year ahead and five-year ahead measures were most pronounced for respondents with at most high school degrees (in other words, the "really smart folks" are expecting deflation soon). The survey’s measure of disagreement across respondents (the difference between the 75th and 25th percentile of inflation expectations) decreased at all horizons, while the median inflation uncertainty—or the uncertainty expressed regarding future inflation outcomes—declined at the one- and three-year ahead horizons and remained unchanged at the five-year ahead horizon.
Going down the survey, we find that the median year-ahead expected price changes increased by 0.1 percentage point to 4.3% for gas; decreased by 1.8 percentage points to 6.8% for the cost of medical care (its lowest reading since September 2020); decreased by 0.1 percentage point to 5.8% for the cost of a college education; and surprisingly decreased by 0.3 percentage point for rent to 6.1% (its lowest reading since December 2020), and remained flat for food at 4.9%.
We find the rent expectations surprising because it is happening just asking rents are rising across the country.
At the same time as consumers erroneously saw sharply lower rents, median home price growth expectations remained unchanged for the fifth consecutive month at 3.0%.
Turning to the labor market, the survey found that the average perceived likelihood of voluntary and involuntary job separations increased, while the perceived likelihood of finding a job (in the event of a job loss) declined. "The mean probability of leaving one’s job voluntarily in the next 12 months also increased, by 1.8 percentage points to 19.5%."
Mean unemployment expectations - or the mean probability that the U.S. unemployment rate will be higher one year from now - decreased by 1.1 percentage points to 36.1%, the lowest reading since February 2022. Additionally, the median one-year-ahead expected earnings growth was unchanged at 2.8%, remaining slightly below its 12-month trailing average of 2.9%.
Turning to household finance, we find the following:
The median expected growth in household income remained unchanged at 3.1%. The series has been moving within a narrow range of 2.9% to 3.3% since January 2023, and remains above the February 2020 pre-pandemic level of 2.7%.
Median household spending growth expectations increased by 0.2 percentage point to 5.2%. The increase was driven by respondents with a high school degree or less.
Median year-ahead expected growth in government debt increased to 9.3% from 8.9%.
The mean perceived probability that the average interest rate on saving accounts will be higher in 12 months increased by 0.6 percentage point to 26.1%, remaining below its 12-month trailing average of 30%.
Perceptions about households’ current financial situations deteriorated somewhat with fewer respondents reporting being better off than a year ago. Year-ahead expectations also deteriorated marginally with a smaller share of respondents expecting to be better off and a slightly larger share of respondents expecting to be worse off a year from now.
The mean perceived probability that U.S. stock prices will be higher 12 months from now increased by 1.4 percentage point to 38.9%.
At the same time, perceptions and expectations about credit access turned less optimistic: "Perceptions of credit access compared to a year ago deteriorated with a larger share of respondents reporting tighter conditions and a smaller share reporting looser conditions compared to a year ago."
Also, a smaller percentage of consumers, 11.45% vs 12.14% in prior month, expect to not be able to make minimum debt payment over the next three months
Last, and perhaps most humorous, is the now traditional cognitive dissonance one observes with these polls, because at a time when long-term inflation expectations jumped, which clearly suggests that financial conditions will need to be tightened, the number of respondents expecting higher stock prices one year from today jumped to the highest since November 2021... which incidentally is just when the market topped out during the last cycle before suffering a painful bear market.
Homes listed for sale in early June sell for $7,700 more
New Zillow research suggests the spring home shopping season may see a second wave this summer if mortgage rates fall
The post Homes listed for sale in…
A Zillow analysis of 2023 home sales finds homes listed in the first two weeks of June sold for 2.3% more.
The best time to list a home for sale is a month later than it was in 2019, likely driven by mortgage rates.
The best time to list can be as early as the second half of February in San Francisco, and as late as the first half of July in New York and Philadelphia.
Spring home sellers looking to maximize their sale price may want to wait it out and list their home for sale in the first half of June. A new Zillow® analysis of 2023 sales found that homes listed in the first two weeks of June sold for 2.3% more, a $7,700 boost on a typical U.S. home.
The best time to list consistently had been early May in the years leading up to the pandemic. The shift to June suggests mortgage rates are strongly influencing demand on top of the usual seasonality that brings buyers to the market in the spring. This home-shopping season is poised to follow a similar pattern as that in 2023, with the potential for a second wave if the Federal Reserve lowers interest rates midyear or later.
The 2.3% sale price premium registered last June followed the first spring in more than 15 years with mortgage rates over 6% on a 30-year fixed-rate loan. The high rates put home buyers on the back foot, and as rates continued upward through May, they were still reassessing and less likely to bid boldly. In June, however, rates pulled back a little from 6.79% to 6.67%, which likely presented an opportunity for determined buyers heading into summer. More buyers understood their market position and could afford to transact, boosting competition and sale prices.
The old logic was that sellers could earn a premium by listing in late spring, when search activity hit its peak. Now, with persistently low inventory, mortgage rate fluctuations make their own seasonality. First-time home buyers who are on the edge of qualifying for a home loan may dip in and out of the market, depending on what’s happening with rates. It is almost certain the Federal Reserve will push back any interest-rate cuts to mid-2024 at the earliest. If mortgage rates follow, that could bring another surge of buyers later this year.
Mortgage rates have been impacting affordability and sale prices since they began rising rapidly two years ago. In 2022, sellers nationwide saw the highest sale premium when they listed their home in late March, right before rates barreled past 5% and continued climbing.
Zillow’s research finds the best time to list can vary widely by metropolitan area. In 2023, it was as early as the second half of February in San Francisco, and as late as the first half of July in New York. Thirty of the top 35 largest metro areas saw for-sale listings command the highest sale prices between May and early July last year.
Zillow also found a wide range in the sale price premiums associated with homes listed during those peak periods. At the hottest time of the year in San Jose, homes sold for 5.5% more, a $88,000 boost on a typical home. Meanwhile, homes in San Antonio sold for 1.9% more during that same time period.
We use cookies on our website to give you the most relevant experience by remembering your preferences and repeat visits. By clicking “Accept”, you consent to the use of ALL the cookies.
This website uses cookies to improve your experience while you navigate through the website. Out of these, the cookies that are categorized as necessary are stored on your browser as they are essential for the working of basic functionalities of the website. We also use third-party cookies that help us analyze and understand how you use this website. These cookies will be stored in your browser only with your consent. You also have the option to opt-out of these cookies. But opting out of some of these cookies may affect your browsing experience.
Necessary cookies are absolutely essential for the website to function properly. These cookies ensure basic functionalities and security features of the website, anonymously.
Cookie
Duration
Description
cookielawinfo-checbox-analytics
11 months
This cookie is set by GDPR Cookie Consent plugin. The cookie is used to store the user consent for the cookies in the category "Analytics".
cookielawinfo-checbox-functional
11 months
The cookie is set by GDPR cookie consent to record the user consent for the cookies in the category "Functional".
cookielawinfo-checbox-others
11 months
This cookie is set by GDPR Cookie Consent plugin. The cookie is used to store the user consent for the cookies in the category "Other.
cookielawinfo-checkbox-necessary
11 months
This cookie is set by GDPR Cookie Consent plugin. The cookies is used to store the user consent for the cookies in the category "Necessary".
cookielawinfo-checkbox-performance
11 months
This cookie is set by GDPR Cookie Consent plugin. The cookie is used to store the user consent for the cookies in the category "Performance".
viewed_cookie_policy
11 months
The cookie is set by the GDPR Cookie Consent plugin and is used to store whether or not user has consented to the use of cookies. It does not store any personal data.
Functional cookies help to perform certain functionalities like sharing the content of the website on social media platforms, collect feedbacks, and other third-party features.
Performance cookies are used to understand and analyze the key performance indexes of the website which helps in delivering a better user experience for the visitors.
Analytical cookies are used to understand how visitors interact with the website. These cookies help provide information on metrics the number of visitors, bounce rate, traffic source, etc.
Advertisement cookies are used to provide visitors with relevant ads and marketing campaigns. These cookies track visitors across websites and collect information to provide customized ads.


