Government
The Insecurity Of Social Security
The Insecurity Of Social Security
Authored by Lance Roberts via RealInvestmentAdvice.com,
The latest annual report from the Social Security Trustees showed the insecurity of social security.
According to the July 2021 snapshot from the…
Share this:

Authored by Lance Roberts via RealInvestmentAdvice.com,
The latest annual report from the Social Security Trustees showed the insecurity of social security.
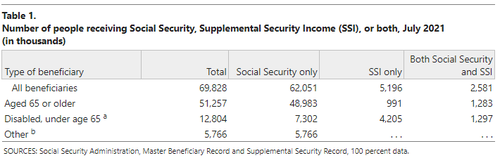
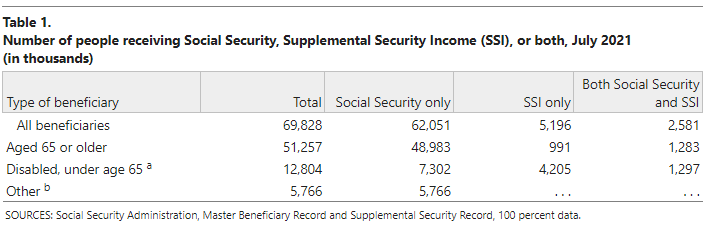
According to the July 2021 snapshot from the Social Security Administration, nearly 70-million people receive a monthly benefit check, of which 51.3 million are over the age of 65.
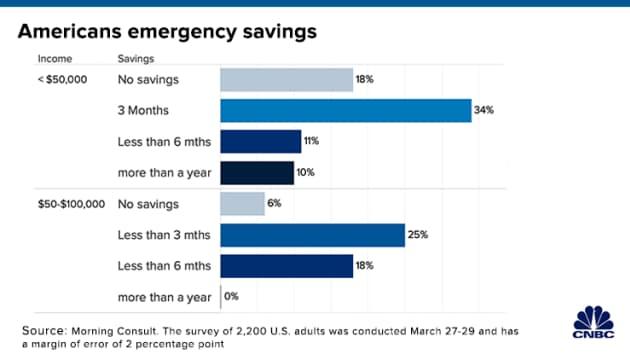
Social Security provides the majority of income to most elderly Americans. The system provides at least 50 percent of incomes for about half of seniors. For roughly 1 in 4 seniors, it provides at least 90 percent of total incomes. But, that dependency ratio is directly tied to the financial insolvency of the vast majority of Americans. According to a CNBC report:
“Morning Consult found that nearly 18% of adults with an annual income of $50,000 or less have no savings, while some 34% have enough to cover just three months of expenses. Another 11% would deplete savings within six months. Only 10% of that income group has more than a year’s worth of cash.
Higher-income households are only somewhat better prepared, the survey found. Among those with annual incomes of $50,000 to $100,000, about 18% said they have between three months and six months of savings. About 25% said their cash would last less than three months, and 6% had set aside nothing at all. None of those questioned in that income group had more than a year’s worth of savings.”
Such is a huge problem that will impact boomers in retirement.
The Insecurity Of Social Security
Given the financial insecurity of the bottom 90% of Americans, the dependency on social security is problematic. Here are some facts from the latest SSI report from CRFB:
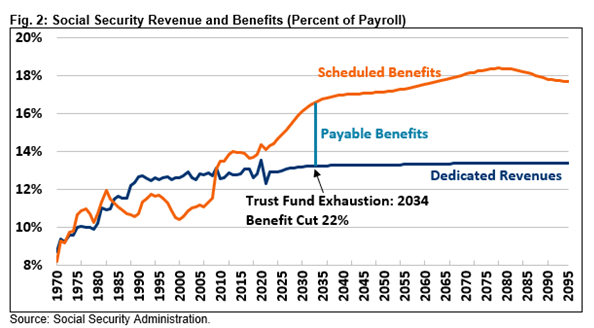
- Social Security is Only 13 Years from Insolvency. Social Security cannot guarantee full benefits to current retirees under current law. The Trustees project the Social Security Old-Age and Survivors Insurance (OASI) trust fund will deplete its reserves by 2033. The Social Security Disability Insurance (SSDI) trust fund will be insolvent by 2057. The theoretical combined trust funds will exhaust their reserves by 2034. Upon insolvency, all beneficiaries will face a 22% benefit cut.
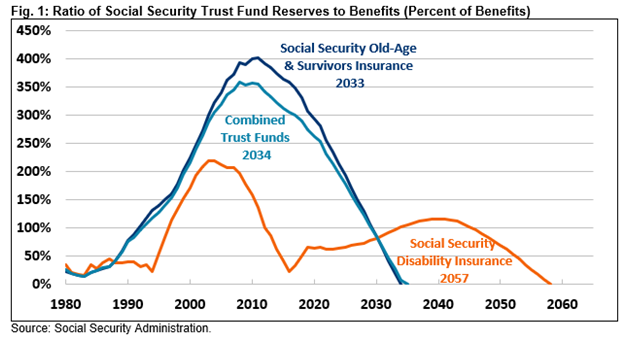
Source: CRFB
- Social Security will run cash deficits of $2.4 trillion over the next decade. Such is the equivalent of 2.3% of taxable payroll or 0.8% of (GDP). Social Security’s 75-year actuarial imbalance totals 3.54% of taxable payroll. That is 1.2% of GDP or nearly $21 trillion in present value terms.
- Finances Are Deteriorating. Social Security’s finances worsened over the last year. Current projections show Insolvency occuring a year earlier, and the 75-year actuarial deficit is over 10 percent larger. The 75-year shortfall is nearly 85% larger than orginally estimated in 2010.
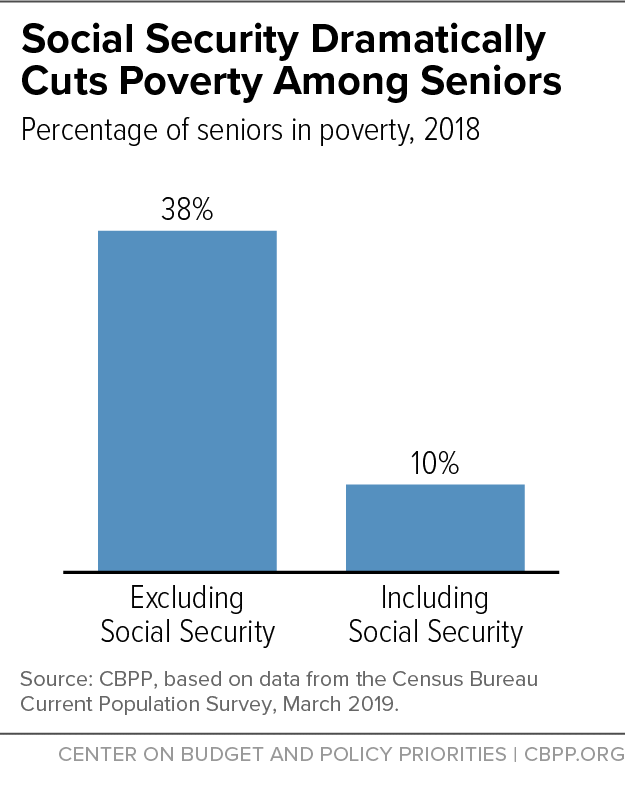
The problem is evident. Given the large and growing dependency on social security, benefits will get cut for recipients if Congress fails to act. As noted by the Center Of Budget & Policy, social security for many retirees is the difference between living in poverty or not.
Demographics Are Destiny
One of the primary contributors to the insecurity of social security is demographics.
In 1940, the life expectancy of a 65-year-old was just 14 years. Today it is over 20 years. By 2035, the number of Americans 65 and older will increase from approximately 56 million today to over 78 million.
The problem for social security is that in 1940, nearly 16-workers paid into the program for each person receiving benefits. Currently, that ratio is just 2.8 workers for each Social Security beneficiary. By 2035, that ratio will decrease to 2.3 covered workers for each beneficiary.
“Social Security will see negative cash flow of $147 billion this year. The deficits will keep adding up as the population ages as fewer workers pay into the system relative to the number of retirees collecting benefits.” – Reason
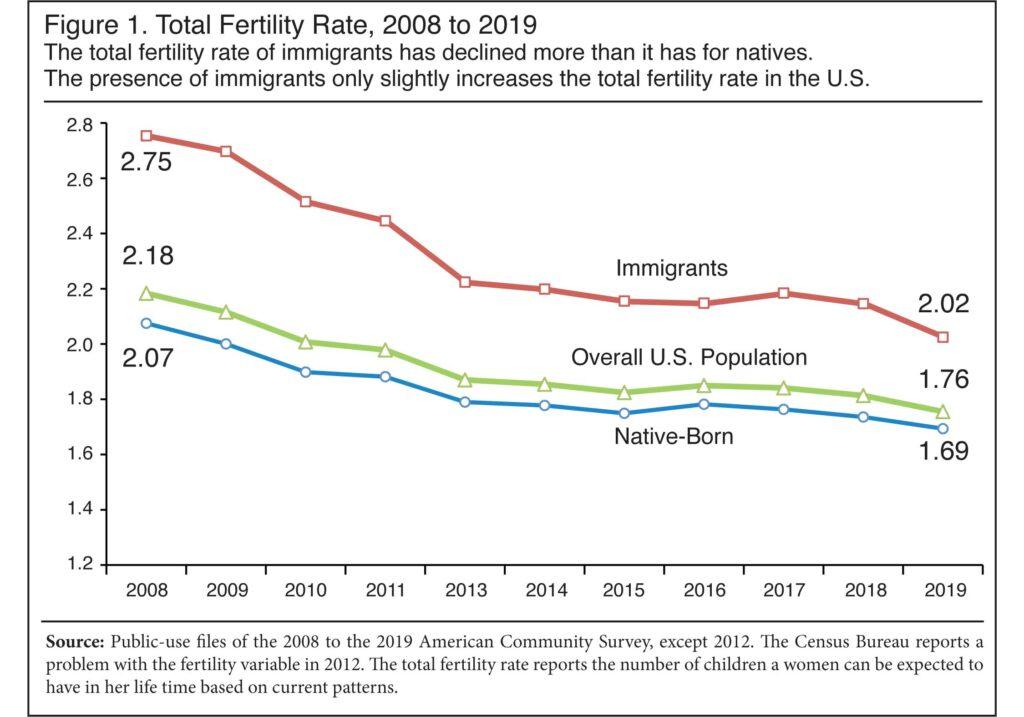
Such increases in the number of retirees and lower birth rates decrease the relative number of workers. However, this decline in the “support ratio” is not just domestic, but global.
“Recently released official U.S. birth data for 2020 showed births fell continuously for more than a decade. The ‘total fertility rate,’ is a measure constructed from the data to estimate the average total number of children born. That rate fell from 2.12 in 2007 to 1.64 in 2020. It is now well below 2.1, the value considered to be ‘replacement fertility,’ which is the rate needed for the population to replace itself without immigration.“
However, the problem isn’t just the “replacement rate” of workers paying into the system. But also the structural change to the workforce itself.
A Structural Employment Problem
The structural shift in employment is due to technology and automation. Yet, it is an overarching problem most give little attention to.
While the mainstream media focuses their attention on the daily distribution of economic data points, there is a hidden depression running along the country’s underbelly. While reported unemployment is heading back to historically lower levels, there is a swelling mass of uncounted individuals. These are individuals assumed to have either given up looking for work or are working multiple part-time jobs.
The chart strips out the argument of retiring baby boomers, who ironically, aren’t retiring. Such is not because they don’t want to retire, but because they can’t afford to.
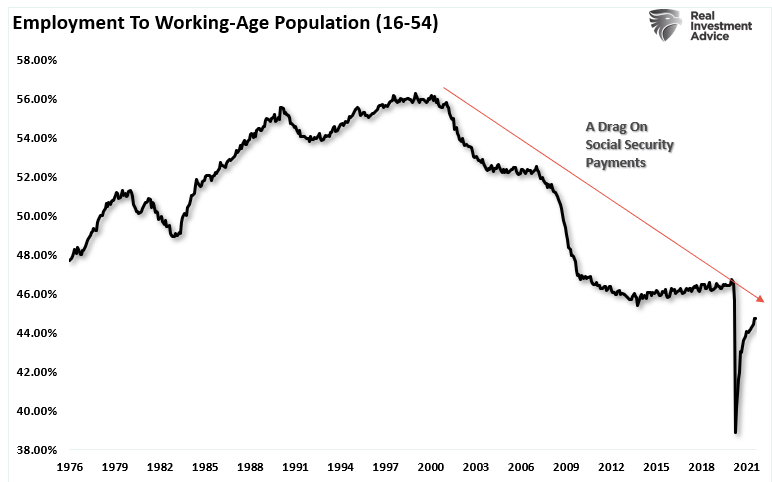
These higher levels of under and unemployment apply downward pressure on wages even as work hours increase. Real wage declines are evident as companies opt for increasing productivity, continued outsourcing, and streamlining employment to protect corporate profit margins. However, as the cost of living is affected by the rising food, energy, and health care prices without a compensatory increase in incomes, more families are forced to turn to assistance to survive.
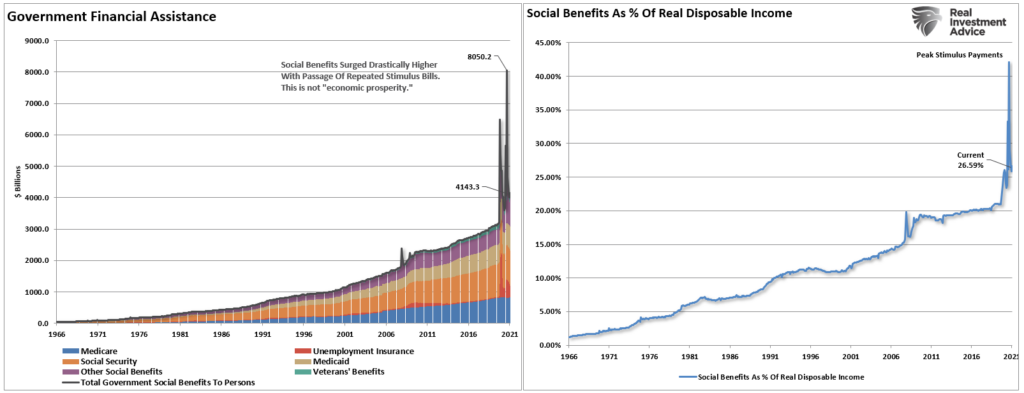
Without government largesse, many individuals would live on the street. The chart above shows all the government “welfare” programs and current levels to date. The black line represents the sum of the underlying sub-components. Thus, while unemployment insurance did taper off after its sharp rise post-pandemic, social security, Medicaid, Veterans’ benefits, and other social benefits continue to rise.
Importantly, these social benefits are critical to the average person’s survival as they make up more than 25% of real disposable personal incomes.
With 1/4 of incomes dependent on government transfers, it is not surprising the economy continues to struggle. Recycled tax dollars used for consumption purposes have virtually no impact on the overall economy.
The Social Security Insecurity Endgame
As stated above, the biggest problem for Social Security, and the U.S. in general, comes when Social Security begins paying out more in benefits than it receives in taxes. Then, as the cash surplus gets depleted, Social Security can not pay full benefits from its tax revenues alone.
Already, welfare programs in the U.S. are consuming ever-growing amounts of general revenue dollars to meet obligations.As noted recently,mandatory spending already consumes more than 100% of Federal tax revenues.
“In the fiscal year 2019, the Federal Government spent $4.4 trillion, amounting to 21 percent of the nation’s gross domestic product (GDP). Of that $4.4 trillion, federal revenues financed only $3.5 trillion. The remaining $984 billion came from debt issuance. As the chart below shows, three major areas of spending make up most of the budget.”

Think about that for a minute. In 2019, 75% of all expenditures went to social welfare and interest on the debt. Those payments required $3.3 Trillion of the $3.5 Trillion (or 95%) of the total revenue collected. Given the decline in economic activity during 2020, those numbers become markedly worse. For the first time in U.S. history, the Federal Government will have to issue debt to cover the mandatory spending.“
Eventually, either the benefits will get slashed, or the rest of the government will have to shrink to accommodate the “welfare state.” It is improbable the latter will happen.
Conclusion
Demographic trends are reasonably easy to forecast and predict. Each year from now until 2035, we will see successive rounds of boomers reach the 62-year-old threshold. Two problems are resulting from these consecutive crops of boomers heading into retirement.
The first is that each boomer has not produced enough children to replace themselves, which leads to a decline in the number of taxpaying workers. It takes about 25 years to grow a new taxpayer. We can estimate, with surprising accuracy, how many people born in a particular year will retire. The retirees of 2070 were born in 2003, and we can see and count them today.
The second problem is the employment problem. The decline in economic prosperity is the result of four decades of misguided policy:
-
Increases in non-productive debt and deficits,
-
Reduction in savings,
-
Declining income growth due to productivity increases; and,
-
The shift from a manufacturing to service based society that generates lower levels of taxable incomes in the future.
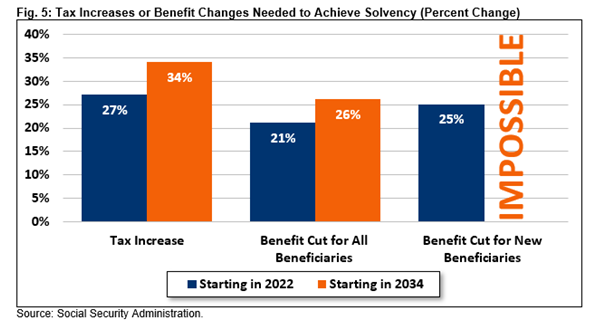
“The more time that passes, the heavier the lift will be. According to an analysis from the Committee for a Responsible Federal Budget, which advocates for low deficits and sustainable entitlement programs, delaying action until insolvency hits in 2034 will make the needed tax increases or benefit reductions about 25 percent larger than if Congress acted today. In either case, the changes will be seriously disruptive to Americans’ retirement plans and financial security.” – Reason
The entire social support framework faces an inevitable conclusion where no wishful thinking will change that outcome. The question is whether our elected leaders will start making the changes necessary sooner, while they can get done by choice or later when forced upon us.
Post Views: 296
2021/09/10
International
John Lewis relies too heavily on its heritage – here’s what it could do instead
The company has returned to profit by making cuts, but there are things it could do to reinvent itself.
Share this:


In a tricky economic climate, the British department store John Lewis has managed to deliver some good news. The retail partnership – owned by its 80,000 employees – posted pre-tax profits of £56 million after a £234 million loss the year before.
The positive announcement was somewhat tarnished by the fact that those employees (known as partners) would not receive a bonus for the second year in a row. There were also hints of job cuts.
But what more could this giant of UK retail, which also owns Waitrose supermarkets, do to endure its survival? Does its increasing reliance on grocery sales mean its own brand has become less valuable?
For over 160 years on the high street, John Lewis has worked hard on that brand. Its slogan (scrapped in 2022) about being “never knowingly undersold” was well known, it remains a trusted supplier of an extensive range of household hoods, rates highly for customer service, and runs Christmas TV adverts which have became a media event in themselves.
In doing all of those things, John Lewis seemed to be in a much better place than its rivals. BHS (founded in 1928) and Debenhams (1778) have disappeared from the high street. House of Fraser (1849) was taken over and has a much-reduced physical presence.
John Lewis’s nearest rival, Marks & Spencer (1884), is now doing well, but only after it underwent a fairly brutal restructuring which involved cutting thousands of jobs during the pandemic, closing 67 stores, and slashing its operations in France.
So John Lewis’s “brand heritage” – its history, tradition and pedigree – has worked pretty well for a pretty long time. But its recent return to profit was the combined effort of reinvesting and streamlining, according to some reports.
Also known as “trimming the fat” in the business world, the retailer’s streamlining endeavours consisted of cutting more than 1,500 jobs, and closing underperforming stores, such as the branch in Sheffield, which had served residents for nearly 80 years and was much mourned, including by my own mother-in-law.
It has also been reported that more job cuts are imminent, with up to 11,000 jobs to go in the next five years.
And perhaps these measures highlight some of the harsh realities of running a department store in the always-open and effortless world of online shopping. Maybe employees (even those considered partners, as under John Lewis’s employee-ownership model) have become expendable.
Maybe physical stores, where consumers go to explore and seek advice, have become expendable. Maybe all traditions are expendable when they are not commercially viable.
People first
Yet the world of retail is filled with examples of heritage brands reinventing themselves to stay relevant, buoyant and competitive.
John Lewis will need to do the same if it wants to retain its legacy on the British high street. And it could do worse than taking a leaf out of Waitrose’s playbook.
For the company’s return to profit was largely due to the buoyant sales generated by Waitrose supermarkets, which increased by 4%. The department store business meanwhile, suffered a 2% fall.
Part of Waitrose’s success comes from providing a sense of indulgence and enjoyment – including healthy food – through carefully curated and often locally sourced products. It works closely with local farmers, supports regional suppliers (an approach that has also contributed to M&S’s success), and reinvests in stores and product offers.
Essentially, as part of UK’s grocery sector, Waitrose extended its partnership ethos to include people and groups beyond the shop walls – to build a “local retail ecosystem” that promotes and leverages a community spirit around their stores.

John Lewis department stores could try and do something similar. They could focus more on products that help customers live healthier and more active lives, and which are relevant to their interests. They could sell products created by local small businesses, and make a determined approach to be a supportive presence in the regions they serve.
Research suggests that heritage brands benefit from having a moral standing – when they show they care about the people they make money from, the local communities they operate in, and the people they employ.
So perhaps John Lewis should make moral values a part of its evolving heritage. It needs to show it cares not just for the people who work for the company directly, but also the people on whom it relies for success – the customers – and people it can build new relationships with. All of them could prove critical to its future success.
Kokho Jason Sit is affiliated with the Chartered Institute of Marketing.
recovery pandemic uk franceGovernment
“Are you better off than you were four years ago?”
– by New Deal democratNo economic news today, so let me take a look at the supposed killer recent GOP meme that they claim is completely unanswerable:…
Share this:

- by New Deal democrat
No economic news today, so let me take a look at the supposed killer recent GOP meme that they claim is completely unanswerable: “Are you better off today than you were four years ago?”


Spread & Containment
AI can help predict whether a patient will respond to specific tuberculosis treatments, paving way for personalized care
People have been battling tuberculosis for thousands of years, and drug-resistant strains are on the rise. Analyzing large datasets with AI can help humanity…
Share this:


Tuberculosis is the world’s deadliest bacterial infection. It afflicted over 10 million people and took 1.3 million lives in 2022. These numbers are predicted to increase dramatically because of the spread of multidrug-resistant TB.
Why does one TB patient recover from the infection while another succumbs? And why does one drug work in one patient but not another, even if they have the same disease?
People have been battling TB for millennia. For example, researchers have found Egyptian mummies from 2400 BCE that show signs of TB. While TB infections occur worldwide, the countries with the highest number of multidrug-resistant TB cases are Ukraine, Moldova, Belarus and Russia.
Researchers predict that the ongoing war in Ukraine will result in an increase in multidrug-resistant TB cases because of health care disruptions. Additionally, the COVID-19 pandemic reduced access to TB diagnosis and treatment, reversing decades of progress worldwide.
Rapidly and holistically analyzing available medical data can help optimize treatments for each patient and reduce drug resistance. In our recently published research, my team and I describe a new AI tool we developed that uses worldwide patient data to guide more personalized and effective treatment of TB.
Predicting success or failure
My team and I wanted to identify what variables can predict how a patient responds to TB treatment. So we analyzed more than 200 types of clinical test results, medical imaging and drug prescriptions from over 5,000 TB patients in 10 countries. We examined demographic information such as age and gender, prior treatment history and whether patients had other conditions. Finally, we also analyzed data on various TB strains, such as what drugs the pathogen is resistant to and what genetic mutations the pathogen had.
Looking at enormous datasets like these can be overwhelming. Even most existing AI tools have had difficulty analyzing large datasets. Prior studies using AI have focused on a single data type – such as imaging or age alone – and had limited success predicting TB treatment outcomes.
We used an approach to AI that allowed us to analyze a large and diverse number of variables simultaneously and identify their relationship to TB outcomes. Our AI model was transparent, meaning we can see through its inner workings to identify the most meaningful clinical features. It was also multimodal, meaning it could interpret different types of data at the same time.

Once we trained our AI model on the dataset, we found that it could predict treatment prognosis with 83% accuracy on newer, unseen patient data and outperform existing AI models. In other words, we could feed a new patient’s information into the model and the AI would determine whether a specific type of treatment will either succeed or fail.
We observed that clinical features related to nutrition, particularly lower BMI, are associated with treatment failure. This supports the use of interventions to improve nourishment, as TB is typically more prevalent in undernourished populations.
We also found that certain drug combinations worked better in patients with certain types of drug-resistant infections but not others, leading to treatment failure. Combining drugs that are synergistic, meaning they enhance each other’s potency in the lab, could result in better outcomes. Given the complex environment in the body compared with conditions in the lab, it has so far been unclear whether synergistic relationships between drugs in the lab hold up in the clinic. Our results suggest that using AI to weed out antagonistic drugs, or drugs that inhibit or counteract each other, early in the drug discovery process can avoid treatment failures down the line.
Ending TB with the help of AI
Our findings may help researchers and clinicians meet the World Health Organization’s goal to end TB by 2035, by highlighting the relative importance of different types of clinical data. This can help prioritize public health efforts to mitigate TB.
While the performance of our AI tool is promising, it isn’t perfect in every case, and more training is needed before it can be used in the clinic. Demographic diversity can be high within a country and may even vary between hospitals. We are working to make this tool more generalizable across regions.
Our goal is to eventually tailor our AI model to identify drug regimens suitable for individuals with certain conditions. Instead of a one-size-fits-all treatment approach, we hope that studying multiple types of data can help physicians personalize treatments for each patient to provide the best outcomes.
Sriram Chandrasekaran receives funding from the US National Institutes of Health.
treatment genetic pandemic covid-19 spread russia ukraine world health organization

Google’s A.I. Fiasco Exposes Deeper Infowarp


Greenback Surges after BOJ Hikes and Ends YCC and RBA Delivers a Dovish Hold


Young People Aren’t Nearly Angry Enough About Government Debt


Student loan borrowers may finally get answers to loan forgiveness issues


Report Criticizes ‘Catastrophic Errors’ Of COVID Lockdowns, Warns Of Repeat


Bolsonaro Indicted By Brazilian Police For Falsifying Covid-19 Vaccine Records


QE By A Different Name Is Still QE


“Are you better off than you were four years ago?”


Anti-Semitism As The Harbinger Of Global Chaos


It’s Not Coercion If We Do It…
-

 Spread & Containment1 week ago
IFM’s Hat Trick and Reflections On Option-To-Buy M&A
-

 Uncategorized4 weeks ago
All Of The Elements Are In Place For An Economic Crisis Of Staggering Proportions
-

 International2 weeks ago
EyePoint poaches medical chief from Apellis; Sandoz CFO, longtime BioNTech exec to retire
-

 Uncategorized1 month ago
California Counties Could Be Forced To Pay $300 Million To Cover COVID-Era Program
-

 Uncategorized4 weeks ago
Apparel Retailer Express Moving Toward Bankruptcy
-

 Uncategorized1 month ago
Industrial Production Decreased 0.1% in January
-

 International2 weeks ago
Walmart launches clever answer to Target’s new membership program
-

 Uncategorized1 month ago
RFK Jr: The Wuhan Cover-Up & The Rise Of The Biowarfare-Industrial Complex