Uncategorized
The Fed Disaster Plan — How Bad Can it Get?
************************************* Hi, Grant Linhares here, the Trading Services Director for Mark Skousen. I just have a quick reminder that you are…
Share this:

*************************************
Hi, Grant Linhares here, the Trading Services Director for Mark Skousen. I just have a quick reminder that you are in good hands with Dr. Skousen — especially in this volatile market. I would also like to remind you that “Winner’s Circle,” a lifetime bundle of all of Mark’s services, is now open. This is a great opportunity to use all of Mark’s services to navigate and profit in these markets, especially in the new year, at a great price. Simply give me a call at 1-202-677-4492 today, and I’ll give you your personalized quote to join as you get a prorated refund for your current products. But hurry, this offer expires on Dec. 22!
*****************************************
“There’s always a bigger junkyard dog.” — Dennis Gartman (“Maxims of Wall Street,” p. 84)
Earlier this year I warned my subscribers about the Biden Disaster Plan — which was to push through massive deficit spending, causing prices to rise to their fastest level in 40 years.
Then, I alerted subscribers to the Trump Disaster Plan — that kept the Republicans from gaining control of the Senate while narrowly eking out a majority in the House when the new Congress convenes Jan. 3.
And now I’m alerting them to the Fed Disaster Plan — raising interest rates in a fast and furious fashion, causing a bear market on Wall Street, a potential recession and perhaps even a monetary crisis in 2023.
Wall Street has a hard time believing Fed Chairman Jay Powell, and that he’s determined to fight inflation and bring it down to the 2% target rate.
Most Wall Streeters want the stock market to go up and are convinced that the Fed will back down. But so far, every time they have been proven wrong, and the stock market tanks after Powell declares that once again, he’s determined to impose tight money until price inflation comes down, a recession hits or a monetary crisis erupts.
Powell and the Fed (along with Biden and the Democrats) caused massive inflation in the first place through their easy money policies during the 2020-21 pandemic.
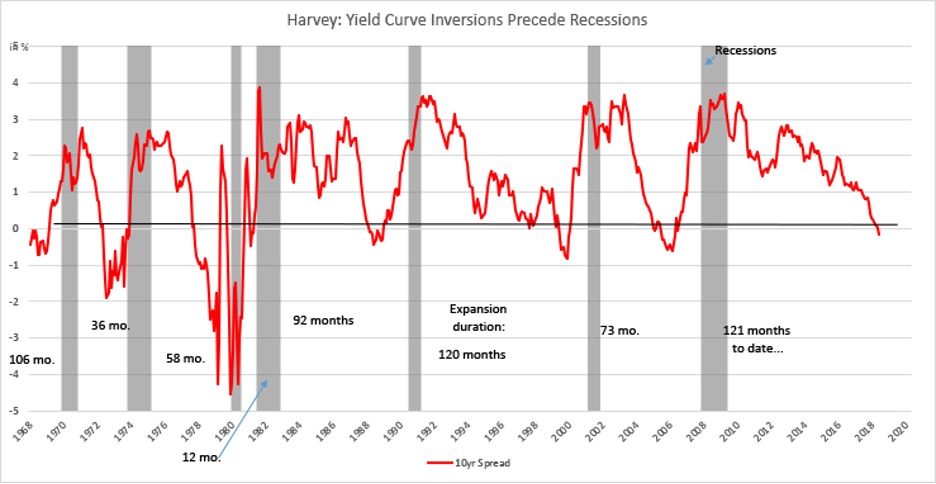
Now, he’s facing the music and wants to reverse the trend through a tight money policy. We now have a negative yield curve with T-bill rates at 4.3% and 10-year notes at 3.6%. 30-year fixed mortgage rates are now at 7%.
Negative yield curves are a big deal, since almost every recession has been preceded by a tight money policy, as the chart shows below:
There is a lag, but eventually a negative yield curve causes a recession. According to my gross output (GO) data, we are not in a recession yet, but it could happen in 2023. I’ll have an update on GO on Thursday, Dec. 22.
Tesla and the Bear Market
We’ve been in a bear market for the entire year. Tech stocks, in particular, have been hard hit.
Tesla stock continues to decline and is now down 55% year to date. In early October, I confronted Elon Musk about overvalued Tesla stock (still selling at 70 times earnings) at the Baron Investment Conference. You can watch the confrontation here. It’s gone viral on Facebook.
I raised the question, “Why should I invest in Tesla selling at 70 times earnings when Mercedes Benz, which also makes electric cars, is selling for only six times earnings and pays an 8% dividend?”
Be sure to listen to Elon Musk’s response.
Afterward, I recommended Mercedes Benz stock in my Home Run Trader service. It’s up 15% while Tesla stock has fallen another 25%.
For more information on my Home Run Trader service, click here.
Investors Lost Even More Money in FTX
Bear markets also reveal financial frauds. The Bernie Madoff Ponzi scheme unraveled after the financial crisis of 2008.
Now we are witnessing the FTX crypto scandal. Headquarterd in the Bahamas, FTX was a cryptocurrency exchange (with over 1 million users) and hedge fund started by Sam Bankman-Fried in 2019. In a matter of years, he became a multi-billionaire who, according to government officials and other investigators, embezzled his clients’ funds and committed voter fraud by funding numerous Democratic candidates during the 2022 election.
According to Bloomberg, his net worth fell from $26 billion to almost nothing within weeks, the worst collapse in history.
Did his Parents Play a Role?
Sam Bankman-Fried came from a blue-blood background: His father is Joseph Bankman and his mother is Barbara Fried, both professors of law at Stanford University Law School. Both were with their son in the Bahamas at the hearings to extradite him to the United States.
Joseph Bankman is an expert in tax law (especially issues related to tax evasion) and psychology. He’s a graduate of Yale and Berkeley.
His wife, Barbara Fried, teaches the Legal Studies Workshop at Stanford, which includes a major section on moral/political theory. She was awarded “excellence in teaching” awards three times. She received all three degrees (BA, MA and JD) from Harvard. His sister Linda Fried teaches public health at Columbia University.
Their son, Sam, graduated from MIT.
So, it has not been a good year for the reputation of Ivy League schools. Or the Democratic Party. Or Bitcoin and cryptocurrencies. Or the Bahamas.
Action to Take: I urge investors to play it conservatively as we enter a new year with a diversified portfolio: high-dividend paying stocks, commodities such as oil and gold, and a cash position to take advantage of bargains. Such an approach will cushion the fall and will set you up to see strong gains when the market recovers.
One More Find in my Garage: A Special Edition of My Financial Privacy Book!
As subscribers know, I cleaned out my garage in my Florida house last month and came across several boxes of first editions of past bestsellers, including “Economics on Trial”, “Economics of a Pure Gold Standard” and “Scrooge Investing”. I sold them to my subscribers, and all of them sold out within a day or two.
One box contained 17 copies of a special 1982 private edition of “Mark Skousen’s Complete Guide to Financial Privacy” — all copies are hardback, come with a book jacket and are shrink wrapped in perfect condition.

My privacy book, in various editions, sold over half a million copies. It was my #1, national bestseller.
Although some of the advice is out of date, the privacy book raises issues that are even more relevant today. In this computer age, it’s almost impossible to be a “private investor” anymore. Government and big business are constantly monitoring your every move, your finances and even your political views. China is the worst example, but it’s a big problem in the United States and the West as well.
As Supreme Court Justice Louis Brandeis said, “The right most valued by all civilized men is the right to be left alone.” (“Maxims of Wall Street,” p. 95)
Chapters include “What have you got to hide?”…“How to be an international private investor”… “Safekeeping your valuables”… “Privacy and the tax man” and “The private will.”
I’ve decided to sell these 17 copies for $47 each. I’ll autograph and date each one. When they’re gone, they’re gone. To order, go to www.skousenbooks.com.
Financial Privacy in ‘The Maxims of Wall Street’
I have several pages in “The Maxims of Wall Street” on financial privacy and the importance of maintain a low profile.
Christmas is less than two weeks away. If you would like to buy one or more copies of “The Maxims,” order them today. Only $20 for the first copy, and $10 for all additional copies. I sign all books and mail them at no additional charge inside the United States. Order at www.skousenbooks.com.
P.S. I will be holding a subscribers-only teleconference at 2 p.m. EST on Dec. 21 entitled “How To Profit from the Fed’s Disaster Plan.” The event is free for all my subscribers, but you have to register here to be able to attend. Don’t miss out!
Good investing, AEIOU,
Mark Skousen
You Blew It!
Nation’s City Council Votes to Eliminate Bus Fare
“There’s always free cheese in a mousetrap.” — Congressman H. R. Gross
Earlier this year, the Washington D.C. City Council voted unanimously to make bus transportation free in the city, to encourage downtown business and evening activity.
But, of course, nothing is free. Taxpayers will foot the bill, amounting to an estimated $42 million a year. The Washington Metropolitan Area Transit Authority currently faces a budget deficit of $185 million.
Mayor Muriel Bowser has also promised repeatedly to end homelessness in the nation’s capital and has already spent $31 million to get people off the streets and another $114 million to improve local shelters.
But I suspect that the free bus fares will only increase the appeal of the homeless to move to Washington D.C..
The Unintended Consequences of Socialism
In my economics classes at Chapman University, I always warn students about the dangers of offering “free” college tuition and “free” medical services or any other valuable commodity or service. It always results in abuse, fraud, overuse of resources, higher taxes and an entitlement mentality.
Take college tuition, for example. When students don’t have to pay for their college education, they often don’t appreciate its value and aren’t as competent when they graduate and take on a new job.
On the other hand, studies have shown that students who pay for their schooling choose their major sooner, get better grades and graduate on time. Economics is all about incentives.
Now I’ll have to add “free” bus fare to my list of bad economic policies.
The post The Fed Disaster Plan — How Bad Can it Get? appeared first on Stock Investor.
yield curve pandemic stocks cryptocurrency bitcoin crypto mortgage rates crypto commodities gold oilUncategorized
February Employment Situation
By Paul Gomme and Peter Rupert The establishment data from the BLS showed a 275,000 increase in payroll employment for February, outpacing the 230,000…
Share this:


By Paul Gomme and Peter Rupert
The establishment data from the BLS showed a 275,000 increase in payroll employment for February, outpacing the 230,000 average over the previous 12 months. The payroll data for January and December were revised down by a total of 167,000. The private sector added 223,000 new jobs, the largest gain since May of last year.

Temporary help services employment continues a steep decline after a sharp post-pandemic rise.


Average hours of work increased from 34.2 to 34.3. The increase, along with the 223,000 private employment increase led to a hefty increase in total hours of 5.6% at an annualized rate, also the largest increase since May of last year.

The establishment report, once again, beat “expectations;” the WSJ survey of economists was 198,000. Other than the downward revisions, mentioned above, another bit of negative news was a smallish increase in wage growth, from $34.52 to $34.57.

The household survey shows that the labor force increased 150,000, a drop in employment of 184,000 and an increase in the number of unemployed persons of 334,000. The labor force participation rate held steady at 62.5, the employment to population ratio decreased from 60.2 to 60.1 and the unemployment rate increased from 3.66 to 3.86. Remember that the unemployment rate is the number of unemployed relative to the labor force (the number employed plus the number unemployed). Consequently, the unemployment rate can go up if the number of unemployed rises holding fixed the labor force, or if the labor force shrinks holding the number unemployed unchanged. An increase in the unemployment rate is not necessarily a bad thing: it may reflect a strong labor market drawing “marginally attached” individuals from outside the labor force. Indeed, there was a 96,000 decline in those workers.


Earlier in the week, the BLS announced JOLTS (Job Openings and Labor Turnover Survey) data for January. There isn’t much to report here as the job openings changed little at 8.9 million, the number of hires and total separations were little changed at 5.7 million and 5.3 million, respectively.

As has been the case for the last couple of years, the number of job openings remains higher than the number of unemployed persons.

Also earlier in the week the BLS announced that productivity increased 3.2% in the 4th quarter with output rising 3.5% and hours of work rising 0.3%.

The bottom line is that the labor market continues its surprisingly (to some) strong performance, once again proving stronger than many had expected. This strength makes it difficult to justify any interest rate cuts soon, particularly given the recent inflation spike.
unemployment pandemic unemploymentUncategorized
Mortgage rates fall as labor market normalizes
Jobless claims show an expanding economy. We will only be in a recession once jobless claims exceed 323,000 on a four-week moving average.
Share this:


Everyone was waiting to see if this week’s jobs report would send mortgage rates higher, which is what happened last month. Instead, the 10-year yield had a muted response after the headline number beat estimates, but we have negative job revisions from previous months. The Federal Reserve’s fear of wage growth spiraling out of control hasn’t materialized for over two years now and the unemployment rate ticked up to 3.9%. For now, we can say the labor market isn’t tight anymore, but it’s also not breaking.
The key labor data line in this expansion is the weekly jobless claims report. Jobless claims show an expanding economy that has not lost jobs yet. We will only be in a recession once jobless claims exceed 323,000 on a four-week moving average.
From the Fed: In the week ended March 2, initial claims for unemployment insurance benefits were flat, at 217,000. The four-week moving average declined slightly by 750, to 212,250
Below is an explanation of how we got here with the labor market, which all started during COVID-19.
1. I wrote the COVID-19 recovery model on April 7, 2020, and retired it on Dec. 9, 2020. By that time, the upfront recovery phase was done, and I needed to model out when we would get the jobs lost back.
2. Early in the labor market recovery, when we saw weaker job reports, I doubled and tripled down on my assertion that job openings would get to 10 million in this recovery. Job openings rose as high as to 12 million and are currently over 9 million. Even with the massive miss on a job report in May 2021, I didn’t waver.
Currently, the jobs openings, quit percentage and hires data are below pre-COVID-19 levels, which means the labor market isn’t as tight as it once was, and this is why the employment cost index has been slowing data to move along the quits percentage.

3. I wrote that we should get back all the jobs lost to COVID-19 by September of 2022. At the time this would be a speedy labor market recovery, and it happened on schedule, too
Total employment data
4. This is the key one for right now: If COVID-19 hadn’t happened, we would have between 157 million and 159 million jobs today, which would have been in line with the job growth rate in February 2020. Today, we are at 157,808,000. This is important because job growth should be cooling down now. We are more in line with where the labor market should be when averaging 140K-165K monthly. So for now, the fact that we aren’t trending between 140K-165K means we still have a bit more recovery kick left before we get down to those levels.

From BLS: Total nonfarm payroll employment rose by 275,000 in February, and the unemployment rate increased to 3.9 percent, the U.S. Bureau of Labor Statistics reported today. Job gains occurred in health care, in government, in food services and drinking places, in social assistance, and in transportation and warehousing.
Here are the jobs that were created and lost in the previous month:

In this jobs report, the unemployment rate for education levels looks like this:
- Less than a high school diploma: 6.1%
- High school graduate and no college: 4.2%
- Some college or associate degree: 3.1%
- Bachelor’s degree or higher: 2.2%

Today’s report has continued the trend of the labor data beating my expectations, only because I am looking for the jobs data to slow down to a level of 140K-165K, which hasn’t happened yet. I wouldn’t categorize the labor market as being tight anymore because of the quits ratio and the hires data in the job openings report. This also shows itself in the employment cost index as well. These are key data lines for the Fed and the reason we are going to see three rate cuts this year.
recession unemployment covid-19 fed federal reserve mortgage rates recession recovery unemploymentUncategorized
Inside The Most Ridiculous Jobs Report In History: Record 1.2 Million Immigrant Jobs Added In One Month
Inside The Most Ridiculous Jobs Report In History: Record 1.2 Million Immigrant Jobs Added In One Month
Last month we though that the January…
Share this:


Last month we though that the January jobs report was the "most ridiculous in recent history" but, boy, were we wrong because this morning the Biden department of goalseeked propaganda (aka BLS) published the February jobs report, and holy crap was that something else. Even Goebbels would blush.
What happened? Let's take a closer look.
On the surface, it was (almost) another blockbuster jobs report, certainly one which nobody expected, or rather just one bank out of 76 expected. Starting at the top, the BLS reported that in February the US unexpectedly added 275K jobs, with just one research analyst (from Dai-Ichi Research) expecting a higher number.
Some context: after last month's record 4-sigma beat, today's print was "only" 3 sigma higher than estimates. Needless to say, two multiple sigma beats in a row used to only happen in the USSR... and now in the US, apparently.

Before we go any further, a quick note on what last month we said was "the most ridiculous jobs report in recent history": it appears the BLS read our comments and decided to stop beclowing itself. It did that by slashing last month's ridiculous print by over a third, and revising what was originally reported as a massive 353K beat to just 229K, a 124K revision, which was the biggest one-month negative revision in two years!

Of course, that does not mean that this month's jobs print won't be revised lower: it will be, and not just that month but every other month until the November election because that's the only tool left in the Biden admin's box: pretend the economic and jobs are strong, then revise them sharply lower the next month, something we pointed out first last summer and which has not failed to disappoint once.
In the past month the Biden department of goalseeking stuff higher before revising it lower, has revised the following data sharply lower:
— zerohedge (@zerohedge) August 30, 2023
- Jobs
- JOLTS
- New Home sales
- Housing Starts and Permits
- Industrial Production
- PCE and core PCE
To be fair, not every aspect of the jobs report was stellar (after all, the BLS had to give it some vague credibility). Take the unemployment rate, after flatlining between 3.4% and 3.8% for two years - and thus denying expectations from Sahm's Rule that a recession may have already started - in February the unemployment rate unexpectedly jumped to 3.9%, the highest since February 2022 (with Black unemployment spiking by 0.3% to 5.6%, an indicator which the Biden admin will quickly slam as widespread economic racism or something).

And then there were average hourly earnings, which after surging 0.6% MoM in January (since revised to 0.5%) and spooking markets that wage growth is so hot, the Fed will have no choice but to delay cuts, in February the number tumbled to just 0.1%, the lowest in two years...

... for one simple reason: last month's average wage surge had nothing to do with actual wages, and everything to do with the BLS estimate of hours worked (which is the denominator in the average wage calculation) which last month tumbled to just 34.1 (we were led to believe) the lowest since the covid pandemic...

... but has since been revised higher while the February print rose even more, to 34.3, hence why the latest average wage data was once again a product not of wages going up, but of how long Americans worked in any weekly period, in this case higher from 34.1 to 34.3, an increase which has a major impact on the average calculation.

While the above data points were examples of some latent weakness in the latest report, perhaps meant to give it a sheen of veracity, it was everything else in the report that was a problem starting with the BLS's latest choice of seasonal adjustments (after last month's wholesale revision), which have gone from merely laughable to full clownshow, as the following comparison between the monthly change in BLS and ADP payrolls shows. The trend is clear: the Biden admin numbers are now clearly rising even as the impartial ADP (which directly logs employment numbers at the company level and is far more accurate), shows an accelerating slowdown.

But it's more than just the Biden admin hanging its "success" on seasonal adjustments: when one digs deeper inside the jobs report, all sorts of ugly things emerge... such as the growing unprecedented divergence between the Establishment (payrolls) survey and much more accurate Household (actual employment) survey. To wit, while in January the BLS claims 275K payrolls were added, the Household survey found that the number of actually employed workers dropped for the third straight month (and 4 in the past 5), this time by 184K (from 161.152K to 160.968K).

This means that while the Payrolls series hits new all time highs every month since December 2020 (when according to the BLS the US had its last month of payrolls losses), the level of Employment has not budged in the past year. Worse, as shown in the chart below, such a gaping divergence has opened between the two series in the past 4 years, that the number of Employed workers would need to soar by 9 million (!) to catch up to what Payrolls claims is the employment situation.

There's more: shifting from a quantitative to a qualitative assessment, reveals just how ugly the composition of "new jobs" has been. Consider this: the BLS reports that in February 2024, the US had 132.9 million full-time jobs and 27.9 million part-time jobs. Well, that's great... until you look back one year and find that in February 2023 the US had 133.2 million full-time jobs, or more than it does one year later! And yes, all the job growth since then has been in part-time jobs, which have increased by 921K since February 2023 (from 27.020 million to 27.941 million).

Here is a summary of the labor composition in the past year: all the new jobs have been part-time jobs!

But wait there's even more, because now that the primary season is over and we enter the heart of election season and political talking points will be thrown around left and right, especially in the context of the immigration crisis created intentionally by the Biden administration which is hoping to import millions of new Democratic voters (maybe the US can hold the presidential election in Honduras or Guatemala, after all it is their citizens that will be illegally casting the key votes in November), what we find is that in February, the number of native-born workers tumbled again, sliding by a massive 560K to just 129.807 million. Add to this the December data, and we get a near-record 2.4 million plunge in native-born workers in just the past 3 months (only the covid crash was worse)!

The offset? A record 1.2 million foreign-born (read immigrants, both legal and illegal but mostly illegal) workers added in February!

Said otherwise, not only has all job creation in the past 6 years has been exclusively for foreign-born workers...

... but there has been zero job-creation for native born workers since June 2018!

This is a huge issue - especially at a time of an illegal alien flood at the southwest border...

... and is about to become a huge political scandal, because once the inevitable recession finally hits, there will be millions of furious unemployed Americans demanding a more accurate explanation for what happened - i.e., the illegal immigration floodgates that were opened by the Biden admin.
Which is also why Biden's handlers will do everything in their power to insure there is no official recession before November... and why after the election is over, all economic hell will finally break loose. Until then, however, expect the jobs numbers to get even more ridiculous.


Wendy’s has a new deal for daylight savings time haters


Watch Live: President Biden Reminds Americans Just How Good They’ve Got It Thanks To Him


Racial and Ethnic Wealth Inequality in the Post‑Pandemic Era


Watch: President Biden Delivers The “Darkest, Most Un-American Speech Given By A President”


Wealth Inequality by Age in the Post‑Pandemic Era


Interest rates, the best it gets. It’s time to deploy cash


Is the biotech market rally real? Data suggest comeback in private, public markets


Mortgage rates fall as labor market normalizes


People Who Received Ivermectin Were Better Off, Study Finds


COVID-19 May Lead To Persistent Cognitive Impairment, Brain Fog, And Lower IQ Scores
-

 Uncategorized2 weeks ago
All Of The Elements Are In Place For An Economic Crisis Of Staggering Proportions
-

 Uncategorized1 month ago
Cathie Wood sells a major tech stock (again)
-

 Uncategorized3 weeks ago
California Counties Could Be Forced To Pay $300 Million To Cover COVID-Era Program
-

 Uncategorized2 weeks ago
Apparel Retailer Express Moving Toward Bankruptcy
-

 Uncategorized3 weeks ago
Industrial Production Decreased 0.1% in January
-

 International1 day ago
Walmart launches clever answer to Target’s new membership program
-

 Uncategorized3 weeks ago
RFK Jr: The Wuhan Cover-Up & The Rise Of The Biowarfare-Industrial Complex
-

 Uncategorized3 weeks ago
GOP Efforts To Shore Up Election Security In Swing States Face Challenges