The Coming “Reversion To The Mean” Of Economic Growth
The Coming "Reversion To The Mean" Of Economic Growth
Authored by Lance Roberts via RealInvestmentAdvice.com,
From stimulus boom to income thud, the coming “reversion to the mean” of economic growth is happening faster than economists…
Share this:


Authored by Lance Roberts via RealInvestmentAdvice.com,
From stimulus boom to income thud, the coming “reversion to the mean” of economic growth is happening faster than economists expected.
We previously noted that while many mainstream economists believed the current economic “boom” would persist, several factors suggested it wouldn’t.
The first problem is the math. As I previously discussed in “As Good As It Gets,“ the “second-derivative” of growth is now problematic. To wit:
“There is much at risk in the market as we head into the third quarter of 2021. For clarity, we need to review the “second-derivative” effect.
‘In calculus, the second derivative, or the second-order derivative, of a function f is the derivative of the derivative of f.” – Wikipedia’
In English, the ‘second derivative’ measures how the rate of change of a quantity is itself changing.
I know, still confusing.
Here is a simplistic example.
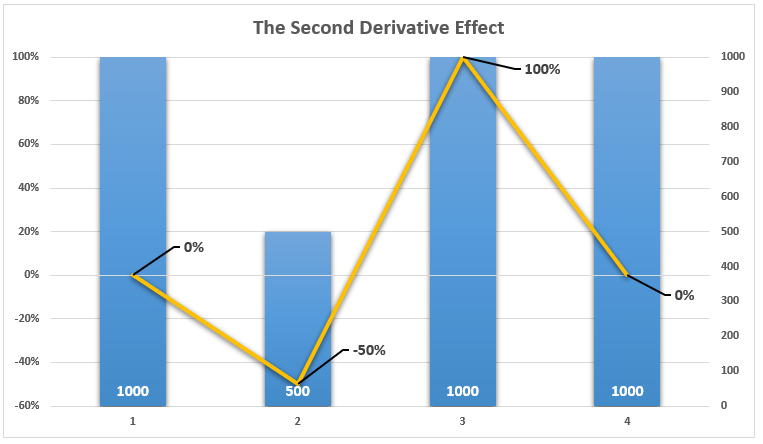
Assume the economy is $1000 in value in Year 1. Then, in Year 2, there is a 50% recession. However, in Year 3, the economy grows back to $1000. And, in Year 4, the economy remains at $1000.”
“The ‘second derivative’ effect is evident in years 3 and 4. In year 3, the economy recovers by $500, a 100% increase from Year 2’s level of $500. However, in Year 4, the growth rate falls to ‘ZERO’ as the economy remains at $1000.”
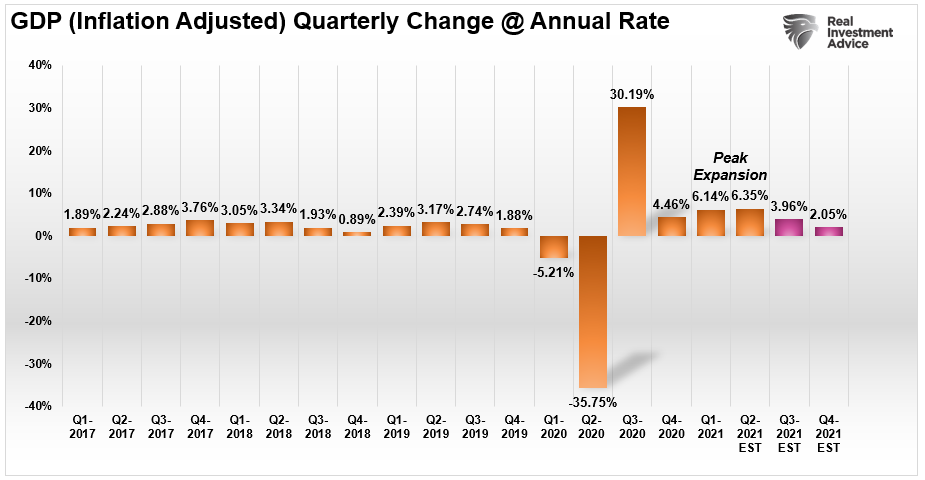
Why am I telling you this? Because we are at that point in the recovery cycle. Over the next few quarters, the year-over-year comparisons will become much more challenging. Q2-2021 will likely mark the peak of the economic recovery.
Confidence, Consumption & Economic Growth
In “Did The Fed’s Monetary Experiment Fail,”I discussed the importance of consumer confidence as it relates to the economy.
“Easier financial conditions will promote economic growth. For example, lower mortgage rates will make housing more affordable and allow more homeowners to refinance. Lower corporate bond rates will encourage investment. And higher stock prices will boost consumer wealth and help increase confidence, which can also spur spending.” – Bernanke
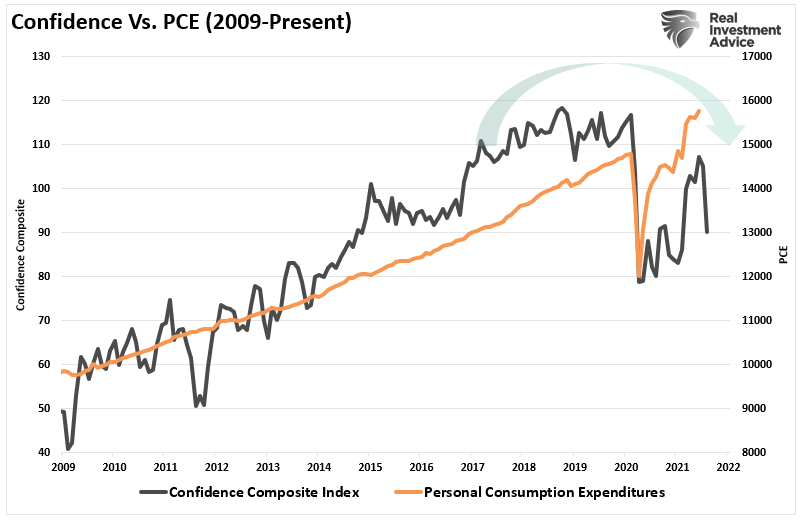
We must not overlook the importance of consumer confidence, given the significant contribution of personal consumption expenditures to economic growth.
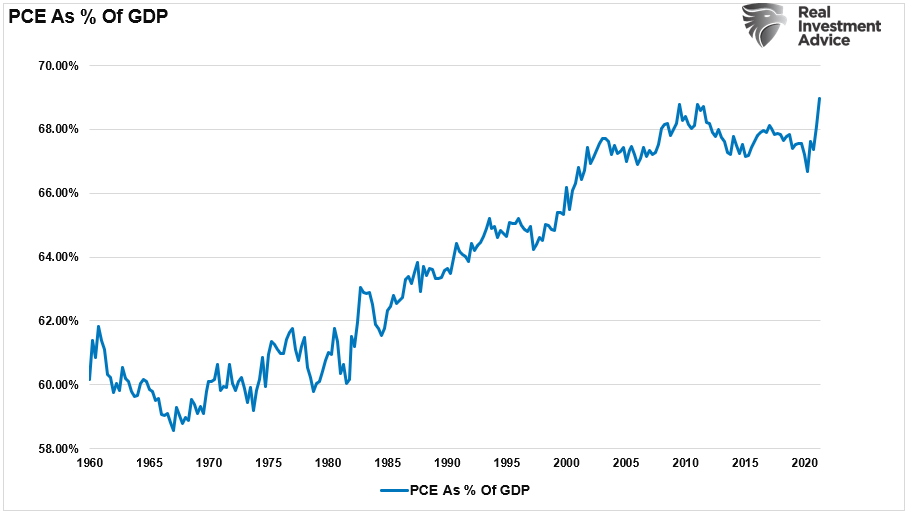
At nearly 70% of the GDP calculation, it is not surprising there is an exceedingly high correlation. The vertical spike at the end of the chart is most important. That spike was from the Government injecting 20% of GDP (roughly $5 Trillion) directly into the economy during the pandemic-driven shutdown. As we will discuss momentarily, the coming reversion will be problematic.
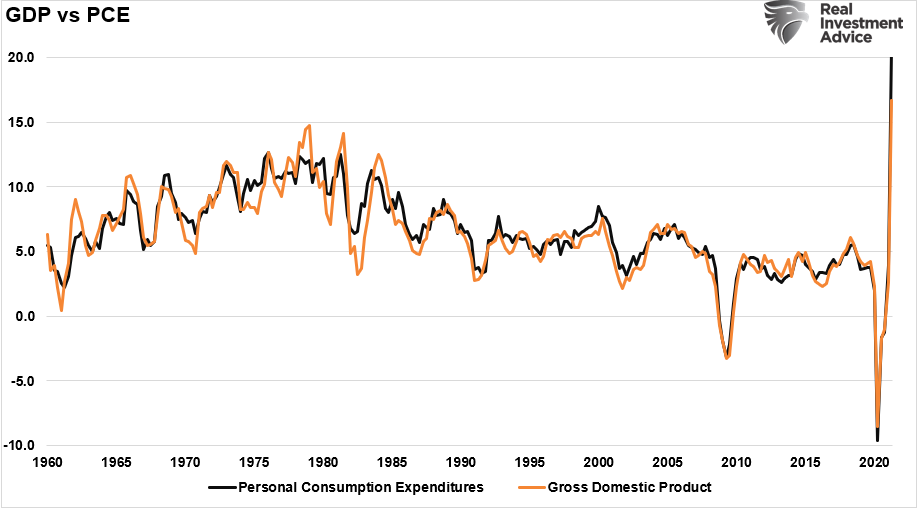
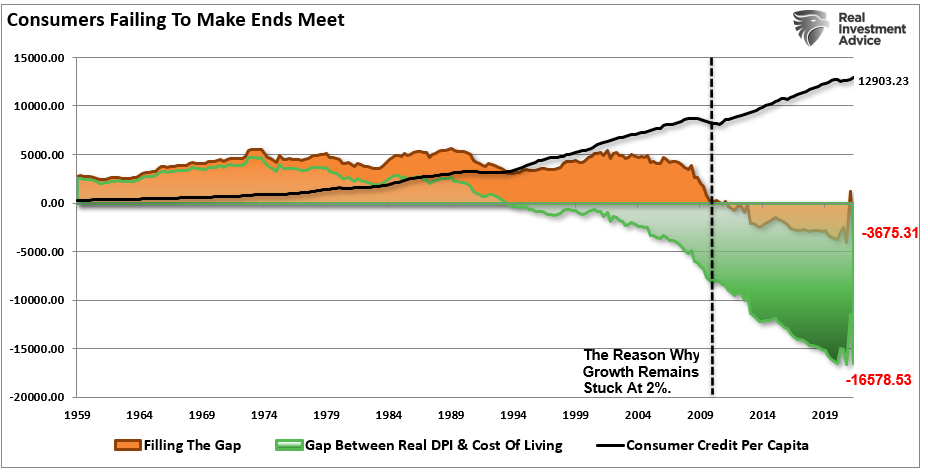
However, before we discuss the future, it is essential to note that since 1960, the expansion of consumption (PCE), and subsequently GDP, has come from a massive increase in household debt.

Given that wages haven’t risen fast enough over the last 20-years to compensate for increased living costs, the rise in household debt is not surprising. But, as noted, the increase in debt is not for the consumption of “more stuff,” instead, debt gets used to fill the gap between wages and living standards.
As noted, the linkage between confidence, consumption, and economic growth is critical. Thus, the recent plunge in consumer confidence as financial supports run out should not get dismissed lightly. Moreover, that breakdown of consumer confidence will likely show up in consumption in the future quarters and, ultimately, economic growth.
The Coming Reversion
Over the next several quarters, the real risk is a slowdown in consumption due to the lack of financial supports, stagnant wage growth, and high levels of underemployment.
However, it is also just a “math problem.” As noted above, the second-derivative of economic growth will have a more considerable impact in the future. Such is the problem of a larger economy due to the monetary injections. The chart below projects the annualized rate of economic growth through 2022. The polynomial trend line gets calculated using only current economic data. As you note, and not surprisingly, the two will intersect during the mean reversion.
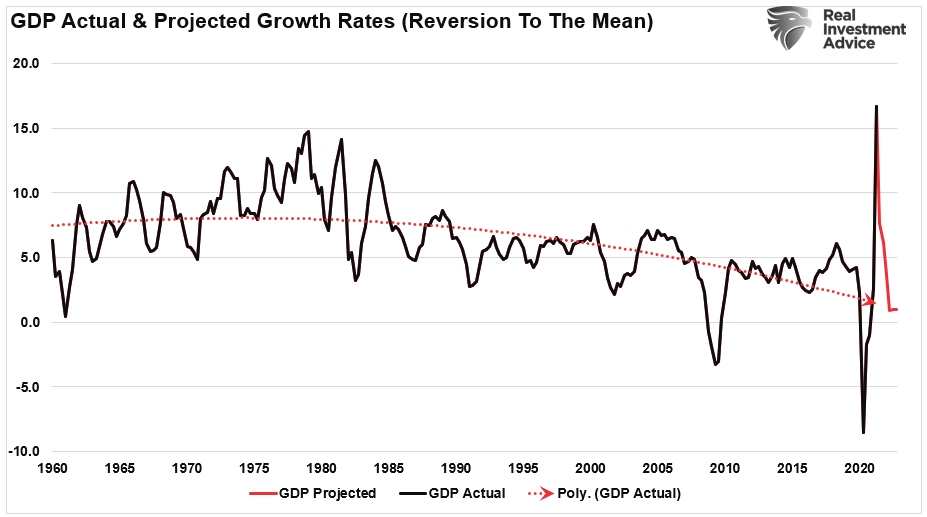
While the “speed” of the reversion can get debated, the eventuality is just a function of math. As the economy grows, the annual growth rate will decline. The intersection of the economy to the polynomial trend will occur, aligning with the Fed’s own long-term economic growth projections.
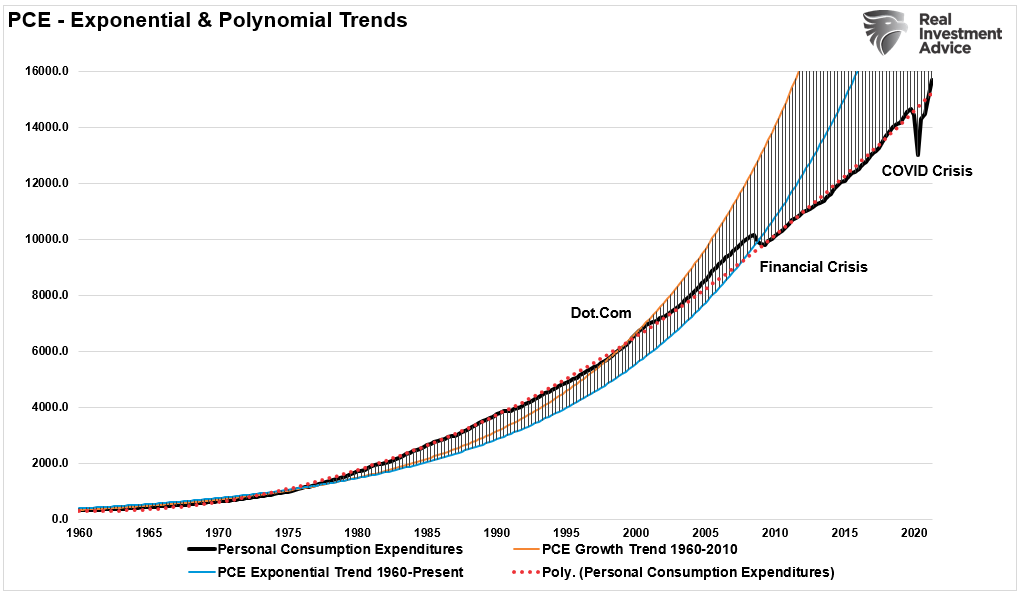
As you will note, economic growth rates peaked in 1980 and continued a steady trend lower. Again, such is a function of stagnant wage growth and rising debt levels. Importantly, given the importance of PCE on growth, the rate of consumption continues to set lower trend growth levels after each major recession. As shown, PCE slowed after the “Dot.com” crash, the “Financial Crisis,” and likely will set a new lower trend level next year.
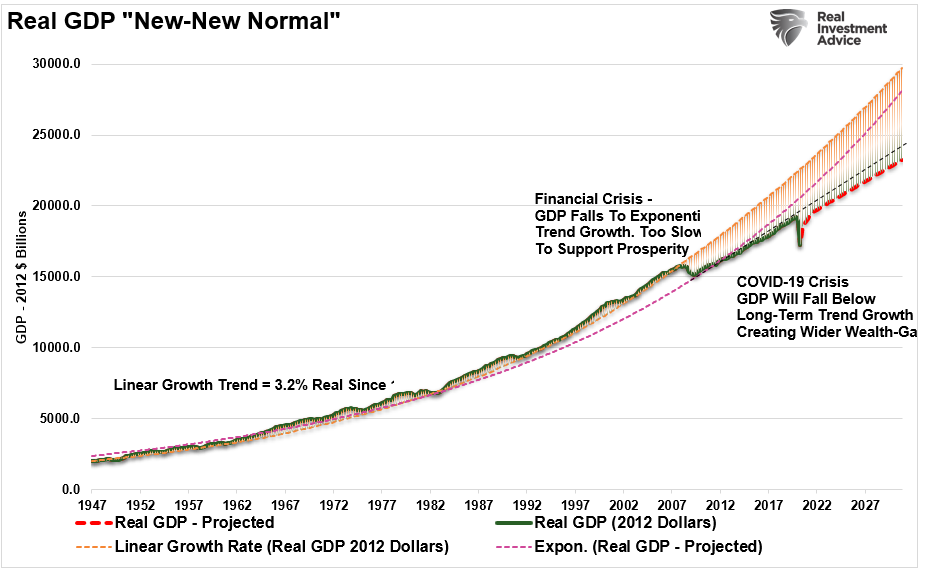
The “New New Normal”
After the “Financial Crisis,” the media buzzword became the “New Normal” for what the post-crisis economy would like. It was a period of slower economic growth, weaker wages, and a decade of monetary interventions to keep the economy from slipping back into a recession.
Post the “Covid Crisis,” we will begin to discuss the “New New Normal” of continued stagnant wage growth, a weaker economy, and an ever-widening wealth gap. Social unrest is a direct byproduct of this “New New Normal,” as injustices between the rich and poor become ever more evident.
If we are correct in assuming that PCE will revert to the mean as stimulus fades from the economy, then the “New New Normal” of economic growth will be a new lower trend that fails to create widespread prosperity.
Of course, none of this is a surprise.
It has been in process for the last 30-years. Yet, mainstream economists still fail to recognize the consequences of rising debt levels and the failure of socialistic policies.
For them, the answer to slower growth has been more debt. When more debt failed to spur growth, the answer was we didn’t go into debt far enough.
Well, in 2020, the country expanded its debt massively. The Fed and Government flooded the economy with liquidity to prevent the recession from doing its much-needed job of cleansing excesses from the system.
If more debt doesn’t create growth this time, we have only ourselves and the economists to blame.
Spread & Containment
There Goes The Fed’s Inflation Target: Goldman Sees Terminal Rate 100bps Higher At 3.5%
There Goes The Fed’s Inflation Target: Goldman Sees Terminal Rate 100bps Higher At 3.5%
Two years ago, we first said that it’s only a matter…
Share this:

Two years ago, we first said that it's only a matter of time before the Fed admits it is unable to rsolve the so-called "last mile" of inflation and that as a result, the old inflation target of 2% is no longer viable.
At some point Fed will concede it has no control over supply. That's when we will start getting leaks of raising the inflation target
— zerohedge (@zerohedge) June 21, 2022
Then one year ago, we correctly said that while everyone was paying attention elsewhere, the inflation target had already been hiked to 2.8%... on the way to even more increases.
The new inflation target has been set to 2.8%. The rest is just narrative fill for the next 2 years. https://t.co/X1xYkecyPy
— zerohedge (@zerohedge) February 21, 2023
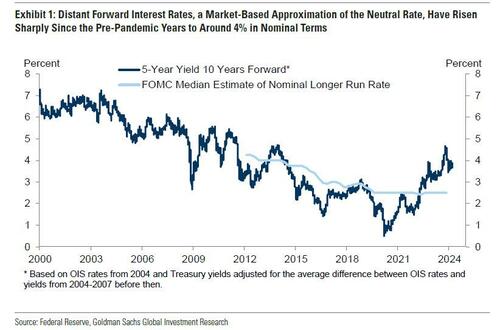
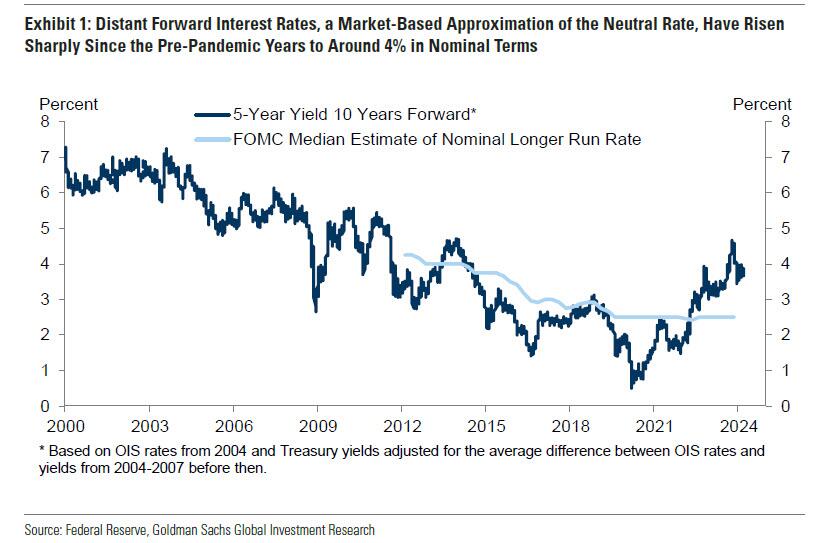
And while the Fed still pretends it can one day lower inflation to 2% even as it prepares to cut rates as soon as June, moments ago Goldman published a note from its economics team which had to balls to finally call a spade a spade, and concluded that - as party of the Fed's next big debate, i.e., rethinking the Neutral rate - both the neutral and terminal rate, a polite euphemism for the inflation target, are much higher than conventional wisdom believes, and that as a result Goldman is "penciling in a terminal rate of 3.25-3.5% this cycle, 100bp above the peak reached last cycle."
There is more in the full Goldman note, but below we excerpt the key fragments:
We argued last cycle that the long-run neutral rate was not as low as widely thought, perhaps closer to 3-3.5% in nominal terms than to 2-2.5%. We have also argued this cycle that the short-run neutral rate could be higher still because the fiscal deficit is much larger than usual—in fact, estimates of the elasticity of the neutral rate to the deficit suggest that the wider deficit might boost the short-term neutral rate by 1-1.5%. Fed economists have also offered another reason why the short-term neutral rate might be elevated, namely that broad financial conditions have not tightened commensurately with the rise in the funds rate, limiting transmission to the economy.
Over the coming year, Fed officials are likely to debate whether the neutral rate is still as low as they assumed last cycle and as the dot plot implies....
...Translation: raising the neutral rate estimate is also the first step to admitting that the traditional 2% inflation target is higher than previously expected. And once the Fed officially crosses that particular Rubicon, all bets are off.
... Their thinking is likely to be influenced by distant forward market rates, which have risen 1-2pp since the pre-pandemic years to about 4%; by model-based estimates of neutral, whose earlier real-time values have been revised up by roughly 0.5pp on average to about 3.5% nominal and whose latest values are little changed; and by their perception of how well the economy is performing at the current level of the funds rate.
The bank's conclusion:
We expect Fed officials to raise their estimates of neutral over time both by raising their long-run neutral rate dots somewhat and by concluding that short-run neutral is currently higher than long-run neutral. While we are fairly confident that Fed officials will not be comfortable leaving the funds rate above 5% indefinitely once inflation approaches 2% and that they will not go all the way back to 2.5% purely in the name of normalization, we are quite uncertain about where in between they will ultimately land.
Because the economy is not sensitive enough to small changes in the funds rate to make it glaringly obvious when neutral has been reached, the terminal or equilibrium rate where the FOMC decides to leave the funds rate is partly a matter of the true neutral rate and partly a matter of the perceived neutral rate. For now, we are penciling in a terminal rate of 3.25-3.5% this cycle, 100bps above the peak reached last cycle. This reflects both our view that neutral is higher than Fed officials think and our expectation that their thinking will evolve.
Not that this should come as a surprise: as a reminder, with the US now $35.5 trillion in debt and rising by $1 trillion every 100 days, we are fast approaching the Minsky Moment, which means the US has just a handful of options left: losing the reserve currency status, QEing the deficit and every new dollar in debt, or - the only viable alternative - inflating it all away. The only question we had before is when do "serious" economists make the same admission.
Meanwhile, nothing changes: total US debt jumps $57BN on March 15, to a record $34.543 trillion.
— zerohedge (@zerohedge) March 19, 2024
Three ways this ends: inflate it away, QE it all, or reserve status collapse
They now have.
And while we have discussed the staggering consequences of raising the inflation target by just 1% from 2% to 3% on everything from markets, to economic growth (instead of doubling every 35 years at 2% inflation target, prices would double every 23 years at 3%), and social cohesion, we will soon rerun the analysis again as the implications are profound. For now all you need to know is that with the US about to implicitly hit the overdrive of dollar devaluation, anything that is non-fiat will be much more preferable over fiat alternatives.
Much more in the full Goldman note available to pro subs in the usual place.
Spread & Containment
Household Net Interest Income Falls As Rates Spike
A Bloomberg article from this morning offered an excellent array of charts detailing the shifts in interest payment flows amid rising rates. The historical…
Share this:

A Bloomberg article from this morning offered an excellent array of charts detailing the shifts in interest payment flows amid rising rates. The historical anomaly was both surprising and contradicted our priors.
10 Key Points:
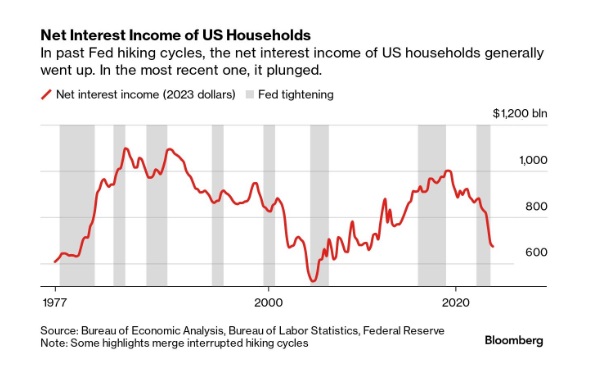
- Historical Anomaly: This is the first time in the last fifty years that a Federal Reserve rate hike cycle has led to a significant drop in household net interest income.
- Interest Expense Increase: Since the Fed began raising rates in March 2022, Americans’ annual interest expenses on debts like mortgages and credit cards have surged by nearly $420 billion.
- Interest Income Lag: The increase in interest income during the same period was only about $280 billion, resulting in a net decline in household interest income, a departure from past trends.
- Consumer Debt Influence: The recent rate hikes impacted household finances more because of a higher proportion of consumer credit, which adjusts more quickly to rate changes, increasing interest costs.
- Banks and Savers: Banks have been slow to pass on higher interest rates to depositors, and the prolonged period of low rates before 2022 may have discouraged savers from actively seeking better returns.
- Shift in Wealth: There’s been a shift from interest-bearing assets to stocks, with dividends surpassing interest payments as a source of unearned income during the pandemic.
- Distributional Discrepancy: Higher interest rates benefit wealthier individuals who own interest-earning assets, whereas lower-income earners face the brunt of increased debt servicing costs, exacerbating economic inequality.
- Job Market Impact: Typically, Fed rate hikes affect households through the job market, as businesses cut costs, potentially leading to layoffs or wage suppression, though this hasn’t occurred yet in the current cycle.
- Economic Impact: The distribution of interest income and debt servicing means that rate increases transfer money from those more likely to spend (and thus stimulate the economy) to those less likely to increase consumption, potentially dampening economic activity.
- No Immediate Relief: Expectations for the Fed to reduce rates have diminished, indicating that high-interest expenses for households may persist.


Uncategorized
One more airline cracks down on lounge crowding in a way you won’t like
Qantas Airways is increasing the price of accessing its network of lounges by as much as 17%.
Share this:


Over the last two years, multiple airlines have dealt with crowding in their lounges. While they are designed as a luxury experience for a small subset of travelers, high numbers of people taking a trip post-pandemic as well as the different ways they are able to gain access through status or certain credit cards made it difficult for some airlines to keep up with keeping foods stocked, common areas clean and having enough staff to serve bar drinks at the rate that customers expect them.
In the fall of 2023, Delta Air Lines (DAL) caught serious traveler outcry after announcing that it was cracking down on crowding by raising how much one needs to spend for lounge access and limiting the number of times one can enter those lounges.
Related: Competitors pushed Delta to backtrack on its lounge and loyalty program changes
Some airlines saw the outcry with Delta as their chance to reassure customers that they would not raise their fees while others waited for the storm to pass to quietly implement their own increases.
Shutterstock
This is how much more you'll have to pay for Qantas lounge access
Australia's flagship carrier Qantas Airways (QUBSF) is the latest airline to announce that it would raise the cost accessing the 24 lounges across the country as well as the 600 international lounges available at airports across the world through partner airlines.
More Travel:
- A new travel term is taking over the internet (and reaching airlines and hotels)
- The 10 best airline stocks to buy now
- Airlines see a new kind of traveler at the front of the plane
Unlike other airlines which grant access primarily after reaching frequent flyer status, Qantas also sells it through a membership — starting from April 18, 2024, prices will rise from $600 Australian dollars ($392 USD) to $699 AUD ($456 USD) for one year, $1,100 ($718 USD) to $1,299 ($848 USD) for two years and $2,000 AUD ($1,304) to lock in the rate for four years.
Those signing up for lounge access for the first time also currently pay a joining fee of $99 AUD ($65 USD) that will rise to $129 AUD ($85 USD).
The airline also allows customers to purchase their membership with Qantas Points they collect through frequent travel; the membership fees are also being raised by the equivalent amount in points in what adds up to as much as 17% — from 308,000 to 399,900 to lock in access for four years.
Airline says hikes will 'cover cost increases passed on from suppliers'
"This is the first time the Qantas Club membership fees have increased in seven years and will help cover cost increases passed on from a range of suppliers over that time," a Qantas spokesperson confirmed to Simple Flying. "This follows a reduction in the membership fees for several years during the pandemic."
The spokesperson said the gains from the increases will go both towards making up for inflation-related costs and keeping existing lounges looking modern by updating features like furniture and décor.
While the price increases also do not apply for those who earned lounge access through frequent flyer status or change what it takes to earn that status, Qantas is also introducing even steeper increases for those renewing a membership or adding additional features such as spouse and partner memberships.
In some cases, the cost of these features will nearly double from what members are paying now.
stocks pandemic

Google’s A.I. Fiasco Exposes Deeper Infowarp


Home buyers must now navigate higher mortgage rates and prices


Greenback Surges after BOJ Hikes and Ends YCC and RBA Delivers a Dovish Hold


Supreme Court Rules Public Officials May Block Their Constituents On Social Media


Manufacturing and construction vs. the still-inverted yield curve


Student loan borrowers may finally get answers to loan forgiveness issues


When words make you sick


You can strike gold and silver investment opportunities at Costco


Bolsonaro Indicted By Brazilian Police For Falsifying Covid-19 Vaccine Records


Germany Is Running Out Of Money And Debt Levels Are Exploding, Finance Minister Warns
-

 Spread & Containment7 days ago
IFM’s Hat Trick and Reflections On Option-To-Buy M&A
-

 Uncategorized4 weeks ago
All Of The Elements Are In Place For An Economic Crisis Of Staggering Proportions
-

 International2 weeks ago
EyePoint poaches medical chief from Apellis; Sandoz CFO, longtime BioNTech exec to retire
-

 Uncategorized1 month ago
California Counties Could Be Forced To Pay $300 Million To Cover COVID-Era Program
-

 Uncategorized4 weeks ago
Apparel Retailer Express Moving Toward Bankruptcy
-

 Uncategorized1 month ago
Industrial Production Decreased 0.1% in January
-

 International2 weeks ago
Walmart launches clever answer to Target’s new membership program
-

 Uncategorized1 month ago
RFK Jr: The Wuhan Cover-Up & The Rise Of The Biowarfare-Industrial Complex