International
The Average Wall Street Bonus Fell by an Obscene Amount in 2022
Wall Street’s 2022 bonus payout is a 26% drop from the year before.
Share this:

Wall Street's 2022 bonus payout is a 26% drop from the year before.
As companies and government institutions tightened their belts amid a challenging economy, many people across the income spectrum saw their finances take a plunge. The Bureau of Labor Statistics calculated that average hourly earnings were down 3.6% year-over-year in the summer.
Corporate profits also fell by 2% in the last quarter of 2022, the biggest decline observed in the last two years.
DON'T MISS: How Young Adults Should Prepare For a Recession
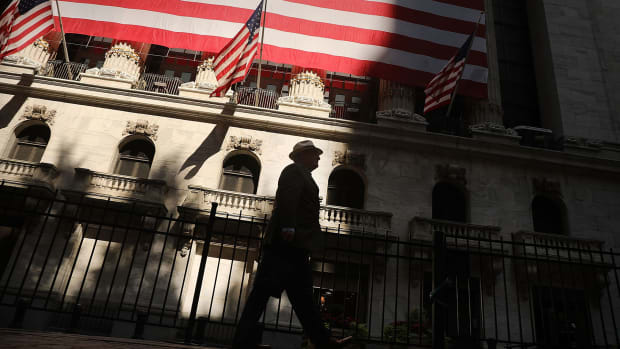
High-earning traders were also not immune to a drop to their total income in 2022. According to a new report released by New York State's comptroller's office, the average Wall Street bonus sat at $176,000.
Spencer Platt/Getty Images
Money Going To Wall Street Bonuses Hasn't Been This Low Since 2008
While this number may appear exorbitantly high to the average earner, it actually represents a 26% decline from 2021 and the biggest drop in the total paid out since 2008 -- $33.7 billion in 2021 compared to $42.7 billion in 2022.
Dropping Wall Street profits was one factor in the lower payouts but the number is also a correction from record-high numbers seen in the two years following the outbreak of covid-19.
In 2021, the average bonus paid out totaled $240,000. This was a 20% increase from 2020 and the highest number on record.
"Wall Street's cash bonuses were expected to fall as several factors weighed on the securities' industry profitability in 2022," New York State Comptroller Thomas P. DiNapoli said in a statement. "A 26% decline brings the average bonus closer to what financial employees received prior to the pandemic."
The comptroller's report looks solely at bonuses rather than salary, stocks and other compensation. The average Wall Street base salary was, in 2022, $516,560.
Wall Street bonuses are heavily dependent on the state of the economy and profits brought in by investment firms. Amid the war in Ukraine and the Federal Reserve's interest-rate hikes, Wall Street's profits fell by 56% between 2021 and 2022.
The entire industry has 5.1% fewer jobs than it did in 2000 but, according to the comptroller's office, one in 11 jobs in New York City is "either directly or indirectly associated with [...] securities."
'Our Economic Recovery Does Not Depend Solely On Wall Street'
The report also says that taxes from the securities industry brought in $22.9 billion in state taxes last year. This is 22% of the state's total taxes. The city of New York, meanwhile, brought in $5.4 billion or 8% of total city tax collections.
"While lower bonuses affect income tax revenues for the state and city, our economic recovery does not depend solely on Wall Street," DiNapoli said. "Employment in leisure and hospitality, retail, restaurants and construction must continue to improve for the city and state to fully recover."
Though the numbers reflect only 2022, 2023 is so far shaping out to be just as challenging a year -- by the end of the first quarter, the banking world was thrown into disarray amid SVB's and Signature Bank's collapse as well as UBS (UBS) - Get Free Report's acquisition of Credit Suisse.
"Wall Street was responsible for 16% of all economic activity in the city in 2021, and thus the financial sector’s ability to generate revenue and turn profit is critically important to New York," the comptroller's office writes.
recession pandemic covid-19 economic recovery stocks federal reserve recovery ukraineInternational
United Airlines adds new flights to faraway destinations
The airline said that it has been working hard to "find hidden gem destinations."
Share this:


Since countries started opening up after the pandemic in 2021 and 2022, airlines have been seeing demand soar not just for major global cities and popular routes but also for farther-away destinations.
Numerous reports, including a recent TripAdvisor survey of trending destinations, showed that there has been a rise in U.S. traveler interest in Asian countries such as Japan, South Korea and Vietnam as well as growing tourism traction in off-the-beaten-path European countries such as Slovenia, Estonia and Montenegro.
Related: 'No more flying for you': Travel agency sounds alarm over risk of 'carbon passports'
As a result, airlines have been looking at their networks to include more faraway destinations as well as smaller cities that are growing increasingly popular with tourists and may not be served by their competitors.
Shutterstock
United brings back more routes, says it is committed to 'finding hidden gems'
This week, United Airlines (UAL) announced that it will be launching a new route from Newark Liberty International Airport (EWR) to Morocco's Marrakesh. While it is only the country's fourth-largest city, Marrakesh is a particularly popular place for tourists to seek out the sights and experiences that many associate with the country — colorful souks, gardens with ornate architecture and mosques from the Moorish period.
More Travel:
- A new travel term is taking over the internet (and reaching airlines and hotels)
- The 10 best airline stocks to buy now
- Airlines see a new kind of traveler at the front of the plane
"We have consistently been ahead of the curve in finding hidden gem destinations for our customers to explore and remain committed to providing the most unique slate of travel options for their adventures abroad," United's SVP of Global Network Planning Patrick Quayle, said in a press statement.
The new route will launch on Oct. 24 and take place three times a week on a Boeing 767-300ER (BA) plane that is equipped with 46 Polaris business class and 22 Premium Plus seats. The plane choice was a way to reach a luxury customer customer looking to start their holiday in Marrakesh in the plane.
Along with the new Morocco route, United is also launching a flight between Houston (IAH) and Colombia's Medellín on Oct. 27 as well as a route between Tokyo and Cebu in the Philippines on July 31 — the latter is known as a "fifth freedom" flight in which the airline flies to the larger hub from the mainland U.S. and then goes on to smaller Asian city popular with tourists after some travelers get off (and others get on) in Tokyo.
United's network expansion includes new 'fifth freedom' flight
In the fall of 2023, United became the first U.S. airline to fly to the Philippines with a new Manila-San Francisco flight. It has expanded its service to Asia from different U.S. cities earlier last year. Cebu has been on its radar amid growing tourist interest in the region known for marine parks, rainforests and Spanish-style architecture.
With the summer coming up, United also announced that it plans to run its current flights to Hong Kong, Seoul, and Portugal's Porto more frequently at different points of the week and reach four weekly flights between Los Angeles and Shanghai by August 29.
"This is your normal, exciting network planning team back in action," Quayle told travel website The Points Guy of the airline's plans for the new routes.
stocks pandemic south korea japan hong kong europeanInternational
Walmart launches clever answer to Target’s new membership program
The retail superstore is adding a new feature to its Walmart+ plan — and customers will be happy.
Share this:


It's just been a few days since Target (TGT) launched its new Target Circle 360 paid membership plan.
The plan offers free and fast shipping on many products to customers, initially for $49 a year and then $99 after the initial promotional signup period. It promises to be a success, since many Target customers are loyal to the brand and will go out of their way to shop at one instead of at its two larger peers, Walmart and Amazon.
Related: Walmart makes a major price cut that will delight customers
And stop us if this sounds familiar: Target will rely on its more than 2,000 stores to act as fulfillment hubs.
This model is a proven winner; Walmart also uses its more than 4,600 stores as fulfillment and shipping locations to get orders to customers as soon as possible.
Sometimes, this means shipping goods from the nearest warehouse. But if a desired product is in-store and closer to a customer, it reduces miles on the road and delivery time. It's a kind of logistical magic that makes any efficiency lover's (or retail nerd's) heart go pitter patter.
Walmart rolls out answer to Target's new membership tier
Walmart has certainly had more time than Target to develop and work out the kinks in Walmart+. It first launched the paid membership in 2020 during the height of the pandemic, when many shoppers sheltered at home but still required many staples they might ordinarily pick up at a Walmart, like cleaning supplies, personal-care products, pantry goods and, of course, toilet paper.
It also undercut Amazon (AMZN) Prime, which costs customers $139 a year for free and fast shipping (plus several other benefits including access to its streaming service, Amazon Prime Video).
Walmart+ costs $98 a year, which also gets you free and speedy delivery, plus access to a Paramount+ streaming subscription, fuel savings, and more.
If that's not enough to tempt you, however, Walmart+ just added a new benefit to its membership program, ostensibly to compete directly with something Target now has: ultrafast delivery.
Target Circle 360 particularly attracts customers with free same-day delivery for select orders over $35 and as little as one-hour delivery on select items. Target executes this through its Shipt subsidiary.
We've seen this lightning-fast delivery speed only in snippets from Amazon, the king of delivery efficiency. Who better to take on Target, though, than Walmart, which is using a similar store-as-fulfillment-center model?
"Walmart is stepping up to save our customers even more time with our latest delivery offering: Express On-Demand Early Morning Delivery," Walmart said in a statement, just a day after Target Circle 360 launched. "Starting at 6 a.m., earlier than ever before, customers can enjoy the convenience of On-Demand delivery."
Walmart (WMT) clearly sees consumers' desire for near-instant delivery, which obviously saves time and trips to the store. Rather than waiting a day for your order to show up, it might be on your doorstep when you wake up.
Consumers also tend to spend more money when they shop online, and they remain stickier as paying annual members. So, to a growing number of retail giants, almost instant gratification like this seems like something worth striving for.
Related: Veteran fund manager picks favorite stocks for 2024
stocks pandemic mexicoGovernment
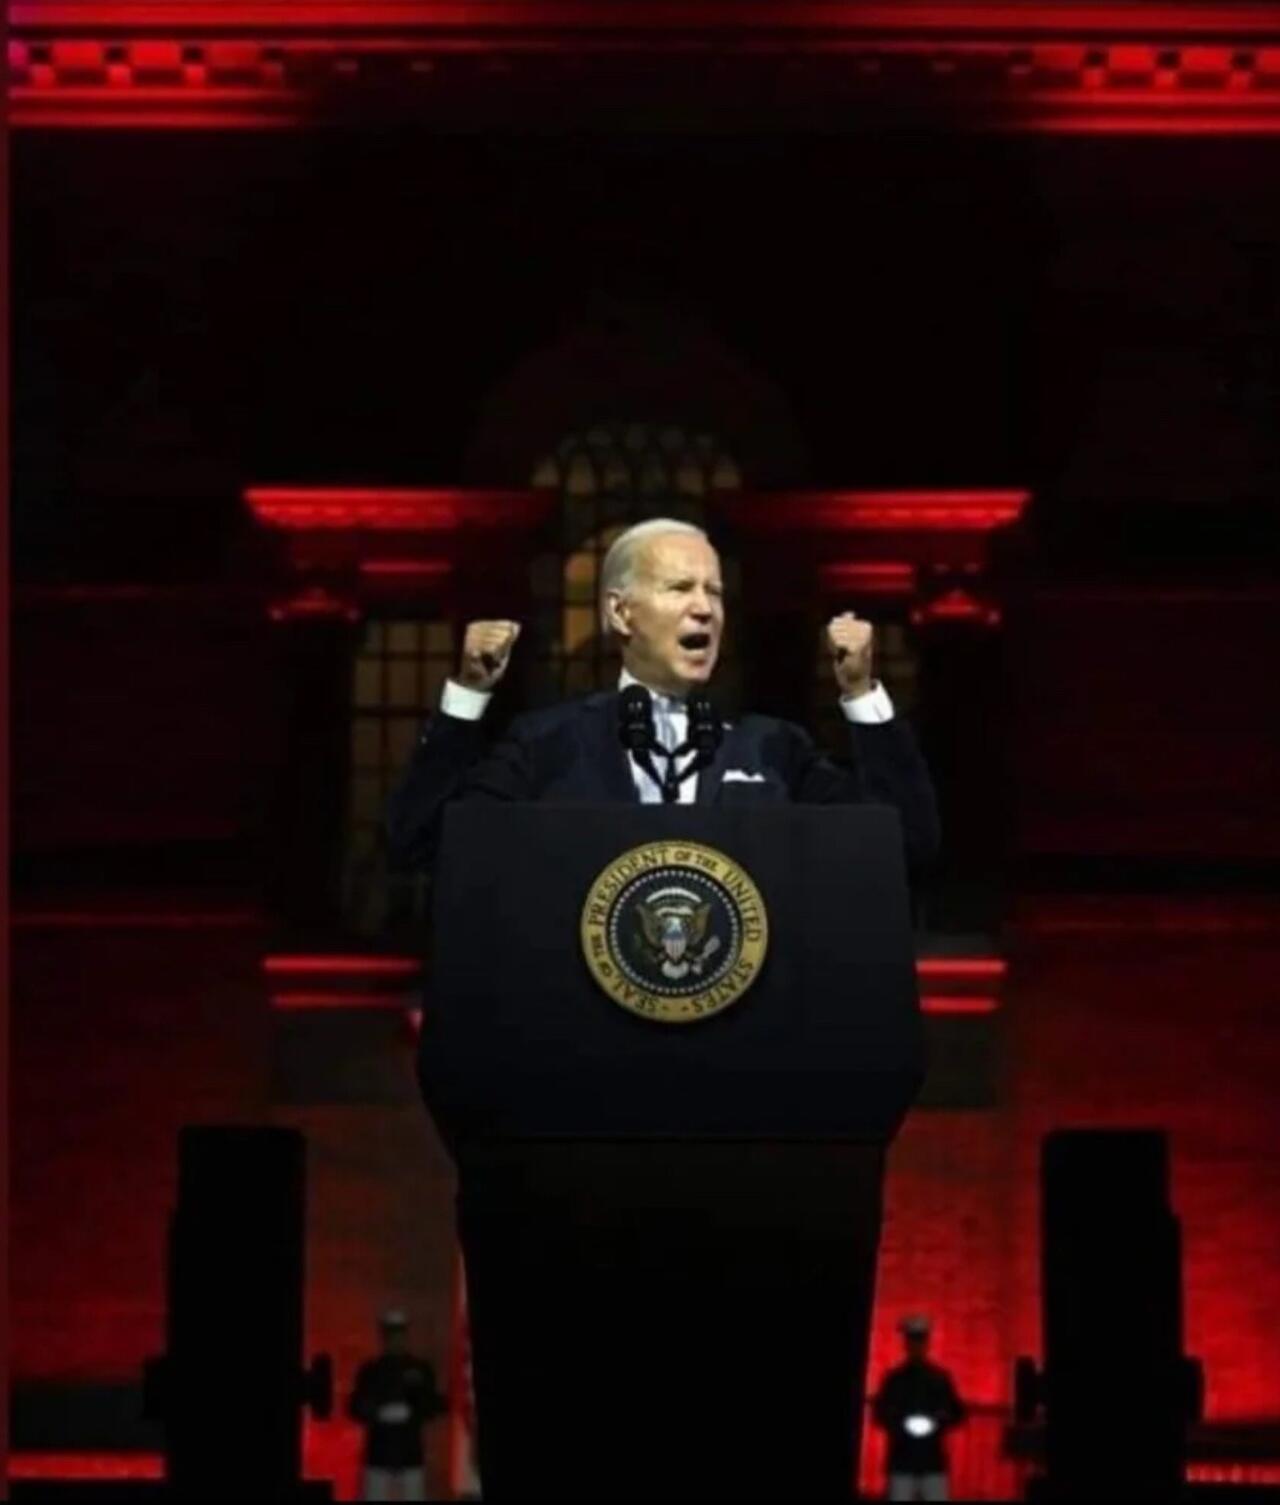
President Biden Delivers The “Darkest, Most Un-American Speech Given By A President”
President Biden Delivers The "Darkest, Most Un-American Speech Given By A President"
Having successfully raged, ranted, lied, and yelled through…
Share this:

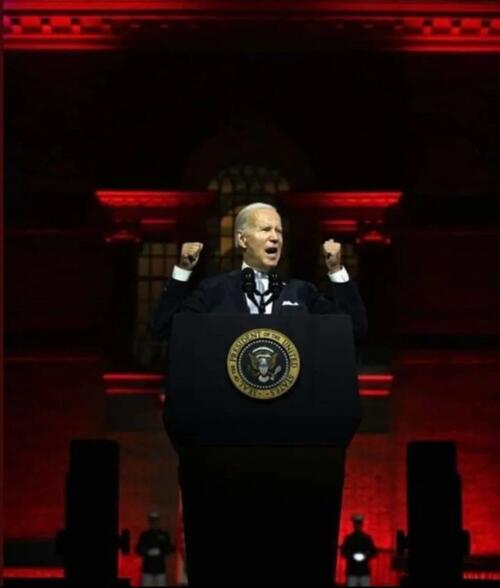
Having successfully raged, ranted, lied, and yelled through the State of The Union, President Biden can go back to his crypt now.
Whatever 'they' gave Biden, every American man, woman, and the other should be allowed to take it - though it seems the cocktail brings out 'dark Brandon'?
Tl;dw: Biden's Speech tonight ...
-
Fund Ukraine.
-
Trump is threat to democracy and America itself.
-
Abortion is good.
-
American Economy is stronger than ever.
-
Inflation wasn't Biden's fault.
-
Illegals are Americans too.
-
Republicans are responsible for the border crisis.
-
Trump is bad.
-
Biden stands with trans-children.
-
J6 was the worst insurrection since the Civil War.
(h/t @TCDMS99)
Tucker Carlson's response sums it all up perfectly:
"that was possibly the darkest, most un-American speech given by an American president. It wasn't a speech, it was a rant..."
Carlson continued: "The true measure of a nation's greatness lies within its capacity to control borders, yet Bid refuses to do it."
"In a fair election, Joe Biden cannot win"
And concluded:
“There was not a meaningful word for the entire duration about the things that actually matter to people who live here.”
Victor Davis Hanson added some excellent color, but this was probably the best line on Biden:
"he doesn't care... he lives in an alternative reality."
— Tucker Carlson (@TuckerCarlson) March 8, 2024
* * *
Watch SOTU Live here...
* * *
Mises' Connor O'Keeffe, warns: "Be on the Lookout for These Lies in Biden's State of the Union Address."
On Thursday evening, President Joe Biden is set to give his third State of the Union address. The political press has been buzzing with speculation over what the president will say. That speculation, however, is focused more on how Biden will perform, and which issues he will prioritize. Much of the speech is expected to be familiar.
The story Biden will tell about what he has done as president and where the country finds itself as a result will be the same dishonest story he's been telling since at least the summer.
He'll cite government statistics to say the economy is growing, unemployment is low, and inflation is down.
Something that has been frustrating Biden, his team, and his allies in the media is that the American people do not feel as economically well off as the official data says they are. Despite what the White House and establishment-friendly journalists say, the problem lies with the data, not the American people's ability to perceive their own well-being.
As I wrote back in January, the reason for the discrepancy is the lack of distinction made between private economic activity and government spending in the most frequently cited economic indicators. There is an important difference between the two:
-
Government, unlike any other entity in the economy, can simply take money and resources from others to spend on things and hire people. Whether or not the spending brings people value is irrelevant
-
It's the private sector that's responsible for producing goods and services that actually meet people's needs and wants. So, the private components of the economy have the most significant effect on people's economic well-being.
Recently, government spending and hiring has accounted for a larger than normal share of both economic activity and employment. This means the government is propping up these traditional measures, making the economy appear better than it actually is. Also, many of the jobs Biden and his allies take credit for creating will quickly go away once it becomes clear that consumers don't actually want whatever the government encouraged these companies to produce.
On top of all that, the administration is dealing with the consequences of their chosen inflation rhetoric.
Since its peak in the summer of 2022, the president's team has talked about inflation "coming back down," which can easily give the impression that it's prices that will eventually come back down.
But that's not what that phrase means. It would be more honest to say that price increases are slowing down.
Americans are finally waking up to the fact that the cost of living will not return to prepandemic levels, and they're not happy about it.
The president has made some clumsy attempts at damage control, such as a Super Bowl Sunday video attacking food companies for "shrinkflation"—selling smaller portions at the same price instead of simply raising prices.
In his speech Thursday, Biden is expected to play up his desire to crack down on the "corporate greed" he's blaming for high prices.
In the name of "bringing down costs for Americans," the administration wants to implement targeted price ceilings - something anyone who has taken even a single economics class could tell you does more harm than good. Biden would never place the blame for the dramatic price increases we've experienced during his term where it actually belongs—on all the government spending that he and President Donald Trump oversaw during the pandemic, funded by the creation of $6 trillion out of thin air - because that kind of spending is precisely what he hopes to kick back up in a second term.
If reelected, the president wants to "revive" parts of his so-called Build Back Better agenda, which he tried and failed to pass in his first year. That would bring a significant expansion of domestic spending. And Biden remains committed to the idea that Americans must be forced to continue funding the war in Ukraine. That's another topic Biden is expected to highlight in the State of the Union, likely accompanied by the lie that Ukraine spending is good for the American economy. It isn't.
It's not possible to predict all the ways President Biden will exaggerate, mislead, and outright lie in his speech on Thursday. But we can be sure of two things. The "state of the Union" is not as strong as Biden will say it is. And his policy ambitions risk making it much worse.
* * *
The American people will be tuning in on their smartphones, laptops, and televisions on Thursday evening to see if 'sloppy joe' 81-year-old President Joe Biden can coherently put together more than two sentences (even with a teleprompter) as he gives his third State of the Union in front of a divided Congress.
President Biden will speak on various topics to convince voters why he shouldn't be sent to a retirement home.
The state of our union under President Biden: three years of decline. pic.twitter.com/Da1KOIb3eR
— Speaker Mike Johnson (@SpeakerJohnson) March 7, 2024
According to CNN sources, here are some of the topics Biden will discuss tonight:
Economic issues: Biden and his team have been drafting a speech heavy on economic populism, aides said, with calls for higher taxes on corporations and the wealthy – an attempt to draw a sharp contrast with Republicans and their likely presidential nominee, Donald Trump.
Health care expenses: Biden will also push for lowering health care costs and discuss his efforts to go after drug manufacturers to lower the cost of prescription medications — all issues his advisers believe can help buoy what have been sagging economic approval ratings.
Israel's war with Hamas: Also looming large over Biden's primetime address is the ongoing Israel-Hamas war, which has consumed much of the president's time and attention over the past few months. The president's top national security advisers have been working around the clock to try to finalize a ceasefire-hostages release deal by Ramadan, the Muslim holy month that begins next week.
An argument for reelection: Aides view Thursday's speech as a critical opportunity for the president to tout his accomplishments in office and lay out his plans for another four years in the nation's top job. Even though viewership has declined over the years, the yearly speech reliably draws tens of millions of households.
Sources provided more color on Biden's SOTU address:
The speech is expected to be heavy on economic populism. The president will talk about raising taxes on corporations and the wealthy. He'll highlight efforts to cut costs for the American people, including pushing Congress to help make prescription drugs more affordable.
Biden will talk about the need to preserve democracy and freedom, a cornerstone of his re-election bid. That includes protecting and bolstering reproductive rights, an issue Democrats believe will energize voters in November. Biden is also expected to promote his unity agenda, a key feature of each of his addresses to Congress while in office.
Biden is also expected to give remarks on border security while the invasion of illegals has become one of the most heated topics among American voters. A majority of voters are frustrated with radical progressives in the White House facilitating the illegal migrant invasion.
It is probable that the president will attribute the failure of the Senate border bill to the Republicans, a claim many voters view as unfounded. This is because the White House has the option to issue an executive order to restore border security, yet opts not to do so
Maybe this is why?
Most Americans are still unaware that the census counts ALL people, including illegal immigrants, for deciding how many House seats each state gets!
— Elon Musk (@elonmusk) March 7, 2024
This results in Dem states getting roughly 20 more House seats, which is another strong incentive for them not to deport illegals.
While Biden addresses the nation, the Biden administration will be armed with a social media team to pump propaganda to at least 100 million Americans.
"The White House hosted about 70 creators, digital publishers, and influencers across three separate events" on Wednesday and Thursday, a White House official told CNN.
Not a very capable social media team...
The State of Confusion https://t.co/C31mHc5ABJ
— zerohedge (@zerohedge) March 7, 2024
The administration's move to ramp up social media operations comes as users on X are mostly free from government censorship with Elon Musk at the helm. This infuriates Democrats, who can no longer censor their political enemies on X.
Meanwhile, Democratic lawmakers tell Axios that the president's SOTU performance will be critical as he tries to dispel voter concerns about his elderly age. The address reached as many as 27 million people in 2023.
"We are all nervous," said one House Democrat, citing concerns about the president's "ability to speak without blowing things."
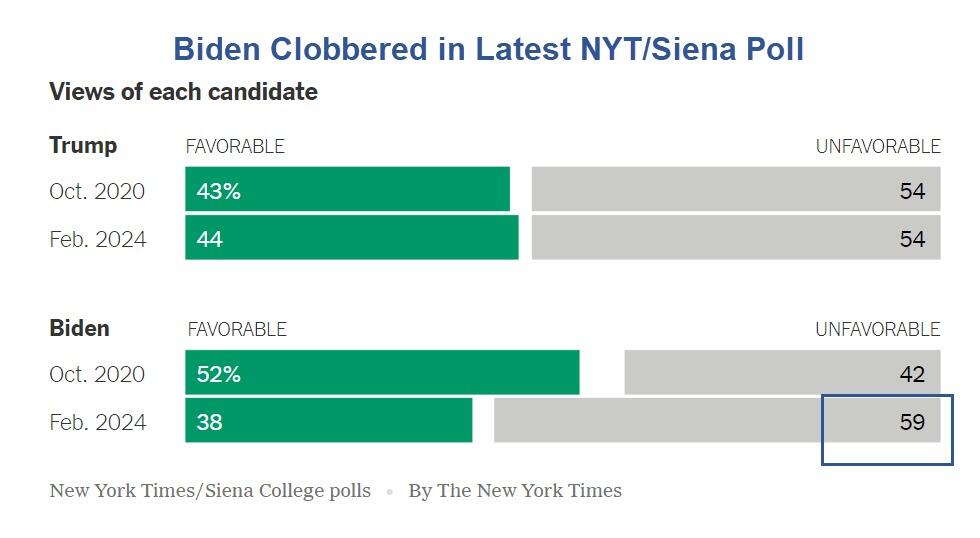
The SOTU address comes as Biden's polling data is in the dumps.
BetOnline has created several money-making opportunities for gamblers tonight, such as betting on what word Biden mentions the most.

As well as...

We will update you when Tucker Carlson's live feed of SOTU is published.
Fuck it. We’ll do it live! Thursday night, March 7, our live response to Joe Biden’s State of the Union speech. pic.twitter.com/V0UwOrgKvz
— Tucker Carlson (@TuckerCarlson) March 6, 2024


Walmart launches clever answer to Target’s new membership program


EyePoint poaches medical chief from Apellis; Sandoz CFO, longtime BioNTech exec to retire


Catastrophic Risk: Investing and Business Implications


The Digest #187


Deterra Royalties half-yearly result: stable performance and growth Initiatives


Deflationary pressures in China – be careful what you wish for


Gather ’round the crystal ball: A multi-commodity outlook from PDAC 2024


CADCHF: Central Bank Policies and Projections for 2024


We Are Not On The 1970s Inflation Rollercoaster – Part Four


Measuring Treasury Market Depth
-

 Uncategorized2 weeks ago
All Of The Elements Are In Place For An Economic Crisis Of Staggering Proportions
-

 Uncategorized1 month ago
Cathie Wood sells a major tech stock (again)
-

 Uncategorized3 weeks ago
California Counties Could Be Forced To Pay $300 Million To Cover COVID-Era Program
-

 Uncategorized2 weeks ago
Apparel Retailer Express Moving Toward Bankruptcy
-

 Uncategorized3 weeks ago
Industrial Production Decreased 0.1% in January
-
International2 hours ago
Walmart launches clever answer to Target’s new membership program
-

 Government1 month ago
War Delirium
-

 Uncategorized3 weeks ago
RFK Jr: The Wuhan Cover-Up & The Rise Of The Biowarfare-Industrial Complex