Technically Speaking: Is The Narrative All “Priced In?”
Is the narrative all "priced in?"
As discussed over the past couple of weeks, investors have gone "all in." With the markets now extremely extended, what should investors do now?
On Saturday, I discussed the risks as we head into distribution season.
"Giv
Share this:

Is the narrative all “priced in?”
As discussed over the past couple of weeks, investors have gone “all in.” With the markets now extremely extended, what should investors do now?
On Saturday, I discussed the risks as we head into distribution season.
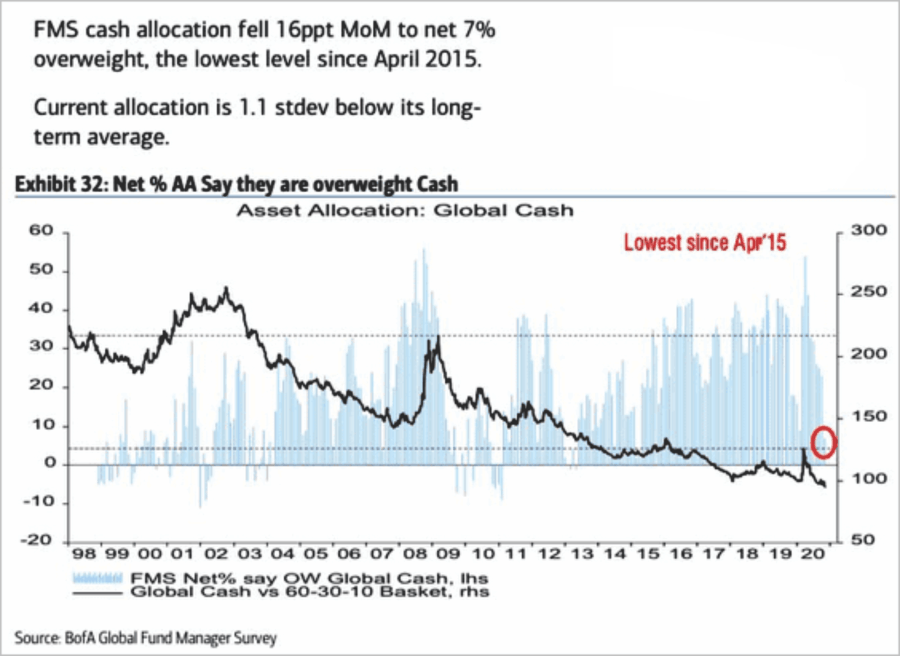
“Given the ongoing extremes of the market, the imbalances suggest a more cautious approach to portfolios currently. As such, we continued reducing our equity exposure, adjusting our bond holdings, and raising our cash levels.
As shown below, with fund managers carrying some of the lowest cash balances on record, we could see selling pressure to make distributions.”

However, while we may undoubtedly experience a pick up in volatility short-term due to distributions, longer-term the markets tend to be “forward-looking.” In theory, the markets are a “discounting mechanism” and start to adjust for expected outcomes.
Overly Optimistic
In this case, the market should be “pricing in” a recovery in economic growth and earnings as a “vaccine” begins to reduce the drag caused by the pandemic. However, with markets at all-time highs, investors have priced in “perfection,” leaving room for “disappointment.”
For example, in Q4-2019, the S&P 500 finished the year at 3230.78, up 27.6% for the year. The basis of the rally was a trade deal (which never occurred,) tax cuts and massive levels of share buybacks. At that time, analysts estimated that reported earnings for the fiscal year 2020 would be roughly $167/share. Investors justified paying 19.35x earnings due to low-interest rates and expected strong economic growth.
Unfortunately, that didn’t occur. Instead, the economy got hit by a pandemic, a recession, and surging levels of unemployment. Nonetheless, due to massive government interventions, the market recovered to trading near all-time highs, up more than 11% for the year.
However, earnings for 2020 will not come in at $167/share, but rather closer to $93/share. Such is more than $74 lower than estimated, leaving investors holding assets that have doubled in valuation from 19x to 38x earnings.

Investors are currently rushing into already overvalued assets once again based on expectations that 2021 earnings will rise to $143.09/share. The problem is that while investors chased the market higher, 2021 estimates collapsed by roughly $30/share.

The issue for investors is that historically analysts are roughly 30% too optimistic about the future.

Overly Optimistic
But it’s not just the analysts that are overly optimistic. In the short-term, investors cling to the idea that “fundamentals don’t matter.” Such is not entirely incorrect as “market momentum” is a hard thing to kill. When the “Fear Of Missing Out” overrides logic, the markets can make irrational moves. As noted in this week’s newsletter:
“You have to wonder precisely how much ‘gas is left in the tank’ when even ‘perma-bears’ are now bullish. Therefore, the question we should ask is ‘if everyone is in, who is left to buy?’”

That sentiment has pushed market speculation to more extreme levels, which have historically coincided with short- to intermediate-term corrections. As shown below, over the longer-term, such deviations from long-term means have rarely ended well for investors.
The deviation above the 225-day moving average is now at 15%, which is typically associated with at least short-term market peaks. (Last time was at the September highs)

The 52-week moving average deviation is just slightly below 15%. Such is historically associated with market peaks. (Last time at this level was January 2018, and at 13.5% in February 2020)

On a monthly basis, the deviation is at 17.5% of the 24-month moving average. While we have seen higher levels historically, the market is now in the territory of more meaningful market corrections.

While the markets can certainly go higher from here, the point is that they are unlikely to do so without a correction or consolidation, first.
Bullish Sentiment Abounds
Currently, investor sentiment is about as “bullish” as it can get. We produce a weekly fear/greed index for our RIAPRO subscribers (Free 30-day Trial)
The “Fear/Greed” gauge is how individual and professional investors are “positioning” themselves in the market based on their equity exposure. From a contrarian position, the higher the allocation to equities, to more likely the market is closer to a correction than not. (The gauge uses weekly closing data.)

However, even the CNN Fear/Greed gauge is pushing “bullish” levels.

Also, I have rarely seen a period where every sector and market is trading above its relative risk/reward range outside of Utilities. Again, not surprisingly, the deviations from long-term means are also at more historical levels.

None of this means a correction MUST occur. Much like “gasoline” stored in a tank, it requires a “catalyst” to ignite it.
Lot’s Of Risks To The Bullish Outlook
Many issues could provide such a “spark.”
- The market has fully priced in whatever economic recovery we are likely to see near-term.
- There is clear evidence of weakening economic data and slower earnings growth.
- Investors are counting on a “vaccine” to restore the economy to its previous strength fully.
- The markets have dismissed the negative impact of the economic shutdown.
- Market participants have discounted the need the additional stimulus to sustain economic growth and recovery.
- The Fed is on the sidelines for now. Without additional Treasury issuance, the Fed has less ability to provide additional liquidity to the market.
- While the economy is indeed recovering, along with employment, it will still likely fall well short of pre-pandemic levels stifling future earnings growth and revenues.
- Investors pay exceedingly high valuations based on a full earnings recovery, which is unlikely to be the case.
These are just some broad thoughts. However, when everyone is long equities and leveraged, it is an unexpected, exogenous event, which begins the rush for the exit.
What exactly will that catalyst be? No one knows, just as no one expected the “pandemic” in March.
Whatever the catalyst eventually is, the common refrain will be that “no one could have seen it coming.”
It’s Still A “Sellable Rally.”
The reason we have and continue to suggest selling this rally is that, until the pattern changes, the market exhibiting all traits of a “topping process.”
- Weak participation
- Failure at long-term resistance
- Extreme bullish speculation
- Negative divergences in relative strength
We can show this in a long-term monthly chart.

Since 2009, whenever the monthly MACD “buy signal” was this elevated, it typically correlated to a short- to intermediate-term market peak. At each point, the “bullish story” was the same.
- Earnings are still strong.
- Economic data suggests the economy is growing strongly.
- It’s a “Goldilocks Economy”
- The Fed is remaining “accommodative.”
However, the primary warning signs to investors were also the same:
- A failure of the economy to live up to market expectations
- The rise in volatility
- A decline in bond yields.
- A shortfall in corporate profits and earnings
Calculating The Madness
Sir Isaac Newton once said:
“I can calculate the motions of the heavenly bodies, but not the madness of the people..”
As we head into year-end, we will be navigating the risk of overly extended and bullish markets against the seasonally strong end of year period. As discussed in our “3-Minutes” on Monday, we expect a short-term correction over the next couple of weeks as “distribution season” ensues.
However, following that, the annual “Santa Claus” rally into year-end is likely. We will act accordingly and increase equity risk in portfolios as needed.
Such is just how we manage money. We believe that over the long-term, capital preservation and risk management leads to better outcomes.
If you disagree, that is okay.
When the opportunity presents itself, and the “madness has subsided,” these are the questions we will ask ourselves before we add exposure to portfolios:
- What is the expected return from current valuation levels? (___%)
- If I am wrong, given my current risk exposure, what is my potential downside? (___%)
- If #2 is greater than #1, then what actions should I be taking now? (#2 – #1 = ___%)
How you answer those questions is entirely up to you.
What you do with the answers is also up to you.
You have to ask yourself how much of the “narrative” has already gotten priced into the market?
By looking at the data, it would be easy to assume the answer is “much.”
The post Technically Speaking: Is The Narrative All “Priced In?” appeared first on RIA.
Uncategorized
Wendy’s teases new $3 offer for upcoming holiday
The Daylight Savings Time promotion slashes prices on breakfast.
Share this:


Daylight Savings Time, or the practice of advancing clocks an hour in the spring to maximize natural daylight, is a controversial practice because of the way it leaves many feeling off-sync and tired on the second Sunday in March when the change is made and one has one less hour to sleep in.
Despite annual "Abolish Daylight Savings Time" think pieces and online arguments that crop up with unwavering regularity, Daylight Savings in North America begins on March 10 this year.
Related: Coca-Cola has a new soda for Diet Coke fans
Tapping into some people's very vocal dislike of Daylight Savings Time, fast-food chain Wendy's (WEN) is launching a daylight savings promotion that is jokingly designed to make losing an hour of sleep less painful and encourage fans to order breakfast anyway.
Image source: Wendy's.
Promotion wants you to compensate for lost sleep with cheaper breakfast
As it is also meant to drive traffic to the Wendy's app, the promotion allows anyone who makes a purchase of $3 or more through the platform to get a free hot coffee, cold coffee or Frosty Cream Cold Brew.
More Food + Dining:
- Taco Bell menu tries new take on an American classic
- McDonald's menu goes big, brings back fan favorites (with a catch)
- The 10 best food stocks to buy now
Available during the Wendy's breakfast hours of 6 a.m. and 10:30 a.m. (which, naturally, will feel even earlier due to Daylight Savings), the deal also allows customers to buy any of its breakfast sandwiches for $3. Items like the Sausage, Egg and Cheese Biscuit, Breakfast Baconator and Maple Bacon Chicken Croissant normally range in price between $4.50 and $7.
The choice of the latter is quite wide since, in the years following the pandemic, Wendy's has made a concerted effort to expand its breakfast menu with a range of new sandwiches with egg in them and sweet items such as the French Toast Sticks. The goal was both to stand out from competitors with a wider breakfast menu and increase traffic to its stores during early-morning hours.
Wendy's deal comes after controversy over 'dynamic pricing'
But last month, the chain known for the square shape of its burger patties ignited controversy after saying that it wanted to introduce "dynamic pricing" in which the cost of many of the items on its menu will vary depending on the time of day. In an earnings call, chief executive Kirk Tanner said that electronic billboards would allow restaurants to display various deals and promotions during slower times in the early morning and late at night.
Outcry was swift and Wendy's ended up walking back its plans with words that they were "misconstrued" as an intent to surge prices during its most popular periods.
While the company issued a statement saying that any changes were meant as "discounts and value offers" during quiet periods rather than raised prices during busy ones, the reputational damage was already done since many saw the clarification as another way to obfuscate its pricing model.
"We said these menuboards would give us more flexibility to change the display of featured items," Wendy's said in its statement. "This was misconstrued in some media reports as an intent to raise prices when demand is highest at our restaurants."
The Daylight Savings Time promotion, in turn, is also a way to demonstrate the kinds of deals Wendy's wants to promote in its stores without putting up full-sized advertising or posters for what is only relevant for a few days.
Related: Veteran fund manager picks favorite stocks for 2024
stocks pandemicUncategorized
Inside The Most Ridiculous Jobs Report In Recent History: Record 1.2 Million Immigrant Jobs Added In One Month
Inside The Most Ridiculous Jobs Report In Recent History: Record 1.2 Million Immigrant Jobs Added In One Month
Last month we though that the…
Share this:


Last month we though that the January jobs report was the "most ridiculous in recent history" but, boy, were we wrong because this morning the Biden department of goalseeked propaganda (aka BLS) published the February jobs report, and holy crap was that something else. Even Goebbels would blush.
What happened? Let's take a closer look.
On the surface, it was (almost) another blockbuster jobs report, certainly one which nobody expected, or rather just one bank out of 76 expected. Starting at the top, the BLS reported that in February the US unexpectedly added 275K jobs, with just one research analyst (from Dai-Ichi Research) expecting a higher number.
Some context: after last month's record 4-sigma beat, today's print was "only" 3 sigma higher than estimates. Needless to say, two multiple sigma beats in a row used to only happen in the USSR... and now in the US, apparently.

Before we go any further, a quick note on what last month we said was "the most ridiculous jobs report in recent history": it appears the BLS read our comments and decided to stop beclowing itself. It did that by slashing last month's ridiculous print by over a third, and revising what was originally reported as a massive 353K beat to just 229K, a 124K revision, which was the biggest one-month negative revision in two years!

Of course, that does not mean that this month's jobs print won't be revised lower: it will be, and not just that month but every other month until the November election because that's the only tool left in the Biden admin's box: pretend the economic and jobs are strong, then revise them sharply lower the next month, something we pointed out first last summer and which has not failed to disappoint once.
In the past month the Biden department of goalseeking stuff higher before revising it lower, has revised the following data sharply lower:
— zerohedge (@zerohedge) August 30, 2023
- Jobs
- JOLTS
- New Home sales
- Housing Starts and Permits
- Industrial Production
- PCE and core PCE
To be fair, not every aspect of the jobs report was stellar (after all, the BLS had to give it some vague credibility). Take the unemployment rate, after flatlining between 3.4% and 3.8% for two years - and thus denying expectations from Sahm's Rule that a recession may have already started - in February the unemployment rate unexpectedly jumped to 3.9%, the highest since February 2022 (with Black unemployment spiking by 0.3% to 5.6%, an indicator which the Biden admin will quickly slam as widespread economic racism or something).

And then there were average hourly earnings, which after surging 0.6% MoM in January (since revised to 0.5%) and spooking markets that wage growth is so hot, the Fed will have no choice but to delay cuts, in February the number tumbled to just 0.1%, the lowest in two years...

... for one simple reason: last month's average wage surge had nothing to do with actual wages, and everything to do with the BLS estimate of hours worked (which is the denominator in the average wage calculation) which last month tumbled to just 34.1 (we were led to believe) the lowest since the covid pandemic...

... but has since been revised higher while the February print rose even more, to 34.3, hence why the latest average wage data was once again a product not of wages going up, but of how long Americans worked in any weekly period, in this case higher from 34.1 to 34.3, an increase which has a major impact on the average calculation.

While the above data points were examples of some latent weakness in the latest report, perhaps meant to give it a sheen of veracity, it was everything else in the report that was a problem starting with the BLS's latest choice of seasonal adjustments (after last month's wholesale revision), which have gone from merely laughable to full clownshow, as the following comparison between the monthly change in BLS and ADP payrolls shows. The trend is clear: the Biden admin numbers are now clearly rising even as the impartial ADP (which directly logs employment numbers at the company level and is far more accurate), shows an accelerating slowdown.

But it's more than just the Biden admin hanging its "success" on seasonal adjustments: when one digs deeper inside the jobs report, all sorts of ugly things emerge... such as the growing unprecedented divergence between the Establishment (payrolls) survey and much more accurate Household (actual employment) survey. To wit, while in January the BLS claims 275K payrolls were added, the Household survey found that the number of actually employed workers dropped for the third straight month (and 4 in the past 5), this time by 184K (from 161.152K to 160.968K).

This means that while the Payrolls series hits new all time highs every month since December 2020 (when according to the BLS the US had its last month of payrolls losses), the level of Employment has not budged in the past year. Worse, as shown in the chart below, such a gaping divergence has opened between the two series in the past 4 years, that the number of Employed workers would need to soar by 9 million (!) to catch up to what Payrolls claims is the employment situation.

There's more: shifting from a quantitative to a qualitative assessment, reveals just how ugly the composition of "new jobs" has been. Consider this: the BLS reports that in February 2024, the US had 132.9 million full-time jobs and 27.9 million part-time jobs. Well, that's great... until you look back one year and find that in February 2023 the US had 133.2 million full-time jobs, or more than it does one year later! And yes, all the job growth since then has been in part-time jobs, which have increased by 921K since February 2023 (from 27.020 million to 27.941 million).

Here is a summary of the labor composition in the past year: all the new jobs have been part-time jobs!

But wait there's even more, because now that the primary season is over and we enter the heart of election season and political talking points will be thrown around left and right, especially in the context of the immigration crisis created intentionally by the Biden administration which is hoping to import millions of new Democratic voters (maybe the US can hold the presidential election in Honduras or Guatemala, after all it is their citizens that will be illegally casting the key votes in November), what we find is that in February, the number of native-born workers tumbled again, sliding by a massive 560K to just 129.807 million. Add to this the December data, and we get a near-record 2.4 million plunge in native-born workers in just the past 3 months (only the covid crash was worse)!

The offset? A record 1.2 million foreign-born (read immigrants, both legal and illegal but mostly illegal) workers added in February!

Said otherwise, not only has all job creation in the past 6 years has been exclusively for foreign-born workers...

... but there has been zero job-creation for native born workers since June 2018!

This is a huge issue - especially at a time of an illegal alien flood at the southwest border...

... and is about to become a huge political scandal, because once the inevitable recession finally hits, there will be millions of furious unemployed Americans demanding a more accurate explanation for what happened - i.e., the illegal immigration floodgates that were opened by the Biden admin.
Which is also why Biden's handlers will do everything in their power to insure there is no official recession before November... and why after the election is over, all economic hell will finally break loose. Until then, however, expect the jobs numbers to get even more ridiculous.
Uncategorized
Shipping company files surprise Chapter 7 bankruptcy, liquidation
While demand for trucking has increased, so have costs and competition, which have forced a number of players to close.
Share this:


The U.S. economy is built on trucks.
As a nation we have relatively limited train assets, and while in recent years planes have played an expanded role in moving goods, trucks still represent the backbone of how everything — food, gasoline, commodities, and pretty much anything else — moves around the country.
Related: Fast-food chain closes more stores after Chapter 11 bankruptcy
"Trucks moved 61.1% of the tonnage and 64.9% of the value of these shipments. The average shipment by truck was 63 miles compared to an average of 640 miles by rail," according to the U.S. Bureau of Transportation Statistics 2023 numbers.
But running a trucking company has been tricky because the largest players have economies of scale that smaller operators don't. That puts any trucking company that's not a massive player very sensitive to increases in gas prices or drops in freight rates.
And that in turn has led a number of trucking companies, including Yellow Freight, the third-largest less-than-truckload operator; J.J. & Sons Logistics, Meadow Lark, and Boateng Logistics, to close while freight brokerage Convoy shut down in October.
Aside from Convoy, none of these brands are household names. but with the demand for trucking increasing, every company that goes out of business puts more pressure on those that remain, which contributes to increased prices.
Image source: Shutterstock
Another freight company closes and plans to liquidate
Not every bankruptcy filing explains why a company has gone out of business. In the trucking industry, multiple recent Chapter 7 bankruptcies have been tied to lawsuits that pushed otherwise successful companies into insolvency.
In the case of TBL Logistics, a Virginia-based national freight company, its Feb. 29 bankruptcy filing in U.S. Bankruptcy Court for the Western District of Virginia appears to be death by too much debt.
"In its filing, TBL Logistics listed its assets and liabilities as between $1 million and $10 million. The company stated that it has up to 49 creditors and maintains that no funds will be available for unsecured creditors once it pays administrative fees," Freightwaves reported.
The company's owners, Christopher and Melinda Bradner, did not respond to the website's request for comment.
Before it closed, TBL Logistics specialized in refrigerated and oversized loads. The company described its business on its website.
"TBL Logistics is a non-asset-based third-party logistics freight broker company providing reliable and efficient transportation solutions, management, and storage for businesses of all sizes. With our extensive network of carriers and industry expertise, we streamline the shipping process, ensuring your goods reach their destination safely and on time."
The world has a truck-driver shortage
The covid pandemic forced companies to consider their supply chain in ways they never had to before. Increased demand showed the weakness in the trucking industry and drew attention to how difficult life for truck drivers can be.
That was an issue HBO's John Oliver highlighted on his "Last Week Tonight" show in October 2022. In the episode, the host suggested that the U.S. would basically start to starve if the trucking industry shut down for three days.
"Sorry, three days, every produce department in America would go from a fully stocked market to an all-you-can-eat raccoon buffet," he said. "So it’s no wonder trucking’s a huge industry, with more than 3.5 million people in America working as drivers, from port truckers who bring goods off ships to railyards and warehouses, to long-haul truckers who move them across the country, to 'last-mile' drivers, who take care of local delivery."
The show highlighted how many truck drivers face low pay, difficult working conditions and, in many cases, crushing debt.
"Hundreds of thousands of people become truck drivers every year. But hundreds of thousands also quit. Job turnover for truckers averages over 100%, and at some companies it’s as high as 300%, meaning they’re hiring three people for a single job over the course of a year. And when a field this important has a level of job satisfaction that low, it sure seems like there’s a huge problem," Oliver shared.
The truck-driver shortage is not just a U.S. problem; it's a global issue, according to IRU.org.
"IRU’s 2023 driver shortage report has found that over three million truck driver jobs are unfilled, or 7% of total positions, in 36 countries studied," the global transportation trade association reported.
"With the huge gap between young and old drivers growing, it will get much worse over the next five years without significant action."
Related: Veteran fund manager picks favorite stocks for 2024
bankruptcy bankruptcies pandemic stocks commodities

Walmart launches clever answer to Target’s new membership program


Wendy’s has a new deal for daylight savings time haters


EyePoint poaches medical chief from Apellis; Sandoz CFO, longtime BioNTech exec to retire


Watch Live: President Biden Reminds Americans Just How Good They’ve Got It Thanks To Him


Catastrophic Risk: Investing and Business Implications


The Digest #187


Redefining Poverty: Towards a Transpartisan Approach


Watch: President Biden Delivers The “Darkest, Most Un-American Speech Given By A President”


Where Is R‑Star and the End of the Refi Boom: The Top 5 Posts of 2023


Is the biotech market rally real? Data suggest comeback in private, public markets
-

 Uncategorized2 weeks ago
All Of The Elements Are In Place For An Economic Crisis Of Staggering Proportions
-

 Uncategorized1 month ago
Cathie Wood sells a major tech stock (again)
-

 Uncategorized3 weeks ago
California Counties Could Be Forced To Pay $300 Million To Cover COVID-Era Program
-

 Uncategorized2 weeks ago
Apparel Retailer Express Moving Toward Bankruptcy
-

 Uncategorized3 weeks ago
Industrial Production Decreased 0.1% in January
-
International3 hours ago
Walmart launches clever answer to Target’s new membership program
-

 International1 month ago
War Delirium
-

 Uncategorized3 weeks ago
RFK Jr: The Wuhan Cover-Up & The Rise Of The Biowarfare-Industrial Complex