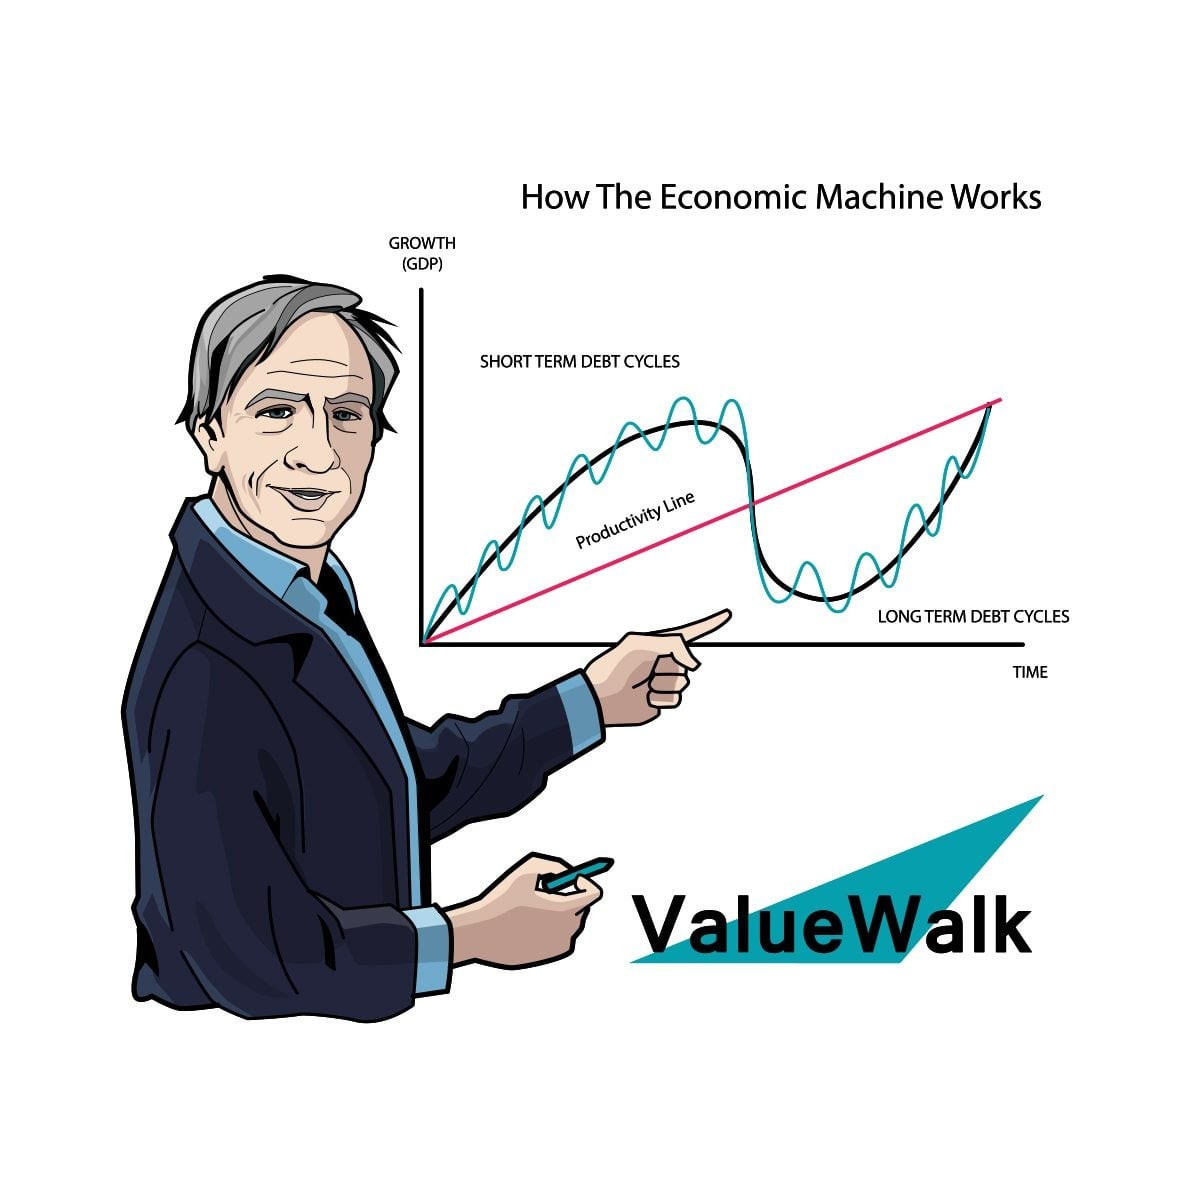
The last client-wide letter sent was titled "Bear Market Playbook", and logically, I feel obliged to provide a market update, because we might have moved from the fastest bear market in history, to a possibly new bull market.
It is not simple to pinpoint exactly where we are now in the market cycle. Ed Yardeni, a respected analyst, mused recently that because of the speed of the bear market and ensuing recovery, the March lows may not have been a real bear market, but merely an extreme "correction", and we might still be in the prior bull market. The fact that prior market leadership (Big Tech) is still leading the market supports this view.
Some pundits think that we are due for a pullback here, and some actually predict poor equity returns for the next decade.
Other economists believe that we are now in a new bull market, in the early stages of a new economic recovery.
Both Jeffrey Gundlach and Ray Dalio, among other financial analysts and pundits, have predicted that in the coming decade, the S&P 500 will provide low returns.
I recently attended an excellent presentation online about the energy sector by Warren Pies, a Ned Davis Research analyst in the energy sector. The setup to his talk, in my view, was important.
He discussed that because bond yields and interest rates are currently so low, it effects the intrinsic current view, and thus valuations, of the entire market. Applying a bond term to equities, the market currently looks at some stocks as "long/high duration" instruments, and some stocks as "short duration" instruments. This view becomes more exaggerated as interest rates creep lower and lower.
Duration is a measure of sensitivity of a bond's or fixed income portfolio's price to changes in interest rates. In general, the higher the duration, the more a bond's price will drop as interest rates rise (and the greater the interest rate risk). As a general rule, for every 1% change in interest rates (increase or decrease), a bond’s price will change approximately 1% in the opposite direction, for every year of duration.
It has been easy to see that the market consistently shows short term thinking in extrapolating current events and conditions far into the future. We have seen this often, as it is part of the human condition. When we feel good, we sometimes think it will always feel this way. When the mood turns less pleasant, it sometimes seems it will always feel this way.
In that way, it appears that the market has been lulled into a feeling that interest rates will always be this low or lower. Indeed, we have experienced an almost 4 decade bull market in bonds (where yields have gone lower and lower). That trend has been getting more and more stretched and that shows itself in many different areas of the economy.
A Look At Apple's Earnings
In order to see how this plays out in the real world, let's look at Apple, Inc as an example. As I have discussed in prior annual letters, I bought Apple when it was trading for around 10-11 times earnings in 2012-2013, for a dividend yield of around 2.4%, and an earnings yield (EPS/share price) of 10%, which was an outstanding bargain at the time. I initiated a position after it announced its first dividend, and I added to it relatively aggressively as it fell 40% in the following year. At the time, the market was scared that it was a "one trick pony" with revenues primarily coming from the iPhone, which was still nascent, and the iPod, which was diminishing in importance. It is worth noting that the ten year treasury yield was over 2% in 2012-2013, and the 30 year treasury yield was well over 3%.
Currently, Apple trades at 35 times earnings, yields a 0.7% dividend, and has an earnings yield of 2.65%. The ten year treasury currently yields 0.63%, and the 30 year treasury yields 1.35%.
We can see how as the ten year treasury yield falls through 2019 into 2020, Apple starts going parabolic. The divergence continues as the yield sinks lower.
The Federal Reserve, in order to save the economy in March, aggressively injected liquidity in the markets and bought bonds in order to stabilize current financial paradigms. This caused rates to fall to extremely low levels as more bonds were purchased. This has contributed to increasingly warped valuations on already popular stocks. I do like this idea, which others in the financial community have echoed as well, that as bond yields have descended lower and lower, it has spurred investment in companies that could be considered longer/higher duration growth plays. The caveat, of course, is whether some of these companies can really sustain growth rates that the market is pricing in long term. The market often overestimates the growth trajectory of companies. The other caveat is, what happens if rates go higher?
Some would call Apple's recent move a parabolic mania; others would say it represents a shift from hardware to services, which is higher margin - some would say it's a bit of both.
In early June, we did have a taste of what would happen when rates rise. Many stores reopened in early June, and the "reopening trade" came on. Many of our more value oriented positions mightily outperformed during this short time period, until concerns about the worsening of the virus and delayed reopening, as well as other economic concerns, came to fore, which caused yields to retreat again as more economic easing occurred.
First week of June ten year treasury bond yield spike - "Reopening trade"
As an aside, Ned Davis' conclusion about the energy markets was that there will probably be a recovery when demand recovers. My thoughts on that are, if energy is currently viewed as a short duration asset, it should recover stronger than usual as the real economy recovers and demand improves. Energy has been the worst performing sector since Covid, primarily due to demand reductions especially around jet fuel, industrial uses, and other such areas. But it could end up being the best performing sector when things turn.
Going back to where we are in the economic cycle, if we are indeed at the tail end of a bull market, it makes sense to think that it might be a risky time in some sectors now. Increased retail participation is a known qualification for a possible market bubble, and with people cooped up at home with no sports betting and little else to do, they have jumped into the markets in exceptional volumes since the pandemic began. The data shows record numbers of new brokerage accounts opened this past year. Furthermore, as we can see, glamour stocks and glamour sectors got even hotter since the lockdowns. Tesla, Nvidia, Amazon, Chewy, Shopify, Etsy, and many other "glamour" stocks are trading at extremely high multiples. Some, like Tesla, appear to not have multiples at all - most of their very slim profits come from selling regulatory credits, and they do not as of yet appear to be structurally profitable.
Tesla has been promising "Full Self Driving" for 5 years, and has been taking customers' money for the service for some time already, but the service as named doesn't fully exist yet
The Different Market Manias
We have successfully identified several manias in the past - The cannabis sector blew up, and then crashed - Tilray stock reached $176 per share a few years ago; now it is $6.64 per share. Some crypto-related stocks also bubbled up, and have since crashed (it remains to be seen what happens with crypto itself). This is a natural occurrence in markets, made even more possible through large monetary easing by the Fed.
There are, of course, real and fundamental reasons some of these stocks are going up. E-commerce usage has gone up a lot due to quarantines, and the pandemic has indeed accelerated a lot of existing technological trends. Also, the fact is, FANG have shown themselves to be extremely cash rich, robust, and capable businesses (regulatory overhang aside). Even Tesla could have a large future buying base in younger fans who will grow up to view the car as a status symbol. However, the market constantly overshoots and undershoots.
These dynamics are compounded by the rise in passive investing, which allows money to be funneled into large percentages of stock in the index, and for now that looks like the big getting bigger. This is reminiscent of 1999, as desired tech stocks went up much higher than normal, because of high insider ownership, where much of the float was locked up, and incremental investment pushed stock prices much higher than normal. Qualcomm, for instance, which many of us own, went from $3 per share to $87 per share from 1998-1999. Everyone knew their technology would be ubiquitous and crucial in future technology applications. However, the market was a bit premature in predicting proper growth rates and accurate valuation, and overshot. The share price of Qualcomm went down to $13 in 2002, and did not exceed the prior highs of 1999 until 20 years later.
We can see a lot of excitement in Yahoo's share price in 1999, leading up to its inclusion in the S&P500 index
Another symptom of bubble behavior is the large number of SPACs (Special Purpose Acquisition Company) we are seeing listing on the public markets these days. SPACs are "pre-revenue", meaning they are completely unproven entities. Investors are committing capital to these vehicles without even seeing any financial statements or evidence that they are even a business at all.
Very smart people have tried to take advantage of bubbles over the years and have failed - Sir Isaac Newton, one of the most influential mathematicians of all time, lost a lot of money on the South Sea Bubble in the 1700s.
The graphic about monetary expansion shown in the "Bear Market Playbook" letter was very revealing, and I am so happy and grateful that I incorporated that research into my macro views. As we know, the Fed has pumped more money than the economy lost from missing economic activity in the past months, causing excess liquidity to slosh around in the markets. They have clearly expressed the desire to let the economy "run hot" and even exceed their desired benchmark of 2% inflation in order to compensate for the lack of inflation in the past decade. This is probably done on purpose in order to help inflate our way out of the large debt we have incurred, similar to after World War 2, when rates remained low but inflation was very high. This ended up reducing US debt.
When this inflationary turn might occur is very hard to predict. But many experts that I admire and respect, and even some I don't, seem to be converging on this idea that the next decade might be more inflationary than the market expects - not necessarily 1930's Weimar Germany-style hyperinflation, but even a more normalized rate, and ensuing possible rate hikes, would be more than the market expects. Japan has had rates lower for longer, and the market may imagine a similar dynamic for the US - but Japan is different in that their economy is not as large and diversified as the United States', and their demographics skew older with less of a young labor force than ours.
A very sensible catalyst to real-economy growth would be an eventual infrastructure stimulus, which would probably come next year, whether the Red Team or the Blue Team wins the upcoming election in November.
The Dollar Losing Its Strength
Furthermore, with the dollar going lower due to the US debt added, commodities now have room to go higher (there is typically an inverse relationship between dollar/commodity strength, for a number of various reasons). Commodity bull markets in the past have been led by precious metals - and we have just seen that recently in a powerful move up in gold and silver.
Again, the timing is very hard to call, especially as "passive investing" takes more and more share of the global market (passive investing just means that people pay money to Vanguard and Blackrock to pay any price for a bundle of stocks, and when they redeem, to sell for any price) and fund flows continue to expand market valuations, in my opinion somewhat irrationally. We can't exactly know when those dynamics will end and when momentum wanes and market leadership changes.
1999 is a decent comparison for some areas of the market today, especially in some SaaS (software as a service) stocks where the competition is crowded, but companies are valued as being the next possible winner in the space. But another comparison some savvy investors use to the current market environment, where only a number of stocks are being enthusiastically bought by the markets, is the "Nifty Fifty" group of stocks in the 1960s. The "Nifty Fifty" were stocks which had very bright futures and that was recognized by the markets, and were recognized as "must-haves" at any price. People consistently bid the prices of these stocks higher and higher over the years. Many of them are companies we own now, such as Disney, McDonald's, and Coca Cola. Vitaliy Katsenelson, a value investor and fund manager, recently pointed out that just like people currently claim that tech companies deserve higher multiples because of less capital intensity and more intangible value on the balance sheet, so too, companies like McDonald's were also considered "asset-lite" businesses back then, due to how they franchise most of their establishments out to others who take on a lot of the financial responsibility.
After being awarded higher and higher share prices, ultimately during the next bear market in the early 1970s, they fell. Hard.
From their highs, Coca Cola fell 69%, McDonald's fell 72%, and Disney fell 87% (!). It took the Nifty Fifty over a decade to surpass their prior highs. Most of them remained excellent companies, and even provided very good long term returns. But overpaying for them ended up being painful for a long stretch. Valuation matters over the long run.
Another obvious comparison between current market conditions and the Nifty Fifty is, these high flyers' valuations were also crushed by higher than expected inflation, which occurred due to energy prices going a lot higher in a short period of time. We may be entering a similar environment down the line, as due to Covid-19, there has been reduced energy investment and capital expenditures. This could result in shortages, and prices would need to go back up in order to justify further investment in the sector. Energy is currently a despised sector, now fallen to around 2.8% of the S&P 500, from over 10% of it in the past. When that changes, we could see a reversion. The Fed wants inflation, energy will probably be undersupplied down the line, rates may go up, infrastructure stimulus will probably be implemented to pass the baton from central bank financial stimulus to fiscal stimulus, and we could end up with a regime change in the market - one which favors value, cyclicals, financials, industrials and energy.
Portfolio Activity
I would now like to share with you some of what we are doing now, all of that said. We trimmed a little bit of our retail exposure, as a nod to how E-Commerce has rapidly advanced from 17% or so of total retail sales, to possibly as much as over 30% of sales. While this leaves the remaining 60-70% of US retail sales transacted in brick and mortar stores, there will be some shriveling at the margins and I reduced some of our exposure. I am still bullish (positive) on the survivors and consolidators, as people still love to get out and shop.
We also have been buying some solar energy indices as an energy and election hedge. There are very few dividend paying solar energy companies, and they will probably end up growing through more investment in the space. Solar provided only 2% of US energy in 2019. If they get to 8%, that is two doublings. Of course, renewables are lower margin businesses, but regulatory demands will probably boost investment and usage. We can enjoy some of that in the coming decade. This past decade, the solar index went exactly nowhere. Completely dead money for a decade. Poor execution, Chinese oversupply, and other factors caused this. However, more consolidation and regulatory subsidy in the space will probably improve profitability, not to mention some decoupling from China that is taking place which may reduce oversupply and increase profitability in some of the domestic players.
The ten year total return in this solar energy index has been -29%, a negative return for the decade. This could change in the next decade.
We have also been selectively adding commodity producers, small and moderate positions, in the areas of agriculture and even metals and mining. They are trading at very depressed levels, and if we are indeed going into a commodity bull market eventually, these should do very well and pay us dividends to boot.
You will notice I also initiated a rare position solely intended for capital gains. It is an insurer called Brighthouse Financial. It is trading at a mere fraction of its book value. If rates go higher, it should go higher as well.
I wanted to end with a quote from an investor who had been through 1999. He recently wrote (1):
"...If you remember 1999/2000, if you didn't own the bubble stocks, you actually did really well throughout the 2000-2002 bear market. It is very possible that this will happen again. Many of the frothy names can have large declines, maybe the S&P 500 index even goes down 50% or more, and people who didn't own the most expensive stocks might actually still do well. So, don't let people scare you out of the market with this talk of market P/E's. If you are happy with what you own and how they are valued, hold on and things should be fine (like it was in 1999/2000). "
However, the following graphic was recently shared by my friend Dividend Growth Investor on his Twitter account, and could serve as a more positive counterpoint to the gloomier scenario above.
We could actually be in the early stages of a new secular bull market, which goes to show you that the best strategy is probably to keep investing in attractively valued companies that have good corporate cultures for the long run
Lastly, I wanted to share some very good news. Interactive Brokers enabled us to flip a switch and change to their "Lite" version, which eliminates all trading fees, and especially those pesky minimum monthly commissions for accounts under $100k. I am pleased to announce that there are NO trading fees, and NO MORE monthly minimum commissions from Interactive Brokers. I am thrilled about that.
That is the update for now. I wanted to give some context, historical and otherwise, on this very interesting market we are currently involved in. I will write much more detail in the next annual update published in early 2021.
Since Covid, value type stocks have suffered one of their worst drawdowns compared to growth/glamour in a long, long, long time. However, that is usually the time to hold tight, and even add more value, as many seasoned investors have seen this before, and anticipate a reversion to the mean down the line. Value tends to perform best over long periods of time, but sometimes, investors must deal with long drawdowns. It makes sense that in this once-in-a-century pandemic, the market may be scared that things have changed forever. Reality, though, is usually more nuanced. By staying as disciplined and consistent as we can, we will hopefully be set up to enjoy the value premium when it finally returns, collecting and reinvesting our dividends on the way.
Chronic stress and inflammation linked to societal and environmental impacts in new study
From anxiety about the state of the world to ongoing waves of Covid-19, the stresses we face can seem relentless and even overwhelming. Worse, these stressors…
From anxiety about the state of the world to ongoing waves of Covid-19, the stresses we face can seem relentless and even overwhelming. Worse, these stressors can cause chronic inflammation in our bodies. Chronic inflammation is linked to serious conditions such as cardiovascular disease and cancer – and may also affect our thinking and behavior.
Credit: Image: Vodovotz et al/Frontiers
From anxiety about the state of the world to ongoing waves of Covid-19, the stresses we face can seem relentless and even overwhelming. Worse, these stressors can cause chronic inflammation in our bodies. Chronic inflammation is linked to serious conditions such as cardiovascular disease and cancer – and may also affect our thinking and behavior.
A new hypothesis published in Frontiers in Science suggests the negative impacts may extend far further.
“We propose that stress, inflammation, and consequently impaired cognition in individuals can scale up to communities and populations,” explained lead author Prof Yoram Vodovotz of the University of Pittsburgh, USA.
“This could affect the decision-making and behavior of entire societies, impair our cognitive ability to address complex issues like climate change, social unrest, and infectious disease – and ultimately lead to a self-sustaining cycle of societal dysfunction and environmental degradation,” he added.
Bodily inflammation ‘mapped’ in the brain
One central premise to the hypothesis is an association between chronic inflammation and cognitive dysfunction.
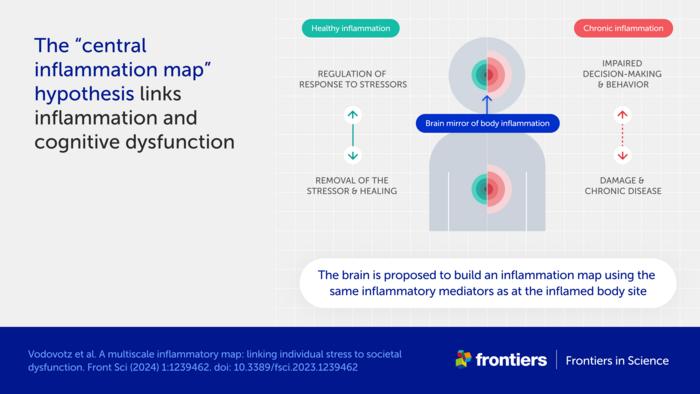
“The cause of this well-known phenomenon is not currently known,” said Vodovotz. “We propose a mechanism, which we call the ‘central inflammation map’.”
The authors’ novel idea is that the brain creates its own copy of bodily inflammation. Normally, this inflammation map allows the brain to manage the inflammatory response and promote healing.
When inflammation is high or chronic, however, the response goes awry and can damage healthy tissues and organs. The authors suggest the inflammation map could similarly harm the brain and impair cognition, emotion, and behavior.
Accelerated spread of stress and inflammation online
A second premise is the spread of chronic inflammation from individuals to populations.
“While inflammation is not contagious per se, it could still spread via the transmission of stress among people,” explained Vodovotz.
The authors further suggest that stress is being transmitted faster than ever before, through social media and other digital communications.
“People are constantly bombarded with high levels of distressing information, be it the news, negative online comments, or a feeling of inadequacy when viewing social media feeds,” said Vodovotz. “We hypothesize that this new dimension of human experience, from which it is difficult to escape, is driving stress, chronic inflammation, and cognitive impairment across global societies.”
Inflammation as a driver of social and planetary disruption
These ideas shift our view of inflammation as a biological process restricted to an individual. Instead, the authors see it as a multiscale process linking molecular, cellular, and physiological interactions in each of us to altered decision-making and behavior in populations – and ultimately to large-scale societal and environmental impacts.
“Stress-impaired judgment could explain the chaotic and counter-intuitive responses of large parts of the global population to stressful events such as climate change and the Covid-19 pandemic,” explained Vodovotz.
“An inability to address these and other stressors may propagate a self-fulfilling sense of pervasive danger, causing further stress, inflammation, and impaired cognition in a runaway, positive feedback loop,” he added.
The fact that current levels of global stress have not led to widespread societal disorder could indicate an equally strong stabilizing effect from “controllers” such as trust in laws, science, and multinational organizations like the United Nations.
“However, societal norms and institutions are increasingly being questioned, at times rightly so as relics of a foregone era,” said Prof Paul Verschure of Radboud University, the Netherlands, and a co-author of the article. “The challenge today is how we can ward off a new adversarial era of instability due to global stress caused by a multi-scale combination of geopolitical fragmentation, conflicts, and ecological collapse amplified by existential angst, cognitive overload, and runaway disinformation.”
Reducing social media exposure as part of the solution
The authors developed a mathematical model to test their ideas and explore ways to reduce stress and build resilience.
“Preliminary results highlight the need for interventions at multiple levels and scales,” commented co-author Prof Julia Arciero of Indiana University, USA.
“While anti-inflammatory drugs are sometimes used to treat medical conditions associated with inflammation, we do not believe these are the whole answer for individuals,” said Dr David Katz, co-author and a specialist in preventive and lifestyle medicine based in the US. “Lifestyle changes such as healthy nutrition, exercise, and reducing exposure to stressful online content could also be important.”
“The dawning new era of precision and personalized therapeutics could also offer enormous potential,” he added.
At the societal level, the authors suggest creating calm public spaces and providing education on the norms and institutions that keep our societies stable and functioning.
“While our ‘inflammation map’ hypothesis and corresponding mathematical model are a start, a coordinated and interdisciplinary research effort is needed to define interventions that would improve the lives of individuals and the resilience of communities to stress. We hope our article stimulates scientists around the world to take up this challenge,” Vodovotz concluded.
The article is part of the Frontiers in Science multimedia article hub ‘A multiscale map of inflammatory stress’. The hub features a video, an explainer, a version of the article written for kids, and an editorial, viewpoints, and policy outlook from other eminent experts: Prof David Almeida (Penn State University, USA), Prof Pietro Ghezzi (University of Urbino Carlo Bo, Italy), and Dr Ioannis P Androulakis (Rutgers, The State University of New Jersey, USA).
Journal
Frontiers in Science
DOI
10.3389/1239462
Method of Research
Computational simulation/modeling
Subject of Research
Not applicable
Article Title
A multiscale inflammatory map: linking individual stress to societal dysfunction
Article Publication Date
12-Mar-2024
COI Statement
YV is a cofounder of, and stakeholder in, Immunetrics, Inc. and a consultant to Anuna AI. PFMJV is the founder of, and stakeholder in, Eodyne Systems s.l. and Sapiens5 Holding BV. DLK was employed by Tangelo – Intend, Inc. Neither these companies nor the funders mentioned above were involved in the study design, data collection, analysis, interpretation of data, the writing of this article, or the decision to submit it for publication. The companies mentioned above also did not provide funding for the study. The remaining author declares that the research was conducted in the absence of any commercial or financial relationships that could be construed as a potential conflict of interest. The authors YV and PV declared that they are editorial board members of Frontiers, at the time of submission. This had no impact on the peer review process and the final decision.
Acadia’s Nuplazid fails PhIII study due to higher-than-expected placebo effect
After years of trying to expand the market territory for Nuplazid, Acadia Pharmaceuticals might have hit a dead end, with a Phase III fail in schizophrenia…
After years of trying to expand the market territory for Nuplazid, Acadia Pharmaceuticals might have hit a dead end, with a Phase III fail in schizophrenia due to the placebo arm performing better than expected.
Steve Davis
“We will continue to analyze these data with our scientific advisors, but we do not intend to conduct any further clinical trials with pimavanserin,” CEO Steve Davis said in a Monday press release. Acadia’s stock $ACAD dropped by 17.41% before the market opened Tuesday.
Pimavanserin, a serotonin inverse agonist and also a 5-HT2A receptor antagonist, is already in the market with the brand name Nuplazid for Parkinson’s disease psychosis. Efforts to expand into other indications such as Alzheimer’s-related psychosis and major depression have been unsuccessful, and previous trials in schizophrenia have yielded mixed data at best. Its February presentation does not list other pimavanserin studies in progress.
The Phase III ADVANCE-2 trial investigated 34 mg pimavanserin versus placebo in 454 patients who have negative symptoms of schizophrenia. The study used the negative symptom assessment-16 (NSA-16) total score as a primary endpoint and followed participants up to week 26. Study participants have control of positive symptoms due to antipsychotic therapies.
The company said that the change from baseline in this measure for the treatment arm was similar between the Phase II ADVANCE-1 study and ADVANCE-2 at -11.6 and -11.8, respectively. However, the placebo was higher in ADVANCE-2 at -11.1, when this was -8.5 in ADVANCE-1. The p-value in ADVANCE-2 was 0.4825.
In July last year, another Phase III schizophrenia trial — by Sumitomo and Otsuka — also reported negative results due to what the company noted as Covid-19 induced placebo effect.
According to Mizuho Securities analysts, ADVANCE-2 data were disappointing considering the company applied what it learned from ADVANCE-1, such as recruiting patients outside the US to alleviate a high placebo effect. The Phase III recruited participants in Argentina and Europe.
Analysts at Cowen added that the placebo effect has been a “notorious headwind” in US-based trials, which appears to “now extend” to ex-US studies. But they also noted ADVANCE-1 reported a “modest effect” from the drug anyway.
Nonetheless, pimavanserin’s safety profile in the late-stage study “was consistent with previous clinical trials,” with the drug having an adverse event rate of 30.4% versus 40.3% with placebo, the company said. Back in 2018, even with the FDA approval for Parkinson’s psychosis, there was an intense spotlight on Nuplazid’s safety profile.
Acadia previously aimed to get Nuplazid approved for Alzheimer’s-related psychosis but had many hurdles. The drug faced an adcomm in June 2022 that voted 9-3 noting that the drug is unlikely to be effective in this setting, culminating in a CRL a few months later.
As for the company’s next R&D milestones, Mizuho analysts said it won’t be anytime soon: There is the Phase III study for ACP-101 in Prader-Willi syndrome with data expected late next year and a Phase II trial for ACP-204 in Alzheimer’s disease psychosis with results anticipated in 2026.
Acadia collected $549.2 million in full-year 2023 revenues for Nuplazid, with $143.9 million in the fourth quarter.
Over the last few years, digital currencies and gold have become decent barometers of speculative investor appetite. Such isn’t surprising given the evolution…
Over the last few years, digital currencies and gold have become decent barometers of speculative investor appetite. Such isn’t surprising given the evolution of the market into a “casino” following the pandemic, where retail traders have increased their speculative appetites.
“Such is unsurprising, given that retail investors often fall victim to the psychological behavior of the “fear of missing out.” The chart below shows the “dumb money index” versus the S&P 500. Once again, retail investors are very long equities relative to the institutional players ascribed to being the “smart money.””
“The difference between “smart” and “dumb money” investors shows that, more often than not, the “dumb money” invests near market tops and sells near market bottoms.”
That enthusiasm has increased sharply since last November as stocks surged in hopes that the Federal Reserve would cut interest rates. As noted by Sentiment Trader:
“Over the past 18 weeks, the straight-up rally has moved us to an interesting juncture in the Sentiment Cycle. For the past few weeks, the S&P 500 has demonstrated a high positive correlation to the ‘Enthusiasm’ part of the cycle and a highly negative correlation to the ‘Panic’ phase.”
That frenzy to chase the markets, driven by the psychological bias of the “fear of missing out,” has permeated the entirety of the market. As noted in “This Is Nuts:”
“Since then, the entire market has surged higher following last week’s earnings report from Nvidia (NVDA). The reason I say “this is nuts” is the assumption that all companies were going to grow earnings and revenue at Nvidia’s rate. There is little doubt about Nvidia’s earnings and revenue growth rates. However, to maintain that growth pace indefinitely, particularly at 32x price-to-sales, means others like AMD and Intel must lose market share.”
Of course, it is not just a speculative frenzy in the markets for stocks, specifically anything related to “artificial intelligence,” but that exuberance has spilled over into gold and cryptocurrencies.
Birds Of A Feather
There are a couple of ways to measure exuberance in the assets. While sentiment measures examine the broad market, technical indicators can reflect exuberance on individual asset levels. However, before we get to our charts, we need a brief explanation of statistics, specifically, standard deviation.
“Like a rubber band that has been stretched too far – it must be relaxed in order to be stretched again. This is exactly the same for stock prices that are anchored to their moving averages. Trends that get overextended in one direction, or another, always return to their long-term average. Even during a strong uptrend or strong downtrend, prices often move back (revert) to a long-term moving average.”
The idea of “stretching the rubber band” can be measured in several ways, but I will limit our discussion this week to Standard Deviation and measuring deviation with “Bollinger Bands.”
“Standard Deviation” is defined as:
“A measure of the dispersion of a set of data from its mean. The more spread apart the data, the higher the deviation. Standard deviation is calculated as the square root of the variance.”
In plain English,this meansthat the further away from the average that an event occurs, the more unlikely it becomes. As shown below, out of 1000 occurrences, only three will fall outside the area of 3 standard deviations. 95.4% of the time, events will occur within two standard deviations.
A second measure of “exuberance” is “relative strength.”
“In technical analysis, the relative strength index (RSI) is a momentum indicator that measures the magnitude of recent price changes to evaluate overbought or oversold conditions in the price of a stock or other asset. The RSI is displayed as an oscillator (a line graph that moves between two extremes) and can read from 0 to 100.
Traditional interpretation and usage of the RSI are that values of 70 or above indicate that a security is becoming overbought or overvalued and may be primed for a trend reversal or corrective pullback in price. An RSI reading of 30 or below indicates an oversold or undervalued condition.” – Investopedia
With those two measures, let’s look at Nvidia (NVDA), the poster child of speculative momentum trading in the markets. Nvidia trades more than 3 standard deviations above its moving average, and its RSI is 81. The last time this occurred was in July of 2023 when Nvidia consolidated and corrected prices through November.
Interestingly, gold also trades well into 3 standard deviation territory with an RSI reading of 75. Given that gold is supposed to be a “safe haven” or “risk off” asset, it is instead getting swept up in the current market exuberance.
The same is seen with digital currencies. Given the recent approval of spot, Bitcoin exchange-traded funds (ETFs), the panic bid to buy Bitcoin has pushed the price well into 3 standard deviation territory with an RSI of 73.
In other words, the stock market frenzy to “buy anything that is going up” has spread from just a handful of stocks related to artificial intelligence to gold and digital currencies.
It’s All Relative
We can see the correlation between stock market exuberance and gold and digital currency, which has risen since 2015 but accelerated following the post-pandemic, stimulus-fueled market frenzy. Since the market, gold and cryptocurrencies, or Bitcoin for our purposes, have disparate prices, we have rebased the performance to 100 in 2015.
Gold was supposed to be an inflation hedge. Yet, in 2022, gold prices fell as the market declined and inflation surged to 9%. However, as inflation has fallen and the stock market surged, so has gold. Notably, since 2015, gold and the market have moved in a more correlated pattern, which has reduced the hedging effect of gold in portfolios. In other words, during the subsequent market decline, gold will likely track stocks lower, failing to provide its “wealth preservation” status for investors.
The same goes for cryptocurrencies. Bitcoin is substantially more volatile than gold and tends to ebb and flow with the overall market. As sentiment surges in the S&P 500, Bitcoin and other cryptocurrencies follow suit as speculative appetites increase. Unfortunately, for individuals once again piling into Bitcoin to chase rising prices, if, or when, the market corrects, the decline in cryptocurrencies will likely substantially outpace the decline in market-based equities. This is particularly the case as Wall Street can now short the spot-Bitcoin ETFs, creating additional selling pressure on Bitcoin.
Just for added measure, here is Bitcoin versus gold.
Not A Recommendation
There are many narratives surrounding the markets, digital currency, and gold. However, in today’s market, more than in previous years, all assets are getting swept up into the investor-feeding frenzy.
Sure, this time could be different. I am only making an observation and not an investment recommendation.
However, from a portfolio management perspective, it will likely pay to remain attentive to the correlated risk between asset classes. If some event causes a reversal in bullish exuberance, cash and bonds may be the only place to hide.
We use cookies on our website to give you the most relevant experience by remembering your preferences and repeat visits. By clicking “Accept”, you consent to the use of ALL the cookies.
This website uses cookies to improve your experience while you navigate through the website. Out of these, the cookies that are categorized as necessary are stored on your browser as they are essential for the working of basic functionalities of the website. We also use third-party cookies that help us analyze and understand how you use this website. These cookies will be stored in your browser only with your consent. You also have the option to opt-out of these cookies. But opting out of some of these cookies may affect your browsing experience.
Necessary cookies are absolutely essential for the website to function properly. These cookies ensure basic functionalities and security features of the website, anonymously.
Cookie
Duration
Description
cookielawinfo-checbox-analytics
11 months
This cookie is set by GDPR Cookie Consent plugin. The cookie is used to store the user consent for the cookies in the category "Analytics".
cookielawinfo-checbox-functional
11 months
The cookie is set by GDPR cookie consent to record the user consent for the cookies in the category "Functional".
cookielawinfo-checbox-others
11 months
This cookie is set by GDPR Cookie Consent plugin. The cookie is used to store the user consent for the cookies in the category "Other.
cookielawinfo-checkbox-necessary
11 months
This cookie is set by GDPR Cookie Consent plugin. The cookies is used to store the user consent for the cookies in the category "Necessary".
cookielawinfo-checkbox-performance
11 months
This cookie is set by GDPR Cookie Consent plugin. The cookie is used to store the user consent for the cookies in the category "Performance".
viewed_cookie_policy
11 months
The cookie is set by the GDPR Cookie Consent plugin and is used to store whether or not user has consented to the use of cookies. It does not store any personal data.
Functional cookies help to perform certain functionalities like sharing the content of the website on social media platforms, collect feedbacks, and other third-party features.
Performance cookies are used to understand and analyze the key performance indexes of the website which helps in delivering a better user experience for the visitors.
Analytical cookies are used to understand how visitors interact with the website. These cookies help provide information on metrics the number of visitors, bounce rate, traffic source, etc.
Advertisement cookies are used to provide visitors with relevant ads and marketing campaigns. These cookies track visitors across websites and collect information to provide customized ads.


