Government
Stock Market Overview – Holiday Week
It’s Thanksgiving this week, which means we can expect a pretty tame and boring week of trading, as most of Wall Street is more worried about their travel plans than taking risks that might put their job in jeopardy. Markets are closed on Thursday…
Share this:

It’s Thanksgiving this week, which means we can expect a pretty tame and boring week of trading, as most of Wall Street is more worried about their travel plans than taking risks that might put their job in jeopardy.
Markets are closed on Thursday for Thanksgiving, and close early at 1:00 pm EST on Friday, so only three days of full trading.
S&P 500 Price Action: Things Look Bullish
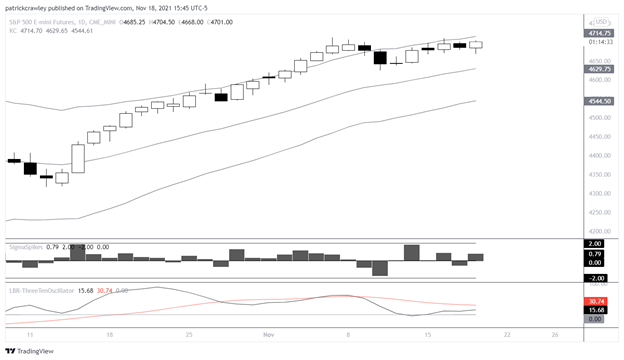
The S&P 500 is still in a very strong uptrend, following last week’s pullback. Even though the S&P swiftly declined over 2% from it’s high of 4711.75, viewed in context, that’s actually a pretty tame pullback.
This upswing was so strong in momentum, with several overnight gaps, that you’d expect a stronger pullback.
The two key levels to watch right now are 4711.75, which is the most recent high, and 4625.25, the most recent low.
A significant breach below 4625.25 indicates that the market has tested the highs, failed to rally, and then failed at short-term support, all of which is quite bearish for the short-term trend.
As of now, though, the signs are pointing to the stock breaking through to new highs, as the market is testing the highs and there’s no price rejection in sight. If we move down to a 4-hour chart, observe how the range has contracted considerably right near the highs, indicating a level of price acceptance, or in other words, there’s little disagreement on the price right, which frequently leads to that 4711.75 resistance level breaking.

The Themes Driving This Market: This Week We Talk Inflation
On a macro level, inflation is one of the key themes driving this market.
Between politicians and pundits stoking the flames and blaming each other, massive shortages across nearly the entire supply chain, increased prices, and large companies complaining about their issues dealing with inflation, investors and traders are waiting to see how things will play out.
It’s difficult for the Fed or White House to ignore inflation either, between the consumer price index hitting a 30-year high of 6.2% in October, home prices soaring across the United States, and significant price increases across a swath of everyday consumer products.
And now that the inflation conversation is thoroughly mainstream to the point that you overhear conversations about inflation at the grocery store, there’s plenty of punditry as far as who’s fault this is, which products are too expensive to buy, etc, there’s very little information on trying to actually trade the market that we’re given.
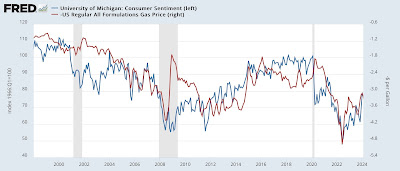
According to a study called The Best Strategies for Inflationary Times performed by the massive hedge fund Man Group, the best performing assets during inflationary times are energy commodities like crude oil, and the price action in crude is confirming this:

This is because energy, and gasoline in particular, track inflation closer than almost any other asset class, as you could see below aided by this excellent chart I got from Kevin Muir of the Macro Tourist:

So if you’re not a global macro trader and can’t make heads or tails of central bank conversations, currency crosses, or how to interpret the outcome of an Argentinian election, a good shortcut to understand how the inflation trade is working out is by just looking at some charts of energy commodities like crude oil and gasoline.
Stocks Likely to Be In Play This Week
Electric Vehicle (EV) Stocks
To be fair, EV stocks have basically been in play all year, it’s a new sector with tons of new entrants like Rivian (RIVN) and Lucid (LCID) throwing their hat in the ring, hoping to be the next Tesla.
But the heat just got turned up on the EV sector. According to a Bloomberg report, Apple (AAPL) is planning to build their own fully autonomous vehicle and launch it in four years.
Bloomberg mentioned that “fully autonomous” means completely free of human intervention. No steering wheel, no pedals. Taiwan Semiconductor (TSM) is said to be tapped to build the chips for this car.
Apple’s entry into the EV market has been a recurring market rumor for a few years now, with rumors of the company aiming to buy Tesla making the rounds around social media semi-regularly.
It’s worth noting that Bloomberg’s source on this report is anonymous, so it’s possible that their source could be misleading them, although it is Bloomberg, who are generally quite solid in their reporting, especially with regard to market-moving topics like these.
Stocks to Watch:
Retail Stocks Are In Play
The market thought retail was left for dead. Not only were they given ‘melting ice cube’ status as a result of Amazon’s prowess, but the COVID-19 lockdowns and other complications looked like a death blow. But retail is back and Americans are spending money in retail stores like crazy.
This chart says it all (courtesy of the Macro Tourist):

There was a barrage of better-than-expected earnings reports in the retail sector from companies like Kohls (KSS), Macy’s (M), and TJ Maxx (TJX) last week, with several mature retail stocks making 10%+ advances on earnings.
However, price is what pays, and there’s some interesting price action in the SPDR S&P Retail ETF (XRT), which finally broke out of a long-term range as a result of these bullish earnings reports:

Stocks to Watch:
Is Bill Ackman’s SPAC Finally Making a Deal?
It’s been an exciting two years in SPAC land, but not so much for Bill Ackman, whose Pershing Square Totine Holdings (PSTH) SPAC has continually disappointed SPAC traders, between taking forever to find a deal, and the highly-complicated deal he finally struck with Universal Music Group which failed.
PSTH has been looking for deals since the summer of 2020 and has consistently failed to deliver, while most successful SPACs find deals in months. This is despite massive initial investor interest and speculation driven by Ackman’s fame as a successful hedge fund manager.
However, there might be light at the end of the tunnel, as Ackman announced last week an update on the SPAC, telling investors that they’re actively scouting deals, but if things don’t work out, they will be returning capital to investors.
Stocks to Watch:
The post Stock Market Overview – Holiday Week appeared first on Warrior Trading.
sp 500 stocks covid-19 fed etf white house testing commodities oilGovernment
“Are you better off than you were four years ago?”
– by New Deal democratNo economic news today, so let me take a look at the supposed killer recent GOP meme that they claim is completely unanswerable:…
Share this:

- by New Deal democrat
No economic news today, so let me take a look at the supposed killer recent GOP meme that they claim is completely unanswerable: “Are you better off today than you were four years ago?”


Spread & Containment
AI can help predict whether a patient will respond to specific tuberculosis treatments, paving way for personalized care
People have been battling tuberculosis for thousands of years, and drug-resistant strains are on the rise. Analyzing large datasets with AI can help humanity…
Share this:


Tuberculosis is the world’s deadliest bacterial infection. It afflicted over 10 million people and took 1.3 million lives in 2022. These numbers are predicted to increase dramatically because of the spread of multidrug-resistant TB.
Why does one TB patient recover from the infection while another succumbs? And why does one drug work in one patient but not another, even if they have the same disease?
People have been battling TB for millennia. For example, researchers have found Egyptian mummies from 2400 BCE that show signs of TB. While TB infections occur worldwide, the countries with the highest number of multidrug-resistant TB cases are Ukraine, Moldova, Belarus and Russia.
Researchers predict that the ongoing war in Ukraine will result in an increase in multidrug-resistant TB cases because of health care disruptions. Additionally, the COVID-19 pandemic reduced access to TB diagnosis and treatment, reversing decades of progress worldwide.
Rapidly and holistically analyzing available medical data can help optimize treatments for each patient and reduce drug resistance. In our recently published research, my team and I describe a new AI tool we developed that uses worldwide patient data to guide more personalized and effective treatment of TB.
Predicting success or failure
My team and I wanted to identify what variables can predict how a patient responds to TB treatment. So we analyzed more than 200 types of clinical test results, medical imaging and drug prescriptions from over 5,000 TB patients in 10 countries. We examined demographic information such as age and gender, prior treatment history and whether patients had other conditions. Finally, we also analyzed data on various TB strains, such as what drugs the pathogen is resistant to and what genetic mutations the pathogen had.
Looking at enormous datasets like these can be overwhelming. Even most existing AI tools have had difficulty analyzing large datasets. Prior studies using AI have focused on a single data type – such as imaging or age alone – and had limited success predicting TB treatment outcomes.
We used an approach to AI that allowed us to analyze a large and diverse number of variables simultaneously and identify their relationship to TB outcomes. Our AI model was transparent, meaning we can see through its inner workings to identify the most meaningful clinical features. It was also multimodal, meaning it could interpret different types of data at the same time.

Once we trained our AI model on the dataset, we found that it could predict treatment prognosis with 83% accuracy on newer, unseen patient data and outperform existing AI models. In other words, we could feed a new patient’s information into the model and the AI would determine whether a specific type of treatment will either succeed or fail.
We observed that clinical features related to nutrition, particularly lower BMI, are associated with treatment failure. This supports the use of interventions to improve nourishment, as TB is typically more prevalent in undernourished populations.
We also found that certain drug combinations worked better in patients with certain types of drug-resistant infections but not others, leading to treatment failure. Combining drugs that are synergistic, meaning they enhance each other’s potency in the lab, could result in better outcomes. Given the complex environment in the body compared with conditions in the lab, it has so far been unclear whether synergistic relationships between drugs in the lab hold up in the clinic. Our results suggest that using AI to weed out antagonistic drugs, or drugs that inhibit or counteract each other, early in the drug discovery process can avoid treatment failures down the line.
Ending TB with the help of AI
Our findings may help researchers and clinicians meet the World Health Organization’s goal to end TB by 2035, by highlighting the relative importance of different types of clinical data. This can help prioritize public health efforts to mitigate TB.
While the performance of our AI tool is promising, it isn’t perfect in every case, and more training is needed before it can be used in the clinic. Demographic diversity can be high within a country and may even vary between hospitals. We are working to make this tool more generalizable across regions.
Our goal is to eventually tailor our AI model to identify drug regimens suitable for individuals with certain conditions. Instead of a one-size-fits-all treatment approach, we hope that studying multiple types of data can help physicians personalize treatments for each patient to provide the best outcomes.
Sriram Chandrasekaran receives funding from the US National Institutes of Health.
treatment genetic pandemic covid-19 spread russia ukraine world health organizationGovernment
QE By A Different Name Is Still QE
The Fed added Quantitative Easing (QE) to its monetary policy toolbox in 2008. At the time, the financial system was imploding. Fed Chair Ben Bernanke…
Share this:


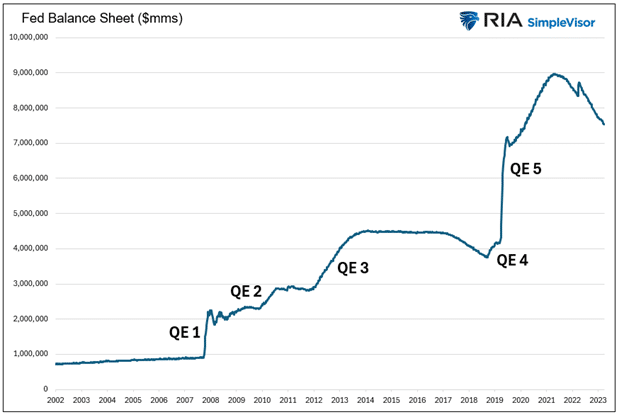
The Fed added Quantitative Easing (QE) to its monetary policy toolbox in 2008. At the time, the financial system was imploding. Fed Chair Ben Bernanke bought $1.5 trillion U.S. Treasury and mortgage-backed securities to staunch a financial disaster. The drastic action was sold to the public as a one-time, emergency operation to stabilize the banking system and economy. Since the initial round of QE, there have been four additional rounds, culminating with the mind-boggling $5 trillion operation in 2020 and 2021.
QE is no longer a tool for handling a crisis. It has morphed into a policy to ensure the government can fund itself. However, as we are learning today, QE has its faults. For example, it’s not an appropriate policy in times of high inflation like we have.
That doesn’t mean the Fed can’t provide liquidity to help the Treasury fund the government’s deficits. They just need to be more creative. To that end, rumors are floating around that a new variation of QE will help bridge potential liquidity shortfalls.
The Sad Fiscal Situation
The Federal government now pays over $1 trillion in interest expenses annually. Before they spend a dime on the military, social welfare, or the tens of thousands of other expenditures, one-third of the government’s tax revenue pays for the interest on the $34 trillion in debt, representing deficits of years and decades past.
There are many ways to address deficits and overwhelming debt, such as spending cuts or higher taxes. While logical approaches, politicians favor more debt. Let’s face it: winning an election on the promise of spending cuts and tax increases is hard. It’s even harder to keep your seat in Congress if you try to enact such changes.
More recently, the Federal Reserve has been forced to help fund today’s deficits and those of years past. We can debate the merits of such irresponsible behavior all day, but for investors, it’s much more critical to assess how the Fed and Treasury might keep the debt scheme going when QE is not an option.
Borrowing For Deficits
Before spreading rumors about a new variation of QE, let’s review the problem. The graph below shows the widening gap between federal spending and tax receipts. Literally, the gap between the two lines amounts to the cumulative Federal deficit. Instead of plotting deficit data, we prefer outstanding total federal debt as it better represents the cumulative onus of deficits.

The graph below shows the Treasury debt has grown annually for the last 57 years by about 1.5% more than the interest expense. Such may not seem like a lot, but 57 years of compounding makes a big difference.
Declining interest rates for the last 40+ years are to thank for the differential. The green line shows the effective interest rate has steadily dropped until recently. Even with the current instance of higher interest rates, the effective interest rate is only 3.00%.

Fiscal Dominance
The Fed has been increasingly pressed to help the U.S. Treasury maintain the ability to fund its debt at reasonable interest rates. In addition to presiding over lower-than-normal interest rates for the last 30 years, QE helps the cause. By removing Treasury and mortgage-backed securities from the market, the market can more easily absorb new Treasury issuance.
Fiscal dominance, as we are experiencing, occurs when monetary policy helps the Treasury fund its debts. Per The CATO Institute:
Fiscal dominance occurs when central banks use their monetary powers to support the prices of government securities and to peg interest rates at low levels to reduce the costs of servicing sovereign debt.
2019 Revisited
In 2019, before the massive pandemic-related deficits, government spending ramped up over the prior few years due to higher spending and tax cuts. In September 2019, the repo markets strained under the pressure of the growing Treasury demands. The banks had plenty of securities but no cash to lend. For more information on the incident and the importance of liquidity in maintaining financial stability, please read our article, Liquidity Problems.
When a bank, broker, or investor can’t borrow money despite being willing to post U.S. Treasury collateral, that is a clear sign that the banking system lacks liquidity. That is exactly what happened in 2019.
The Fed came to the rescue, offering QE and lowering interest rates.
Shortly later, in March 2020, government spending blossomed with the pandemic, and the Fed was quick to help. As we shared earlier, the Fed, via QE, removed over $5 trillion of assets from the financial markets. That amount was on par with the surge of government debt.
The Fed is mandated to manage policy to achieve maximum employment and stable prices. Mandated or not, recent experiences demonstrate the Fed has become the de facto lender to the Treasury, albeit indirectly.
The Fed Is In Handcuffs
While Jerome Powell and the Fed might like to help the government meet their exorbitant funding needs with lower interest rates and QE, they are shackled. Higher inflation resulting from the pandemic and fiscal and monetary policies force them to reduce their balance sheet and keep rates abnormally high.
Unfortunately, as we wrote in Liquidity Problems, the issuance of Treasury debt rapidly drains excess liquidity from the system.
While the Fed hesitates to cut rates or do QE, they may have another trick up their sleeve.
Spreading Rumors
The following is based on rumors from numerous sources about what the Fed and banking regulators may do to alleviate funding pressures and liquidity shortfalls.
Banks have regulatory limits on the amount of leverage they can employ. The amount is set by the type and riskiness of assets they hold. For instance, U.S. Treasuries can be leveraged more than a loan to small businesses. A dollar of a bank deposit may allow a bank to buy $5 of a Treasury note but only lend $3 to a riskier borrower.
The regulatory structure currently recognizes eight Global Systematically Important Banks (GSIB). They are as follows: Bank of America, The Bank of New York, Citigroup, Goldman Sachs, JPMorgan Chase, Morgan Stanley, State Street, and Wells Fargo & Company.
Rumor has it that the regulators could eliminate leverage requirements for the GSIBs. Doing so would infinitely expand their capacity to own Treasury securities. That may sound like a perfect solution, but there are two problems: the banks must be able to fund the Treasury assets and avoid losing money on them.
BTFP To The Rescue Again
A year ago, the Fed created the Bank Term Funding Program (BTFP) to bail out banks with underwater securities. The program allowed banks to pledge underwater Treasury assets to the Fed. In exchange, the Fed would loan them money equal to the bond’s par value, even though the bonds were trading at discounts to par.
Remember, since 2008, banks no longer have to book gains or losses on assets unless they are impaired or sold.
In a new scheme, bank regulators could eliminate the need for GSIBs to hold capital against Treasury securities while the Fed reenacts some version of BTFP. Under such a regime, the banks could buy Treasury notes and fund them via the BTFP. If the borrowing rate is less than the bond yield, they make money and, therefore, should be very willing to participate, as there is potentially no downside.
The Fed still uses its balance sheet in this scheme, but it could sell it to the public as a non-inflationary action, as it did in March 2023 when the BTFP was introduced.
Summary
The federal government’s escalating debt and interest expenses underscore the challenges posed by prolonged deficit spending. The problem has forced the Fed to help the Treasury meet its burgeoning needs. The situation becomes more evident with each passing day.
The recently closed BTFP program and rumors about leverage requirements provide insight into how the Fed might accomplish this tall task while maintaining its hawkish anti-inflationary policy stance.
The post QE By A Different Name Is Still QE appeared first on RIA.
treasury securities bonds repo markets pandemic monetary policy qe fed federal reserve government debt congress interest rates

Google’s A.I. Fiasco Exposes Deeper Infowarp


Greenback Surges after BOJ Hikes and Ends YCC and RBA Delivers a Dovish Hold


Young People Aren’t Nearly Angry Enough About Government Debt


There Goes The Fed’s Inflation Target: Goldman Sees Terminal Rate 100bps Higher At 3.5%


Student loan borrowers may finally get answers to loan forgiveness issues


Report Criticizes ‘Catastrophic Errors’ Of COVID Lockdowns, Warns Of Repeat


Bolsonaro Indicted By Brazilian Police For Falsifying Covid-19 Vaccine Records


Gates-backed PhIII study tuberculosis vaccine study gets underway


Anti-Semitism As The Harbinger Of Global Chaos


QE By A Different Name Is Still QE
-

 Spread & Containment1 week ago
IFM’s Hat Trick and Reflections On Option-To-Buy M&A
-

 Uncategorized4 weeks ago
All Of The Elements Are In Place For An Economic Crisis Of Staggering Proportions
-

 International2 weeks ago
EyePoint poaches medical chief from Apellis; Sandoz CFO, longtime BioNTech exec to retire
-

 Uncategorized1 month ago
California Counties Could Be Forced To Pay $300 Million To Cover COVID-Era Program
-

 Uncategorized4 weeks ago
Apparel Retailer Express Moving Toward Bankruptcy
-

 Uncategorized1 month ago
Industrial Production Decreased 0.1% in January
-

 International2 weeks ago
Walmart launches clever answer to Target’s new membership program
-

 Uncategorized1 month ago
RFK Jr: The Wuhan Cover-Up & The Rise Of The Biowarfare-Industrial Complex