Southern First Reports Results for Second Quarter 2022
Southern First Reports Results for Second Quarter 2022
PR Newswire
GREENVILLE, S.C., July 26, 2022
GREENVILLE, S.C., July 26, 2022 /PRNewswire/ — Southern First Bancshares, Inc. (NASDAQ: SFST), holding company for Southern First Bank, today announ…
Share this:


Southern First Reports Results for Second Quarter 2022
PR Newswire
GREENVILLE, S.C., July 26, 2022
GREENVILLE, S.C., July 26, 2022 /PRNewswire/ -- Southern First Bancshares, Inc. (NASDAQ: SFST), holding company for Southern First Bank, today announced its financial results for the three-month period ended June 30, 2022.
"I am incredibly proud of the Southern First team as they generated significant new client relationships and record loan growth for the second quarter," stated Art Seaver, the company's Chief Executive Officer. "During this time of high inflation, rising interest rates, and the resulting transition in housing and mortgage, our team's efforts resulted in strong performance with solid growth in net interest income and book value."
2022 Second Quarter Highlights
- Net income was $7.2 million and diluted earnings per common share were $0.90 for Q2 2022
- Net interest income increased 16.1% to $24.9 million at Q2 2022, compared to $21.4 million at Q2 2021
- Total loans increased 26% to $2.8 billion at Q2 2022, compared to $2.3 billion at Q2 2021
- Total deposits increased 24% to $2.9 billion at Q2 2022, compared to $2.3 billion at Q2 2021
- Book value per common share increased to $35.39, or 11%, over Q2 2021
- Completed move to new headquarters in Greenville, South Carolina
Quarter Ended | ||||||
June 30 | March 31 | December 31 | September30 | June 30 | ||
2022 | 2022 | 2021 | 2021 | 2021 | ||
Earnings ($ in thousands, except per share data): | ||||||
Net income available to common shareholders | $ | 7,240 | 7,970 | 12,005 | 14,017 | 10,323 |
Earnings per common share, diluted | 0.90 | 0.98 | 1.49 | 1.75 | 1.29 | |
Total revenue(1) | 27,149 | 26,091 | 26,194 | 26,411 | 25,052 | |
Net interest margin (tax-equivalent)(2) | 3.35 % | 3.37 % | 3.35 % | 3.38 % | 3.50 % | |
Return on average assets(3) | 0.92 % | 1.10 % | 1.66 % | 2.03 % | 1.61 % | |
Return on average equity(3) | 10.31 % | 11.60 % | 17.61 % | 21.67 % | 16.96 % | |
Efficiency ratio(4) | 58.16 % | 56.28 % | 56.25 % | 53.15 % | 53.87 % | |
Noninterest expense to average assets (3) | 2.02 % | 2.03 % | 2.06 % | 2.06 % | 2.10 % | |
Balance Sheet ($ in thousands): | ||||||
Total loans(5) | $ | 2,845,205 | 2,660,675 | 2,489,877 | 2,389,047 | 2,254,135 |
Total deposits | 2,870,158 | 2,708,174 | 2,563,826 | 2,433,018 | 2,310,892 | |
Core deposits(6) | 2,588,283 | 2,541,113 | 2,479,412 | 2,367,841 | 2,220,577 | |
Total assets | 3,287,663 | 3,073,234 | 2,925,548 | 2,784,176 | 2,650,183 | |
Book value per common share | 35.39 | 34.90 | 35.07 | 33.57 | 31.86 | |
Loans to deposits | 99.13 % | 98.25 % | 97.12 % | 98.19 % | 97.54 % | |
Holding Company Capital Ratios(7): | ||||||
Total risk-based capital ratio | 13.97 % | 14.37 % | 14.90 % | 14.88 % | 14.98 % | |
Tier 1 risk-based capital ratio | 11.83 % | 12.18 % | 12.65 % | 12.59 % | 12.63 % | |
Leverage ratio | 9.71 % | 10.12 % | 10.18 % | 10.20 % | 10.27 % | |
Common equity tier 1 ratio(8) | 11.33 % | 11.65 % | 12.09 % | 12.00 % | 12.00 % | |
Tangible common equity(9) | 8.60 % | 9.06 % | 9.50 % | 9.54 % | 9.50 % | |
Asset Quality Ratios: | ||||||
Nonperforming assets/ total assets | 0.09 % | 0.15 % | 0.17 % | 0.50 % | 0.27 % | |
Classified assets/tier one capital plus allowance for credit losses | 7.29 % | 7.83 % | 12.61 % | 14.90 % | 13.36 % | |
Loans 30 days or more past due/ loans(5) | 0.10 % | 0.13 % | 0.09 % | 0.49 % | 0.14 % | |
Net charge-offs (recoveries)/average loans(5) (YTD annualized) | 0.02 % | 0.00 % | 0.06 % | (0.01 %) | 0.00 % | |
Allowance for credit losses/loans(5) | 1.20 % | 1.24 % | 1.22 % | 1.51 % | 1.86 % | |
Allowance for credit losses/nonaccrual loans | 1,166.70 % | 726.88 % | 625.16 % | 259.95 % | 619.47 % | |
[Footnotes to table located on page 6] | ||||||
INCOME STATEMENTS – Unaudited | ||||||
Quarter Ended | ||||||
June 30 | Mar 31 | Dec 31 | Sept 30 | Jun 30 | ||
(in thousands, except per share data) | 2022 | 2022 | 2021 | 2021 | 2021 | |
Interest income | ||||||
Loans | $ | 26,610 | 23,931 | 23,661 | 23,063 | 22,409 |
Investment securities | 448 | 474 | 410 | 355 | 269 | |
Federal funds sold | 180 | 59 | 66 | 68 | 53 | |
Total interest income | 27,238 | 24,464 | 24,137 | 23,486 | 22,731 | |
Interest expense | ||||||
Deposits | 1,844 | 908 | 900 | 934 | 920 | |
Borrowings | 510 | 392 | 380 | 380 | 381 | |
Total interest expense | 2,354 | 1,300 | 1,280 | 1,314 | 1,301 | |
Net interest income | 24,884 | 23,164 | 22,857 | 22,172 | 21,430 | |
Provision (reversal) for credit losses | 1,775 | 1,105 | (4,200) | (6,000) | (1,900) | |
Net interest income after provision for credit losses | 23,109 | 22,059 | 27,057 | 28,172 | 23,330 | |
Noninterest income | ||||||
Mortgage banking income | 1,184 | 1,494 | 1,931 | 2,829 | 1,983 | |
Service fees on deposit accounts | 209 | 191 | 200 | 199 | 173 | |
ATM and debit card income | 563 | 528 | 560 | 542 | 521 | |
Income from bank owned life insurance | 315 | 315 | 312 | 321 | 331 | |
Net lender and referral fees on PPP loans | - | 44 | - | - | 268 | |
Loss on disposal of fixed assets | (394) | - | - | - | - | |
Other income | 388 | 355 | 334 | 348 | 346 | |
Total noninterest income | 2,265 | 2,927 | 3,337 | 4,239 | 3,622 | |
Noninterest expense | ||||||
Compensation and benefits | 9,915 | 9,456 | 9,208 | 9,064 | 8,724 | |
Occupancy | 2,219 | 1,778 | 2,081 | 1,685 | 1,552 | |
Outside service and data processing costs | 1,528 | 1,533 | 1,395 | 1,368 | 1,391 | |
Insurance | 367 | 260 | 342 | 244 | 262 | |
Professional fees | 693 | 599 | 682 | 694 | 615 | |
Marketing | 329 | 269 | 260 | 248 | 208 | |
Other | 737 | 790 | 767 | 736 | 743 | |
Total noninterest expenses | 15,788 | 14,685 | 14,735 | 14,039 | 13,495 | |
Income before provision for income taxes | 9,586 | 10,301 | 15,659 | 18,372 | 13,457 | |
Income tax expense | 2,346 | 2,331 | 3,654 | 4,355 | 3,134 | |
Net income available to common shareholders | $ | 7,240 | 7,970 | 12,005 | 14,017 | 10,323 |
Earnings per common share – Basic | $ | 0.91 | 1.00 | 1.52 | 1.78 | 1.32 |
Earnings per common share – Diluted | 0.90 | 0.98 | 1.49 | 1.75 | 1.29 | |
Basic weighted average common shares | 7,945 | 7,932 | 7,877 | 7,874 | 7,848 | |
Diluted weighted average common shares | 8,075 | 8,096 | 8,057 | 8,001 | 7,988 | |
[Footnotes to table located on page 6] | ||||||
Net income for the second quarter of 2022 was $7.2 million, or $0.90 per diluted share, a $731 thousand decrease from the first quarter of 2022 and a $3.1 million decrease from the second quarter of 2021. The decrease in net income was driven by an increase in noninterest expenses, as well as an increased provision for credit losses and a decrease in mortgage banking income. Net interest income increased $1.7 million, or 7.4%, for the second quarter of 2022, compared with the first quarter of 2022, and increased $3.5 million, or 16.1%, compared to the second quarter of 2021. The increase in net interest income was driven by $184.5 million of loan growth during the second quarter of 2022.
The provision for credit losses was $1.8 million for the second quarter of 2022, compared to $1.1 million for the first quarter of 2022 and a negative provision of $1.9 million for the second quarter of 2021. The provision expense during the second quarter of 2022, calculated under the new CECL methodology, includes a $1.5 million provision for loan losses and a $250,000 provision for unfunded commitments, compared to a reversal in the provision during the second quarter of 2022 as the economy showed improvement after the onset of the pandemic.
Noninterest income totaled $2.3 million for the second quarter of 2022, a $662 thousand decrease from the first quarter of 2022 and a $1.4 million decrease from the second quarter of 2021. As the largest component of our noninterest income, mortgage banking income was the driving factor in the change in noninterest income from the prior quarter and the prior year due to lower mortgage origination volume during the past 12 months. In addition, we recorded a loss on disposal of assets during the second quarter of 2022 as we completed construction and relocated to our new headquarters building in Greenville, South Carolina.
Noninterest expense for the second quarter of 2022 was $15.8 million, or a $1.1 million increase from the first quarter of 2022, and a $2.3 million increase from the second quarter of 2021. Compensation and benefits expense increased from the prior periods due to hiring of new team members, combined with annual salary increases, while occupancy expense increased from the prior quarter and prior year due to costs associated with the relocation of our headquarters. Our insurance costs increased during the second quarter of 2022 related to higher FDIC insurance premiums, while the increase in professional fees related to higher legal, consulting and appraisal fees.
Our effective tax rate was 24.5% for the second quarter of 2022, 22.6% for the first quarter of 2022, and 23.3% for the second quarter of 2021. The higher tax rate in the second quarter of 2022 relates to the lesser impact of equity compensation transactions on our tax rate during the quarter.
NET INTEREST INCOME AND MARGIN - Unaudited | ||||||||||
For the Three Months Ended | ||||||||||
June 30, 2022 | March 31, 2022 | June 30, 2021 | ||||||||
(dollars in thousands) | Average | Income/ | Yield/ | Average | Income/ | Yield/ | Average | Income/ | Yield/ | |
Interest-earning assets | ||||||||||
Federal funds sold and interest-bearing deposits | $ 80,909 | $ 180 | 0.89 % | $ 89,096 | $ 59 | 0.27 % | $ 119,211 | $ 53 | 0.18 % | |
Investment securities, taxable | 98,527 | 404 | 1.64 % | 113,101 | 425 | 1.52 % | 85,306 | 212 | 1.00 % | |
Investment securities, nontaxable(2) | 10,382 | 56 | 2.16 % | 11,899 | 64 | 2.17 % | 11,599 | 74 | 2.56 % | |
Loans(10) | 2,795,274 | 26,610 | 3.82 % | 2,573,978 | 23,931 | 3.77 % | 2,240,236 | 22,409 | 4.01 % | |
Total interest-earning assets | 2,985,092 | 27,250 | 3.66 % | 2,788,074 | 24,479 | 3.56 % | 2,456,352 | 22,748 | 3.71 % | |
Noninterest-earning assets | 154,659 | 152,565 | 117,836 | |||||||
Total assets | $3,139,751 | $2,940,639 | $2,574,188 | |||||||
Interest-bearing liabilities | ||||||||||
NOW accounts | $ 389,563 | 144 | 0.15 % | $ 406,054 | 115 | 0.11 % | $ 298,446 | 46 | 0.06 % | |
Savings & money market | 1,267,174 | 1,200 | 0.38 % | 1,242,225 | 618 | 0.20 % | 1,131,391 | 580 | 0.21 % | |
Time deposits | 278,101 | 500 | 0.72 % | 158,720 | 175 | 0.45 % | 175,612 | 294 | 0.67 % | |
Total interest-bearing deposits | 1,934,838 | 1,844 | 0.38 % | 1,806,999 | 908 | 0.20 % | 1,605,449 | 920 | 0.23 % | |
FHLB advances and other borrowings | 53,179 | 105 | 0.79 % | 16,626 | 12 | 0.29 % | 44 | 2 | 18.23 % | |
Subordinated debentures | 36,143 | 405 | 4.49 % | 36,116 | 380 | 4.27 % | 36,035 | 379 | 4.22 % | |
Total interest-bearing liabilities | 2,024,160 | 2,354 | 0.47 % | 1,859,741 | 1,300 | 0.28 % | 1,641,528 | 1,301 | 0.32 % | |
Noninterest-bearing liabilities | 833,943 | 802,299 | 688,576 | |||||||
Shareholders' equity | 281,648 | 278,600 | 244,084 | |||||||
Total liabilities and shareholders' equity | $3,139,751 | $2,940,639 | $2,574,188 | |||||||
Net interest spread | 3.19 % | 3.28 % | 3.39 % | |||||||
Net interest income (tax equivalent) / margin | $24,896 | 3.35 % | $23,179 | 3.37 % | $21,447 | 3.50 % | ||||
Less: tax-equivalent adjustment(2) | 12 | 15 | 17 | |||||||
Net interest income | $24,884 | $23,164 | $21,430 | |||||||
[Footnotes to table located on page 6] | ||||||||||
Net interest income was $24.9 million for the second quarter of 2022, a $1.7 million increase from the first quarter of 2022, resulting primarily from a $2.8 million increase in interest income, on a tax-equivalent basis, partially offset by a $1.1 million increase in interest expense. The increase in interest income was driven by $221.3 million growth in average loan balances at an average rate of 3.82%, five basis points higher than the previous quarter. In comparison to the second quarter of 2021, net interest income increased $3.5 million, resulting primarily from $555.0 million growth in average loan balances during the 2022 period, despite a 19-basis point decrease in loan yield. Our net interest margin, on a tax-equivalent basis, was 3.35% for the second quarter of 2022, a two-basis point decrease from 3.37% for the first quarter of 2022, and a 15-basis point decrease from 3.50% for the second quarter of 2021. Reduced rates on our interest-earning assets, combined with higher costs on our interest-bearing liabilities, resulted in the lower net interest margin during the second quarter of 2022 in comparison to the second quarter of 2021.
BALANCE SHEETS - Unaudited | ||||||||
Ending Balance | ||||||||
June 30 | March 31 | December 31 | September 30 | June 30 | ||||
(in thousands, except per share data) | 2022 | 2022 | 2021 | 2021 | 2021 | |||
Assets | ||||||||
Cash and cash equivalents: | ||||||||
Cash and due from banks | $ | 21,090 | 20,992 | 21,770 | 17,944 | 17,093 | ||
Federal funds sold | 124,462 | 95,093 | 86,882 | 47,440 | 75,327 | |||
Interest-bearing deposits with banks | 36,538 | 33,131 | 58,557 | 63,149 | 61,377 | |||
Total cash and cash equivalents | 182,090 | 149,216 | 167,209 | 128,533 | 153,797 | |||
Investment securities: | ||||||||
Investment securities available for sale | 98,991 | 106,978 | 120,281 | 113,802 | 91,232 | |||
Other investments | 5,065 | 4,104 | 4,021 | 2,820 | 2,770 | |||
Total investment securities | 104,056 | 111,082 | 124,302 | 116,622 | 94,002 | |||
Mortgage loans held for sale | 18,329 | 17,840 | 13,556 | 31,641 | 36,427 | |||
Loans (5) | 2,845,205 | 2,660,675 | 2,489,877 | 2,389,047 | 2,254,135 | |||
Less allowance for credit losses | (34,192) | (32,944) | (30,408) | (36,075) | (41,912) | |||
Loans, net | 2,811,013 | 2,627,731 | 2,459,469 | 2,352,972 | 2,212,223 | |||
Bank owned life insurance | 50,463 | 50,148 | 49,833 | 49,521 | 49,200 | |||
Property and equipment, net | 96,674 | 95,129 | 92,370 | 78,456 | 69,193 | |||
Deferred income taxes | 15,078 | 10,635 | 8,397 | 16,591 | 25,025 | |||
Other assets | 9,960 | 10,859 | 10,412 | 9,840 | 10,316 | |||
Total assets | $ | 3,287,663 | 3,072,640 | 2,925,548 | 2,784,176 | 2,650,183 | ||
Liabilities | ||||||||
Deposits | $ | 2,870,158 | 2,708,174 | 2,563,826 | 2,433,018 | 2,310,892 | ||
FHLB Advances | 50,000 | - | - | - | - | |||
Subordinated debentures | 36,160 | 36,133 | 36,106 | 36,079 | 36,052 | |||
Other liabilities | 48,708 | 49,809 | 47,715 | 49,450 | 51,580 | |||
Total liabilities | 3,005,026 | 2,794,116 | 2,647,647 | 2,518,547 | 2,398,524 | |||
Shareholders' equity | ||||||||
Preferred stock - $.01 par value; 10,000,000 shares authorized | - | - | - | - | - | |||
Common Stock - $.01 par value; 10,000,000 shares authorized | 80 | 80 | 79 | 79 | 79 | |||
Nonvested restricted stock | (3,230) | (3,425) | (1,435) | (1,469) | (1,173) | |||
Additional paid-in capital | 117,714 | 117,286 | 114,226 | 113,501 | 112,604 | |||
Accumulated other comprehensive income (loss) | (10,143) | (6,393) | (740) | (248) | 400 | |||
Retained earnings | 178,216 | 170,976 | 165,771 | 153,766 | 139,749 | |||
Total shareholders' equity | 282,637 | 278,524 | 277,901 | 265,629 | 251,659 | |||
Total liabilities and shareholders' equity | $ | 3,287,663 | 3,072,640 | 2,925,548 | 2,784,176 | 2,650,183 | ||
Common Stock | ||||||||
Book value per common share | $ | 35.39 | 34.90 | 35.07 | 33.57 | 31.86 | ||
Stock price: | ||||||||
High | 50.09 | 65.02 | 64.73 | 53.50 | 55.26 | |||
Low | 42.25 | 50.84 | 52.73 | 48.62 | 47.61 | |||
Period end | 43.59 | 50.84 | 62.49 | 53.50 | 51.16 | |||
Common shares outstanding | 7,986 | 7,981 | 7,925 | 7,913 | 7,900 | |||
[Footnotes to table located on page 6] | ||||||||
ASSET QUALITY MEASURES - Unaudited | ||||||
Quarter Ended | ||||||
June 30 | March 31 | December 31 | September 30 | June 30 | ||
(dollars in thousands) | 2022 | 2022 | 2021 | 2021 | 2021 | |
Nonperforming Assets | ||||||
Commercial | ||||||
Non-owner occupied RE | $ | 259 | 265 | 270 | 7,400 | 1,048 |
Commercial business | - | - | - | 1,469 | 37 | |
Consumer | ||||||
Real estate | 183 | 739 | 989 | 1,461 | 2,372 | |
Home equity | 200 | 815 | 653 | 818 | 426 | |
Nonaccruing troubled debt restructurings | 2,289 | 2,713 | 2,952 | 2,730 | 2,883 | |
Total nonaccrual loans | 2,931 | 4,532 | 4,864 | 13,878 | 6,766 | |
Other real estate owned | - | - | - | - | 366 | |
Total nonperforming assets | $ | 2,931 | 4,532 | 4,864 | 13,878 | 7,132 |
Nonperforming assets as a percentage of: | ||||||
Total assets | 0.09 % | 0.15 % | 0.17 % | 0.50 % | 0.27 % | |
Total loans | 0.10 % | 0.17 % | 0.20 % | 0.58 % | 0.32 % | |
Accruing troubled debt restructurings (TDRs) | $ | 3,558 | 3,241 | 3,299 | 4,044 | 4,622 |
Classified assets/tier 1 capital plus allowance for credit losses | 7.29 % | 7.83 % | 12.61 % | 14.90 % | 13.36 % | |
Quarter Ended | ||||||
June 30 | March 31 | December 31 | September30 | June 30 | ||
(dollars in thousands) | 2022 | 2022 | 2021 | 2021 | 2021 | |
Allowance for Credit Losses | ||||||
Balance, beginning of period | $ | 32,944 | 30,408 | 36,075 | 41,912 | 43,499 |
CECL adjustment | - | 1,500 | - | - | - | |
Loans charged-off | (316) | (169) | (1,509) | (243) | (8) | |
Recoveries of loans previously charged-off | 39 | 180 | 42 | 406 | 321 | |
Net loans (charged-off) recovered | (277) | 11 | (1,467) | 163 | 313 | |
Provision for credit losses | 1,525 | 1,025 | (4,200) | (6,000) | (1,900) | |
Balance, end of period | $ | 34,192 | 32,944 | 30,408 | 36,075 | 41,912 |
Allowance for credit losses to gross loans | 1.20 % | 1.24 % | 1.22 % | 1.51 % | 1.86 % | |
Allowance for credit losses to nonaccrual loans | 1,166.70 % | 726.88 % | 625.22 % | 259.95 % | 619.47 % | |
Net charge-offs to average loans QTD (annualized) | 0.04 % | 0.00 % | 0.24 % | (0.03 %) | (0.06 %) | |
Total nonperforming assets decreased by $1.6 million to $2.9 million for the second quarter of 2022, representing 0.09% of total assets, compared to 0.15% in the first quarter of 2022. The allowance for credit losses as a percentage of nonaccrual loans was 1,166.7% on June 30, 2022, compared to 726.9% on March 31, 2022 and 619.5% on June 30, 2021. During the second quarter of 2022, our classified asset ratio improved to 7.29%. The improvement over the second quarter of 2021 was primarily the result of five, or $14.1 million in the aggregate, hotel loans we upgraded from substandard during the first quarter of 2022.
Effective January 1, 2022, we early adopted the Current Expected Credit Loss ("CECL") methodology for estimating credit losses, which resulted in an increase of $1.5 million to our allowance for credit losses and an increase of $2.0 million to our reserve for unfunded commitments. The tax-effected impact of these two items totaled $2.8 million and was recorded as an adjustment to our retained earnings as of January 1, 2022.
On June 30, 2022, the allowance for credit losses was $34.2 million, or 1.20% of total loans, compared to $32.9 million, or 1.24% of total loans, at March 31, 2022, and $41.9 million, or 1.86% of total loans, at June 30, 2021. We had net charge-offs of $277 thousand, or 0.04% annualized, for the second quarter of 2022 compared to net recoveries of $11 thousand for the first quarter of 2022. Net recoveries were $313 thousand for the second quarter of 2021. There was a provision for credit losses of $1.5 million for the second quarter of 2022 compared to a provision of $1.0 million for the first quarter of 2022 and a reversal of $1.9 million for the second quarter of 2021.
LOAN COMPOSITION - Unaudited | ||||||
Quarter Ended | ||||||
June 30 | March 31 | December 31 | September30 | June 30 | ||
(dollars in thousands) | 2022 | 2022 | 2021 | 2021 | 2021 | |
Commercial | ||||||
Owner occupied RE | $ | 551,544 | 527,776 | 488,965 | 470,614 | 452,130 |
Non-owner occupied RE | 741,263 | 705,811 | 666,833 | 628,521 | 600,094 | |
Construction | 84,612 | 75,015 | 64,425 | 87,892 | 60,786 | |
Business | 389,790 | 352,932 | 333,049 | 307,969 | 307,933 | |
Total commercial loans | 1,767,209 | 1,661,534 | 1,553,272 | 1,494,996 | 1,420,943 | |
Consumer | ||||||
Real estate | 812,130 | 745,667 | 694,401 | 648,276 | 605,026 | |
Home equity | 161,512 | 155,678 | 154,839 | 155,049 | 149,789 | |
Construction | 76,878 | 72,627 | 59,846 | 57,419 | 48,077 | |
Other | 27,476 | 25,169 | 27,519 | 33,307 | 30,300 | |
Total consumer loans | 1,077,996 | 999,141 | 936,605 | 894,051 | 833,192 | |
Total gross loans, net of deferred fees | 2,845,205 | 2,660,675 | 2,489,877 | 2,389,047 | 2,254,135 | |
Less—allowance for credit losses | (34,192) | (32,944) | (30,408) | (36,075) | (41,912) | |
Total loans, net | $ | 2,811,013 | 2,627,731 | 2,459,469 | 2,352,972 | 2,212,223 |
DEPOSIT COMPOSITION - Unaudited | ||||||
Quarter Ended | ||||||
June 30 | March 31 | December 31 | September30 | June 30 | ||
(dollars in thousands) | 2022 | 2022 | 2021 | 2021 | 2021 | |
Non-interest bearing | $ | 799,169 | 779,262 | 768,650 | 720,444 | 658,758 |
Interest bearing: | ||||||
NOW accounts | 364,189 | 416,322 | 401,788 | 331,167 | 316,744 | |
Money market accounts | 1,320,329 | 1,238,866 | 1,201,099 | 1,188,666 | 1,136,315 | |
Savings | 41,944 | 41,630 | 39,696 | 34,018 | 33,442 | |
Time, less than $250,000 | 62,340 | 57,972 | 61,122 | 65,177 | 68,022 | |
Time and out-of-market deposits, $250,000 and over | 282,187 | 174,122 | 91,471 | 93,546 | 97,611 | |
Total deposits | $ | 2,870,158 | 2,708,174 | 2,563,826 | 2,433,018 | 2,310,892 |
Footnotes to tables: | |
(1) Total revenue is the sum of net interest income and noninterest income. | |
(2) The tax-equivalent adjustment to net interest income adjusts the yield for assets earning tax-exempt income to a comparable yield on a taxable basis. | |
(3) Annualized for the respective three-month period. | |
(4) Noninterest expense divided by the sum of net interest income and noninterest income. | |
(5) Excludes mortgage loans held for sale. | |
(6) Excludes out of market deposits and time deposits greater than $250,000. | |
(7) June 30, 2022 ratios are preliminary. | |
(8) The common equity tier 1 ratio is calculated as the sum of common equity divided by risk-weighted assets. | |
(9) The tangible common equity ratio is calculated as total equity less preferred stock divided by total assets. | |
(10) Includes mortgage loans held for sale. | |
ABOUT SOUTHERN FIRST BANCSHARES
Southern First Bancshares, Inc., Greenville, South Carolina is a registered bank holding company incorporated under the laws of South Carolina. The company's wholly owned subsidiary, Southern First Bank, is the largest bank headquartered in South Carolina. Southern First Bank has been providing financial services since 1999 and now operates in 12 locations in the Greenville, Columbia, and Charleston markets of South Carolina as well as the Charlotte, Triangle and Triad regions of North Carolina and Atlanta, Georgia. Southern First Bancshares has consolidated assets of approximately $3.3 billion and its common stock is traded on The NASDAQ Global Market under the symbol "SFST." More information can be found at www.southernfirst.com.
FORWARD-LOOKING STATEMENTS
Certain statements in this news release contain "forward-looking statements" within the meaning of the Private Securities Litigation Reform Act of 1995, such as statements relating to future plans and expectations, and are thus prospective. Such forward-looking statements are identified by words such as "believe," "expect," "anticipate," "estimate," "intend," "plan," "target," and "project," as well as similar expressions. Such statements are subject to risks, uncertainties, and other factors which could cause actual results to differ materially from future results expressed or implied by such forward-looking statements. Although we believe that the assumptions underlying the forward-looking statements are reasonable, any of the assumptions could prove to be inaccurate. Therefore, we can give no assurance that the results contemplated in the forward-looking statements will be realized. The inclusion of this forward-looking information should not be construed as a representation by our company or any person that the future events, plans, or expectations contemplated by our company will be achieved.
The following factors, among others, could cause actual results to differ materially from the anticipated results or other expectations expressed in the forward-looking statements: (1) competitive pressures among depository and other financial institutions may increase significantly and have an effect on pricing, spending, third-party relationships and revenues; (2) the strength of the United States economy in general and the strength of the local economies in which the company conducts operations may be different than expected; (3) the rate of delinquencies and amounts of charge-offs, the level of allowance for credit loss, the rates of loan growth, or adverse changes in asset quality in our loan portfolio, which may result in increased credit risk-related losses and expenses; (4) changes in legislation, regulation, policies, or administrative practices, whether by judicial, governmental, or legislative action, including, but not limited to, changes affecting oversight of the financial services industry or consumer protection; (5) the impact of changes to the U.S. presidential administration and Congress on the regulatory landscape and capital markets; (6) adverse conditions in the stock market, the public debt market and other capital markets (including changes in interest rate conditions) could have a negative impact on the company; (7) changes in interest rates, which may affect the company's net income, interest expense, prepayment penalty income, mortgage banking income, and other future cash flows, or the market value of the company's assets, including its investment securities; and (8) changes in accounting principles, policies, practices, or guidelines. Additional factors that could cause our results to differ materially from those described in the forward-looking statements can be found in our reports (such as Annual Reports on Form 10-K, Quarterly Reports on Form 10-Q and Current Reports on Form 8-K) filed with the SEC and available at the SEC's Internet site (http://www.sec.gov). All subsequent written and oral forward-looking statements concerning the company or any person acting on its behalf is expressly qualified in its entirety by the cautionary statements above. We do not undertake any obligation to update any forward-looking statement to reflect circumstances or events that occur after the date the forward-looking statements are made, except as required by law.
FINANCIAL CONTACT: MIKE DOWLING 864-679-9070
MEDIA CONTACT: ART SEAVER 864-679-9010
WEB SITE: www.southernfirst.com
View original content to download multimedia:https://www.prnewswire.com/news-releases/southern-first-reports-results-for-second-quarter-2022-301593432.html
SOURCE Southern First Bancshares, Inc.
Spread & Containment
You can now enter this country without a passport
Singapore has been on a larger push to speed up the flow of tourists with digital immigration clearance.
Share this:


In the fall of 2023, the city-state of Singapore announced that it was working on end-to-end biometrics that would allow travelers passing through its Changi Airport to check into flights, drop off bags and even leave and exit the country without a passport.
The latter is the most technologically advanced step of them all because not all countries issue passports with the same biometrics while immigration laws leave fewer room for mistakes about who enters the country.
Related: A country just went visa-free for visitors with any passport
That said, Singapore is one step closer to instituting passport-free travel by testing it at its land border with Malaysia. The two countries have two border checkpoints, Woodlands and Tuas, and as of March 20 those entering in Singapore by car are able to show a QR code that they generate through the government’s MyICA app instead of the passport.
Here is who is now able to enter Singapore passport-free
The latter will be available to citizens of Singapore, permanent residents and tourists who have already entered the country once with their current passport. The government app pulls data from one's passport and shows the border officer the conditions of one's entry clearance already recorded in the system.
More Travel:
- A new travel term is taking over the internet (and reaching airlines and hotels)
- The 10 best airline stocks to buy now
- Airlines see a new kind of traveler at the front of the plane
While not truly passport-free since tourists still need to link a valid passport to an online system, the move is the first step in Singapore's larger push to get rid of physical passports.
"The QR code initiative allows travellers to enjoy a faster and more convenient experience, with estimated time savings of around 20 seconds for cars with four travellers, to approximately one minute for cars with 10 travellers," Singapore's Immigration and Checkpoints Authority wrote in a press release announcing the new feature. "Overall waiting time can be reduced by more than 30% if most car travellers use QR code for clearance."
More countries are looking at passport-free travel but it will take years to implement
The land crossings between Singapore and Malaysia can get very busy — government numbers show that a new post-pandemic record of 495,000 people crossed Woodlands and Tuas on the weekend of March 8 (the day before Singapore's holiday weekend.)
Even once Singapore implements fully digital clearance at all of its crossings, the change will in no way affect immigration rules since it's only a way of transferring the status afforded by one's nationality into a digital system (those who need a visa to enter Singapore will still need to apply for one at a consulate before the trip.) More countries are in the process of moving toward similar systems but due to the varying availability of necessary technology and the types of passports issued by different countries, the prospect of agent-free crossings is still many years away.
In the U.S., Chicago's O'Hare International Airport was chosen to take part in a pilot program in which low-risk travelers with TSA PreCheck can check into their flight and pass security on domestic flights without showing ID. The UK has also been testing similar digital crossings for British and EU citizens but no similar push for international travelers is currently being planned in the U.S.
stocks pandemic link testing singapore uk euSpread & Containment
The Virality Project’s Censorship Agenda
The Virality Project’s Censorship Agenda
Authored by Andrew Lowenthal via the Brownstone Institute,
In November 2023 Alex Gutentag and…
Share this:


Authored by Andrew Lowenthal via the Brownstone Institute,
In November 2023 Alex Gutentag and I reported on the Virality Project’s internal content-flagging system, as released by the US House Committee on the Weaponization of the Federal Government.
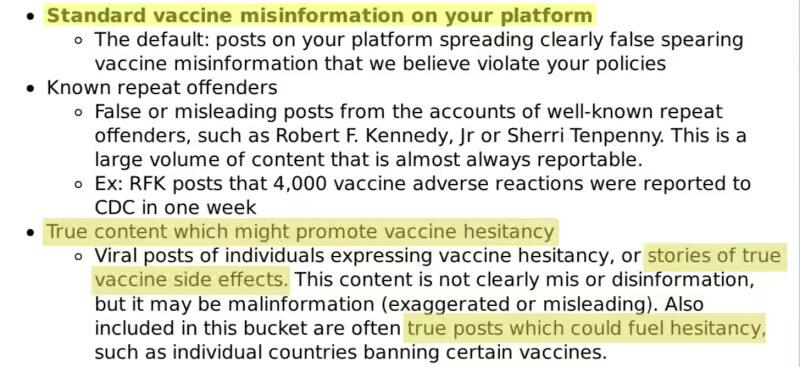
Initiated by the Department of Homeland Security (DHS) and the Cybersecurity and Infrastructure Security Agency (CISA) and led by the Stanford Internet Observatory (SIO), the Virality Project sought to censor those who questioned government Covid-19 policies. The Virality Project primarily focused on so-called “anti-vaccine” “misinformation;” however, my Twitter Files investigations with Matt Taibbi revealed this included “true stories of vaccine side effects.”
A further review of the content flagged by the Virality Project demonstrates how they pushed social media platforms to censor such “true stories.” This was often done incompetently and without even a cursory investigation of the original sources. In one instance, the Virality Project reporters told platforms that reports of a child injured in a vaccine trial were “false” due to the timing; citing the dates of a Moderna trial when in fact the child had been in a Pfizer trial.
Trigger-happy researchers-turned-activists at the Virality Project went further, alerting their Big Tech partners (including Facebook, Twitter, Instagram, and TikTok) of protests, jokes, and general dissent.
Led by former CIA fellow Renee DiResta, the Virality Project functioned as an intermediary for government censorship. Ties between the US government and the academic research center were extremely close. DHS had “fellows” embedded at the Stanford Internet Observatory, while SIO had interns embedded at CISA, and former DHS staff contributed to the Virality Project’s final report.
The Virality Project also had contact with the White House and the Office of the Surgeon General, described the CDC as a “partner” in its design documents, and the California Department of Public Health had a login to access the Jira content flagging system, as did CISA personnel.
Kris Krebs and Alex Stamos – former directors of CISA and SIO, respectively – became business partners soon after leaving their positions.
Norwood v. Harrison established that the government “may not induce, encourage or promote private persons to accomplish what it is constitutionally forbidden to accomplish.” Stamos knew this too and put it simply; the government “lacked the legal authorisation” and so they built a consortium to “fill the gap of the things the government could not do themselves.”
Judicial precedents regarding “joint participation” and “pervasive entwinement” between public and private entities make clear that the government cannot outsource to third parties like the Virality Project actions that would be illegal for the government itself to do.
The Virality Project had several unnamed partners that appear in the content-flagging system, including billion-dollar military contractor MITRE and a communications consultancy linked to the Democratic Party, Hattaway. Founder Doug Hattaway was an “advisor and spokesperson for Secretary of State Hillary Clinton, Vice President Al Gore, and Senate Majority Leader Tom Daschle, and provided strategic counsel to the Obama White House and the Democratic leadership of the US House and Senate.” Like the Virality Project, Hattaway worked with the Rockefeller Foundation during the pandemic on issues of disinformation.
The Virality Project does not declare any relationship with MITRE or Hattaway despite providing them access to their Jira system.
The Virality Project was partly funded by the Omidyar Network, which provided $400,000 to VP partner and Pentagon consultant Graphika. Much of the Virality Project’s funding however is unknown and is also not declared on their website.
This and much more have led five plaintiffs, including Harvard and Stanford professors, to accuse the US government of violations of the First Amendment with the Virality Project as one of the key proxies. On March 18, their case will be heard by the US Supreme Court.
The Virality Project and Murthy v. Missouri
The Murthy vs Missouri plaintiffs allege that, “CISA launched a colossal mass surveillance and mass-censorship project calling itself the “Election Integrity Partnership” (and later, the “Virality Project”). The Election Integrity Project (EIP) “monitored 859 million posts on Twitter alone.”
The Virality Project used the same Jira system as EIP for flagging content and included the same core public partners: SIO, the University of Washington Center for an Informed Public, the Atlantic Council’s Digital Forensic Research Lab, and Graphika, with the addition of NYU and the congressionally chartered National Conference on Citizenship.
The Virality Project had extensive contact not only with CISA but also with the White House and the Surgeon General. White House representatives sent direct censorship requests to Twitter including, “Hey folks – Wanted to flag the below tweet and am wondering if we can get moving on the process for having it removed ASAP.” And the more threatening:
“Are you guys fucking serious? I want an answer on what happened here and I want it today.”

Flaherty also conveyed that his communications came with the backing of the very top echelons of the administration: “This is a concern that is shared at the highest (and I mean highest) levels of the WH.”
The Virality Project hosted a launch with the US Surgeon General Vivek Murthy as part of the Surgeon General’s campaign against “misinformation.” In the presentation, Renee DiResta also introduced Matt Masterson, former senior adviser at DHS, and now a “non-resident policy fellow” at SIO.
Murthy ends the presentation by telling Renee, “I just want to say thank you to you, for everything you have done, for being such a great partner.”
At that same time the White House, OSG, and others were on the warpath, claiming social media platforms were “killing people” for allowing so-called “misinformation” to circulate.
With access to the White House, the Surgeon General, CDC, DHS, and CISA, along with top-level relationships with almost every major Western social media platform, the Virality Project was a key, if not the key, coordinating node for Covid-related censorship on the Internet.
The Content-Flagging System
When the Virality Project said it considered, “true stories of vaccine side effects” to be “misinformation,” it wasn’t joking, and it flagged content to its Big Tech partners accordingly.
Perhaps the most egregious was that of Maddie de Garay. Maddie and her siblings were enrolled in the Pfizer vaccine trial at the Cincinnati Children’s Hospital. She was later unblinded and confirmed as being in the vaccine and not the placebo group.
Within 24 hours of her second shot in January 2021, Maddie developed a host of symptoms, including “severe abdominal pain, painful electric shocks on her spine and neck, swollen extremities, ice cold hands, and feet, chest pain, tachycardia, pins and needles in her feet that eventually led to the loss of feeling from her waist down.” To this day Maddie continues to suffer from a lack of feeling in her lower legs, difficulty eating, poor eyesight, and fatigue among other persisting symptoms.
Virality Project staff logged a Jira ticket titled “Maddie’s Story: False claim that 12-year-old was hospitalized due to vaccine trial” and provided extensive documentation of offending “engagement” on social media, including the micro-policing of content citing Maddie’s story with just two likes and two shares.

Much doubt has been cast on the veracity of Maddie’s injuries. Maddie’s mother, Stephanie de Garay, provided me with several doctor’s letters that confirm the link, including that of the emergency room doctor who discharged her on her initial visit. Their diagnosis was “Adverse effect of the vaccine.” Stephanie de Garay also testified under oath in front of the US Congress in November of 2023 regarding her daughter’s experience.
Most egregiously, the idea that the story was “false”rested on the claim that Maddie was in a Moderna trial. But she was in a Pfizer trial, as stated in the posts the Virality Project collected and linked to in the very same ticket.
“Dear Platform Partners,” the reporter writes as they bring the posts to the attention of Google, Facebook, Twitter, TikTok, Medium, Pinterest, and the aforementioned Hattaway Communications:
…very likely false due to issues in timing. The Moderna trial in children [began on March 16], when the participants received their first doses. However, the video claims that Maddie has an MRI scheduled for 03/16, and that these symptoms have been occurring for 1.5 months. Thus, Maddie would have had to have received the second dose of the vaccine during/before February, which is at least a month before the Moderna trials began.
“Ack – thanks for raising!” replies a platform representative.
Not only are our self-appointed censorship overlords micro-managers, they are often incompetent.
The posts were flagged “General: Anti-Vaccination” despite the de Garays volunteering their three children for the vaccine trial.
Some content flagged in the report remained up, and others were taken down. A video of Stephanie de Garay’s testimony was removed from Twitter. Whether or not this was specifically taken down due to the Virality Project report cannot be ascertained, but their intent was clear.
In another instance, the Virality Project wanted people circulating a mainstream media report censored:

“Platforms, this unconfirmed story of a healthy youth athlete who was hospitalized after being vaccinated continues to be used by anti-vaccine activists to spread misinformation about vaccines.”
“ack, thanks” responded a platform representative.
Even a report by an ABC news affiliate, one of the biggest media conglomerates in the United States, fell into the category of “General: anti-vaccination” and “Misleading Headline.”
The main link provided, to a YouTube video, was removed.
The Jira system was set up to track the actions the Big Tech partners took, as illustrated below:

The content was flagged to get platforms to take action.
“Hello Google team – sending this over as our analysts noticed that a google ad on a politico article this morning was peddling the antivax claims from the medical racism video you were monitoring. Is this against your policies?”
“Thanks for flagging – ack and sending for review.”
“Thanks for the heads up – we’re on it”
“Thanks for sharing! Our team is now tracking this.”
And follow-ups from the Virality Project team:
“Were the ads supposed to have been taken down? Just flagging for you, I just checked now and I’m still seeing another medical racism ad.”
Platforms were apologetic when they didn’t get to Virality Project’s flags quickly enough:
“With apologies for the delayed response (was in meetings) – we took action earlier in the afternoon, thanks again for the flags.”
This of course built on the Election Integrity Partnership’s more flagrant “recommendations,” which included:
“We recommend that you all flag as false, or remove the posts below.”
“Hi Facebook, Reddit, and Twitter…we recommend it be removed from your platforms.”
And many more.
The Virality Project was a strategic intermediary between the US government and major social media platforms. As Murthy v. Missouri shows, in many cases the government dispensed even with their chosen intermediary and directly demanded censorship.
With their vast resources, why did Google, Facebook, and Twitter even need an external consortium to flag “misinformation?” The answer of course is they didn’t, the government did. Much like SIO Director Alex Stamos so helpfully reminded us, First Amendment jurisprudence states that the government “may not induce, encourage or promote private persons to accomplish what it is constitutionally forbidden to accomplish.”
The First Amendment protects false speech. There is a cost to false claims, but the cost of censoring true claims is much higher. The alternative is a society where the truth is suppressed and powerful actors become even more unaccountable. The government cannot be made an arbiter of what is true.
In this inverted world, the role of academia and civil society isn’t to harness the internet to better pick up safety signals related to corporate products, it is to shield corporations from public scrutiny. In times gone by such ethical violations would see institutions shut down, but the Stanford Internet Observatory and their consortium partners continue with hardly a dent.
Dr. Aaron Kheriaty is a Murthy v. Missouri plaintiff and was the Director of the Medical Ethics Program at the University of California Irvine before he was fired for challenging the university’s vaccine mandate. Asked for his reaction to this censorship he responded:
While causation in medicine is sometimes difficult to establish, and different evaluating physicians may reach divergent conclusions about a particular case, the Virality Project’s censors (who lacked even basic medical expertise) arrogated to themselves the authority to make veracity judgments about particular medical cases–even overriding the judgments of evaluating physicians. Such censorship is completely antithetical to medical and scientific progress, which relies upon free inquiry and open, public debate.
Much of what the Virality Project flagged was plausible; however, their internet hall monitors, who likely lacked even first aid certificates, deemed themselves arbiters of the truth, and coupled their arrogance with a complimentary laziness and incompetence.
The veracity of the content was of course always irrelevant to the Virality Project, given they considered “true stories” to be “misinformation.”
All told the DHS, CISA, the White House, the Surgeon General, a DNC-aligned communications agency, military contractors, academics, NGOs, and more combined to suppress the stories of real people, including children, who were plausibly injured by the vaccine. They sought to hide it not because it might be false, but precisely because it might be true.
Republished from the author’s Substack
Andrew Lowenthal is a Brownstone Institute fellow and co-founder and former executive director of EngageMedia, an Asia-Pacific digital rights, open and secure technology, and documentary non-profit, and a former fellow of Harvard’s Berkman Klein Center for Internet and Society and MIT’s Open Documentary Lab.
International
This country became first in the world to let in tourists passport-free
Singapore has been on a larger push to speed up the flow of tourists with digital immigration clearance.
Share this:

In the fall of 2023, the city-state of Singapore announced that it was working on end-to-end biometrics that would allow travelers passing through its Changi Airport to check into flights, drop off bags and even leave and exit the country without a passport.
The latter is the most technologically advanced step of them all because not all countries issue passports with the same biometrics while immigration laws leave fewer room for mistakes about who enters the country.
Related: A country just went visa-free for visitors with any passport
That said, Singapore is one step closer to instituting passport-free travel by testing it at its land border with Malaysia. The two countries have two border checkpoints, Woodlands and Tuas, and as of March 20 those entering in Singapore by car are able to show a QR code that they generate through the government’s MyICA app instead of the passport.
Here is who is now able to enter Singapore passport-free
The latter will be available to citizens of Singapore, permanent residents and tourists who have already entered the country once with their current passport. The government app pulls data from one's passport and shows the border officer the conditions of one's entry clearance already recorded in the system.
More Travel:
- A new travel term is taking over the internet (and reaching airlines and hotels)
- The 10 best airline stocks to buy now
- Airlines see a new kind of traveler at the front of the plane
While not truly passport-free since tourists still need to link a valid passport to an online system, the move is the first step in Singapore's larger push to get rid of physical passports.
"The QR code initiative allows travellers to enjoy a faster and more convenient experience, with estimated time savings of around 20 seconds for cars with four travellers, to approximately one minute for cars with 10 travellers," Singapore's Immigration and Checkpoints Authority wrote in a press release announcing the new feature. "Overall waiting time can be reduced by more than 30% if most car travellers use QR code for clearance."
More countries are looking at passport-free travel but it will take years to implement
The land crossings between Singapore and Malaysia can get very busy — government numbers show that a new post-pandemic record of 495,000 people crossed Woodlands and Tuas on the weekend of March 8 (the day before Singapore's holiday weekend.)
Even once Singapore implements fully digital clearance at all of its crossings, the change will in no way affect immigration rules since it's only a way of transferring the status afforded by one's nationality into a digital system (those who need a visa to enter Singapore will still need to apply for one at a consulate before the trip.) More countries are in the process of moving toward similar systems but due to the varying availability of necessary technology and the types of passports issued by different countries, the prospect of agent-free crossings is still many years away.
In the U.S., Chicago's O'Hare International Airport was chosen to take part in a pilot program in which low-risk travelers with TSA PreCheck can check into their flight and pass security on domestic flights without showing ID. The UK has also been testing similar digital crossings for British and EU citizens but no similar push for international travelers is currently being planned in the U.S.
stocks pandemic link testing singapore uk eu

Analysts issue unexpected crude oil price forecast after surge


Young People Aren’t Nearly Angry Enough About Government Debt


Apartment permits are back to recession lows. Will mortgage rates follow?


Study: Life’s building blocks are surprisingly stable in Venus-like conditions


ARPA-H appoints Etta Pisano to lead its Advancing Clinical Trials Readiness Initiative


COVID-19 Infection Increases Risk Of Autoimmune Diseases By Up To 30 Percent: Study


“Are you better off than you were four years ago?”


IVI starts technology transfer to Biological E. Limited to manufacture oral cholera vaccine for India and global markets


QE By A Different Name Is Still QE


This country became first in the world to let in tourists passport-free
-

 Spread & Containment1 week ago
IFM’s Hat Trick and Reflections On Option-To-Buy M&A
-

 Uncategorized4 weeks ago
All Of The Elements Are In Place For An Economic Crisis Of Staggering Proportions
-

 International2 weeks ago
EyePoint poaches medical chief from Apellis; Sandoz CFO, longtime BioNTech exec to retire
-

 Uncategorized1 month ago
California Counties Could Be Forced To Pay $300 Million To Cover COVID-Era Program
-

 Uncategorized4 weeks ago
Apparel Retailer Express Moving Toward Bankruptcy
-

 International2 weeks ago
Walmart launches clever answer to Target’s new membership program
-

 Uncategorized1 month ago
RFK Jr: The Wuhan Cover-Up & The Rise Of The Biowarfare-Industrial Complex
-

 Uncategorized1 month ago
GOP Efforts To Shore Up Election Security In Swing States Face Challenges