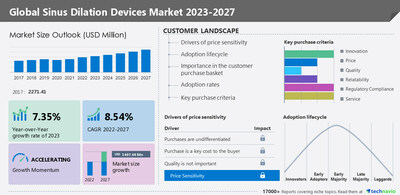
NEW YORK, March 7, 2023 /PRNewswire/ -- The sinus dilation devices market size is estimated to increase by USD 1497.49 million from 2022 to 2027, with an almost CAGR of 8.54%, according to the recent market study by Technavio. The prevalence of chronic sinusitis is increasing across the world. It is one of the most prevalent health conditions in the US among people of all age groups. For instance, in the US, 30.8 million people were diagnosed with sinusitis in 2017, according to the CDC. There are several medications and treatment options available for the condition such as decongestants, nasal steroids, oral steroids, and some natural remedies. However, patients affected with chronic sinusitis may become resistant to these treatment options. Hence it becomes necessary for patients to opt for sinus surgery. As a result of these factors, the market size is expected to increase during the forecast period. Discover some insights on the historic (2017 to 2021) and forecast market size (2023 to 2027) - Request a sample report
What`s New for 2023?
- Special coverage on the Russia-Ukraine war; global inflation; recovery analysis from COVID-19; supply chain disruptions, global trade tensions; and risk of recession
- Global competitiveness and key competitor positions
- Market presence across multiple geographical footprints - Strong/Active/Niche/Trivial - Buy report!
Sinus Dilation Devices Market Scope
|
Report Coverage
| Details
|
Base year
| 2022
|
Historic period
| 2017-2021
|
Forecast period
| 2023-2027
|
Growth momentum & CAGR
| Accelerate at a CAGR of 8.54%
|
Market growth 2023-2027
| USD 1497.49 million
|
Market structure
| Fragmented
|
YoY growth 2022-2023 (%)
| 7.35
|
Regional analysis
| North America, Europe, Asia, and Rest of World (ROW)
|
Performing market contribution
| North America at 38%
|
Key countries
| US, Canada, Germany, UK, Japan, Canada, Mexico, Italy,Spain, Australia, and South Korea
|
Competitive landscape
| Leading Vendors, Market Positioning of Vendors, Competitive Strategies, and Industry Risks
|
Key companies profiled
| Accurate Surgical and Scientific Instruments Corp., Aetna Inc., B. Braun SE, Creganna Medical Unlimited, Dalent LLC, EMOS Technology GmbH, ESC Medicams, InnAccel Technologies Pvt. Ltd., Intersect ENT Inc., KARL STORZ SE and Co. KG, Medtronic Plc, Meril Life Sciences Pvt. Ltd., Olympus Corp., Optim LLC, SinuSys Corp., Sklar Surgical Instruments, Smith and Nephew plc, Stryker Corp., Summit Medical LLC, and Johnson and Johnson
|
Market dynamics
| Parent market analysis, market growth inducers and obstacles, fast-growing and slow-growing segment analysis, COVID-19 impact and recovery analysis and future consumer dynamics, and market condition analysis for the forecast period.
|
Customization purview
| If our report has not included the data that you are looking for, you can reach out to our analysts and get segments customized.
|
Vendor Analysis:
The sinus dilation devices market report also offers information on the criticality of inputs, R&D, CAPEX, technology, and products of 15 vendors listed Below -
Accurate Surgical and Scientific Instruments Corp., Aetna Inc., B. Braun SE, Creganna Medical Unlimited, Dalent LLC, EMOS Technology GmbH, ESC Medicams, InnAccel Technologies Pvt. Ltd., Intersect ENT Inc., KARL STORZ SE and Co. KG, Medtronic Plc, Meril Life Sciences Pvt. Ltd., Olympus Corp., Optim LLC, SinuSys Corp., Sklar Surgical Instruments, Smith and Nephew plc, Stryker Corp., Summit Medical LLC, Johnson, and Johnson. To know about the vendor offerings - Download a Sample Report
Chart & Data Table on 5-Year Historic (2017-2021) Market Size, Comparative Analysis of Segments, and Y-O-Y Growth of Sinus dilation devices market
- The market is segmented by product (balloon sinus dilation devices, endoscopes, surgical instruments, and sinus stents), application (standalone sinus dilation and hybrid sinus dilation), and geography (North America, Europe, Asia, and Rest of the World (ROW)).
- By product, the market will observe significant growth in the balloon sinus dilation devices segment during the forecast period. Balloon sinus dilation devices involve a less invasive procedure and ensure faster recovery rate when compared with conventional sinus devices. Most patients can return to work and resume normal activities within two days of the procedure. Moreover, these devices eliminate the need to undergo general anesthesia or go to an operating room. Such benefits are driving the growth of the segment.
- North America will account for 38% of the market growth during the forecast period.
- The growth of the regional market can be attributed to factors such as the high prevalence of upper respiratory tract infections, the presence of established vendors, and the growing awareness about sinus dilation devices and minimally invasive sinus surgeries.
For Insights on the market, segmentations, historic (2017 to 2021), and forecast market size (2023 to 2027) view the PDF report sample!
What are the key data covered in this sinus dilation devices market report?
- CAGR of the market during the forecast period
- Detailed information on factors that will drive the growth of the sinus dilation devices market between 2023 and 2027
- Precise estimation of the size of the sinus dilation devices market size and its contribution to the market in focus on the parent market
- Accurate predictions about upcoming trends and changes in consumer behavior
- Growth of the sinus dilation devices market industry across North America, Europe, Asia, and Rest of World (ROW)
- A thorough analysis of the market's competitive landscape and detailed information about vendors
- Comprehensive analysis of factors that will challenge the growth of sinus dilation devices market vendors
Gain instant access to 17,000+ market research reports.
Technavio's SUBSCRIPTION platform
Related Reports:
- The nasal implants market size is expected to increase to USD 312.05 million from 2021 to 2026, and the market's growth momentum will accelerate at a CAGR of 5.26%. The growing demand for nasal implants for medical conditions and aesthetic procedures is notably driving the nasal implants market growth, although factors such as complications and side effects associated with nasal surgery may impede market growth.
- The sinuscope endoscopes market size is expected to increase by USD 88.69 million from 2021 to 2026, and the market's growth momentum will accelerate at a CAGR of 7.8%. The growing prevalence of sinusitis is notably driving the sinuscope endoscopes market growth, although factors such as potential complications of sinus endoscopy and the high cost of the procedure may impede the market growth.
Table of contents:
1 Executive Summary
- 1.1 Market overview
- Exhibit 01: Executive Summary – Chart on Market Overview
- Exhibit 02: Executive Summary – Data Table on Market Overview
- Exhibit 03: Executive Summary – Chart on Global Market Characteristics
- Exhibit 04: Executive Summary – Chart on Market by Geography
- Exhibit 05: Executive Summary – Chart on Market Segmentation by Product
- Exhibit 06: Executive Summary – Chart on Market Segmentation by Application
- Exhibit 07: Executive Summary – Chart on Incremental Growth
- Exhibit 08: Executive Summary – Data Table on Incremental Growth
- Exhibit 09: Executive Summary – Chart on Vendor Market Positioning
2 Market Landscape
- 2.1 Market ecosystem
- Exhibit 10: Parent market
- Exhibit 11: Market Characteristics
3 Market Sizing
- 3.1 Market definition
- Exhibit 12: Offerings of vendors included in the market definition
- 3.2 Market segment analysis
- Exhibit 13: Market segments
- 3.4 Market outlook: Forecast for 2022-2027
- Exhibit 14: Chart on Global - Market size and forecast 2022-2027 ($ million)
- Exhibit 15: Data Table on Global - Market size and forecast 2022-2027 ($ million)
- Exhibit 16: Chart on Global Market: Year-over-year growth 2022-2027 (%)
- Exhibit 17: Data Table on Global Market: Year-over-year growth 2022-2027 (%)
4 Historic Market Size
- 4.1 Global sinus dilation devices market 2017 - 2021
- Exhibit 18: Historic Market Size – Data Table on Global sinus dilation devices market 2017 - 2021 ($ million)
- 4.2 Product Segment Analysis 2017 - 2021
- Exhibit 19: Historic Market Size – Product Segment 2017 - 2021 ($ million)
- 4.3 Application Segment Analysis 2017 - 2021
- Exhibit 20: Historic Market Size – Application Segment 2017 - 2021 ($ million)
- 4.4 Geography Segment Analysis 2017 - 2021
- Exhibit 21: Historic Market Size – Geography Segment 2017 - 2021 ($ million)
- 4.5 Country Segment Analysis 2017 - 2021
- Exhibit 22: Historic Market Size – Country Segment 2017 - 2021 ($ million)
5 Five Forces Analysis
- 5.1 Five forces summary
- Exhibit 23: Five forces analysis - Comparison between 2022 and 2027
- 5.2 Bargaining power of buyers
- Exhibit 24: Chart on Bargaining power of buyers – Impact of key factors 2022 and 2027
- 5.3 Bargaining power of suppliers
- Exhibit 25: Bargaining power of suppliers – Impact of key factors in 2022 and 2027
- 5.4 Threat of new entrants
- Exhibit 26: Threat of new entrants – Impact of key factors in 2022 and 2027
- 5.5 Threat of substitutes
- Exhibit 27: Threat of substitutes – Impact of key factors in 2022 and 2027
- 5.6 Threat of rivalry
- Exhibit 28: Threat of rivalry – Impact of key factors in 2022 and 2027
- 5.7 Market condition
- Exhibit 29: Chart on Market condition - Five forces 2022 and 2027
6 Market Segmentation by Product
- 6.1 Market segments
- Exhibit 30: Chart on Product - Market share 2022-2027 (%)
- Exhibit 31: Data Table on Product - Market share 2022-2027 (%)
- 6.2 Comparison by Product
- Exhibit 32: Chart on Comparison by Product
- Exhibit 33: Data Table on Comparison by Product
- 6.3 Balloon sinus dilation devices - Market size and forecast 2022-2027
- Exhibit 34: Chart on Balloon sinus dilation devices - Market size and forecast 2022-2027 ($ million)
- Exhibit 35: Data Table on Balloon sinus dilation devices - Market size and forecast 2022-2027 ($ million)
- Exhibit 36: Chart on Balloon sinus dilation devices - Year-over-year growth 2022-2027 (%)
- Exhibit 37: Data Table on Balloon sinus dilation devices - Year-over-year growth 2022-2027 (%)
- 6.4 Endoscopes - Market size and forecast 2022-2027
- Exhibit 38: Chart on Endoscopes - Market size and forecast 2022-2027 ($ million)
- Exhibit 39: Data Table on Endoscopes - Market size and forecast 2022-2027 ($ million)
- Exhibit 40: Chart on Endoscopes - Year-over-year growth 2022-2027 (%)
- Exhibit 41: Data Table on Endoscopes - Year-over-year growth 2022-2027 (%)
- 6.5 Surgical instruments - Market size and forecast 2022-2027
- Exhibit 42: Chart on Surgical instruments - Market size and forecast 2022-2027 ($ million)
- Exhibit 43: Data Table on Surgical instruments - Market size and forecast 2022-2027 ($ million)
- Exhibit 44: Chart on Surgical instruments - Year-over-year growth 2022-2027 (%)
- Exhibit 45: Data Table on Surgical instruments - Year-over-year growth 2022-2027 (%)
- 6.6 Sinus stents - Market size and forecast 2022-2027
- Exhibit 46: Chart on Sinus stents - Market size and forecast 2022-2027 ($ million)
- Exhibit 47: Data Table on Sinus stents - Market size and forecast 2022-2027 ($ million)
- Exhibit 48: Chart on Sinus stents - Year-over-year growth 2022-2027 (%)
- Exhibit 49: Data Table on Sinus stents - Year-over-year growth 2022-2027 (%)
- 6.7 Market opportunity by Product
- Exhibit 50: Market opportunity by Product ($ million)
7 Market Segmentation by Application
- 7.1 Market segments
- Exhibit 51: Chart on Application - Market share 2022-2027 (%)
- Exhibit 52: Data Table on Application - Market share 2022-2027 (%)
- 7.2 Comparison by Application
- Exhibit 53: Chart on Comparison by Application
- Exhibit 54: Data Table on Comparison by Application
- 7.3 Standalone sinus dilation - Market size and forecast 2022-2027
- Exhibit 55: Chart on Standalone sinus dilation - Market size and forecast 2022-2027 ($ million)
- Exhibit 56: Data Table on Standalone sinus dilation - Market size and forecast 2022-2027 ($ million)
- Exhibit 57: Chart on Standalone sinus dilation - Year-over-year growth 2022-2027 (%)
- Exhibit 58: Data Table on Standalone sinus dilation - Year-over-year growth 2022-2027 (%)
- 7.4 Hybrid sinus dilation - Market size and forecast 2022-2027
- Exhibit 59: Chart on Hybrid sinus dilation - Market size and forecast 2022-2027 ($ million)
- Exhibit 60: Data Table on Hybrid sinus dilation - Market size and forecast 2022-2027 ($ million)
- Exhibit 61: Chart on Hybrid sinus dilation - Year-over-year growth 2022-2027 (%)
- Exhibit 62: Data Table on Hybrid sinus dilation - Year-over-year growth 2022-2027 (%)
- 7.5 Market opportunity by Application
- Exhibit 63: Market opportunity by Application ($ million)
8 Customer Landscape
- 8.1 Customer landscape overview
- Exhibit 64: Analysis of price sensitivity, lifecycle, customer purchase basket, adoption rates, and purchase criteria
9 Geographic Landscape
- 9.1 Geographic segmentation
- Exhibit 65: Chart on Market share by geography 2022-2027 (%)
- Exhibit 66: Data Table on Market share by geography 2022-2027 (%)
- 9.2 Geographic comparison
- Exhibit 67: Chart on Geographic comparison
- Exhibit 68: Data Table on Geographic comparison
- 9.3 North America - Market size and forecast 2022-2027
- Exhibit 69: Chart on North America - Market size and forecast 2022-2027 ($ million)
- Exhibit 70: Data Table on North America - Market size and forecast 2022-2027 ($ million)
- Exhibit 71: Chart on North America - Year-over-year growth 2022-2027 (%)
- Exhibit 72: Data Table on North America - Year-over-year growth 2022-2027 (%)
- 9.4 Europe - Market size and forecast 2022-2027
- Exhibit 73: Chart on Europe - Market size and forecast 2022-2027 ($ million)
- Exhibit 74: Data Table on Europe - Market size and forecast 2022-2027 ($ million)
- Exhibit 75: Chart on Europe - Year-over-year growth 2022-2027 (%)
- Exhibit 76: Data Table on Europe - Year-over-year growth 2022-2027 (%)
- 9.5 Asia - Market size and forecast 2022-2027
- Exhibit 77: Chart on Asia - Market size and forecast 2022-2027 ($ million)
- Exhibit 78: Data Table on Asia - Market size and forecast 2022-2027 ($ million)
- Exhibit 79: Chart on Asia - Year-over-year growth 2022-2027 (%)
- Exhibit 80: Data Table on Asia - Year-over-year growth 2022-2027 (%)
- 9.6 Rest of World (ROW) - Market size and forecast 2022-2027
- Exhibit 81: Chart on Rest of World (ROW) - Market size and forecast 2022-2027 ($ million)
- Exhibit 82: Data Table on Rest of World (ROW) - Market size and forecast 2022-2027 ($ million)
- Exhibit 83: Chart on Rest of World (ROW) - Year-over-year growth 2022-2027 (%)
- Exhibit 84: Data Table on Rest of World (ROW) - Year-over-year growth 2022-2027 (%)
- 9.7 US - Market size and forecast 2022-2027
- Exhibit 85: Chart on US - Market size and forecast 2022-2027 ($ million)
- Exhibit 86: Data Table on US - Market size and forecast 2022-2027 ($ million)
- Exhibit 87: Chart on US - Year-over-year growth 2022-2027 (%)
- Exhibit 88: Data Table on US - Year-over-year growth 2022-2027 (%)
- 9.8 Germany - Market size and forecast 2022-2027
- Exhibit 89: Chart on Germany - Market size and forecast 2022-2027 ($ million)
- Exhibit 90: Data Table on Germany - Market size and forecast 2022-2027 ($ million)
- Exhibit 91: Chart on Germany - Year-over-year growth 2022-2027 (%)
- Exhibit 92: Data Table on Germany - Year-over-year growth 2022-2027 (%)
- 9.9 Japan - Market size and forecast 2022-2027
- Exhibit 93: Chart on Japan - Market size and forecast 2022-2027 ($ million)
- Exhibit 94: Data Table on Japan - Market size and forecast 2022-2027 ($ million)
- Exhibit 95: Chart on Japan - Year-over-year growth 2022-2027 (%)
- Exhibit 96: Data Table on Japan - Year-over-year growth 2022-2027 (%)
- 9.10 Canada - Market size and forecast 2022-2027
- Exhibit 97: Chart on Canada - Market size and forecast 2022-2027 ($ million)
- Exhibit 98: Data Table on Canada - Market size and forecast 2022-2027 ($ million)
- Exhibit 99: Chart on Canada - Year-over-year growth 2022-2027 (%)
- Exhibit 100: Data Table on Canada - Year-over-year growth 2022-2027 (%)
- 9.11 UK - Market size and forecast 2022-2027
- Exhibit 101: Chart on UK - Market size and forecast 2022-2027 ($ million)
- Exhibit 102: Data Table on UK - Market size and forecast 2022-2027 ($ million)
- Exhibit 103: Chart on UK - Year-over-year growth 2022-2027 (%)
- Exhibit 104: Data Table on UK - Year-over-year growth 2022-2027 (%)
- 9.12 Market opportunity by geography
- Exhibit 105: Market opportunity by geography ($ million)
10 Drivers, Challenges, and Trends
- 10.3 Impact of drivers and challenges
- Exhibit 106: Impact of drivers and challenges in 2022 and 2027
11 Vendor Landscape
- 11.2 Vendor landscape
- Exhibit 107: Overview on Criticality of inputs and Factors of differentiation
- 11.3 Landscape disruption
- Exhibit 108: Overview on factors of disruption
- 11.4 Industry risks
- Exhibit 109: Impact of key risks on business
12 Vendor Analysis
- 12.1 Vendors covered
- Exhibit 110: Vendors covered
- 12.2 Market positioning of vendors
- Exhibit 111: Matrix on vendor position and classification
- 12.3 Aetna Inc.
- Exhibit 112: Aetna Inc. - Overview
- Exhibit 113: Aetna Inc. - Product / Service
- Exhibit 114: Aetna Inc. - Key offerings
- 12.4 Creganna Medical Unlimited
- Exhibit 115: Creganna Medical Unlimited - Overview
- Exhibit 116: Creganna Medical Unlimited - Product / Service
- Exhibit 117: Creganna Medical Unlimited - Key offerings
- 12.5 Dalent LLC
- Exhibit 118: Dalent LLC - Overview
- Exhibit 119: Dalent LLC - Product / Service
- Exhibit 120: Dalent LLC - Key offerings
- 12.6 EMOS Technology GmbH
- Exhibit 121: EMOS Technology GmbH - Overview
- Exhibit 122: EMOS Technology GmbH - Product / Service
- Exhibit 123: EMOS Technology GmbH - Key offerings
- 12.7 InnAccel Technologies Pvt. Ltd.
- Exhibit 124: InnAccel Technologies Pvt. Ltd. - Overview
- Exhibit 125: InnAccel Technologies Pvt. Ltd. - Product / Service
- Exhibit 126: InnAccel Technologies Pvt. Ltd. - Key offerings
- 12.8 Intersect ENT Inc.
- Exhibit 127: Intersect ENT Inc. - Overview
- Exhibit 128: Intersect ENT Inc. - Product / Service
- Exhibit 129: Intersect ENT Inc. - Key offerings
- 12.9 Johnson and Johnson
- Exhibit 130: Johnson and Johnson - Overview
- Exhibit 131: Johnson and Johnson - Business segments
- Exhibit 132: Johnson and Johnson - Key news
- Exhibit 133: Johnson and Johnson - Key offerings
- Exhibit 134: Johnson and Johnson - Segment focus
- 12.10 Medtronic Plc
- Exhibit 135: Medtronic Plc - Overview
- Exhibit 136: Medtronic Plc - Business segments
- Exhibit 137: Medtronic Plc - Key news
- Exhibit 138: Medtronic Plc - Key offerings
- Exhibit 139: Medtronic Plc - Segment focus
- 12.11 Meril Life Sciences Pvt. Ltd.
- Exhibit 140: Meril Life Sciences Pvt. Ltd. - Overview
- Exhibit 141: Meril Life Sciences Pvt. Ltd. - Product / Service
- Exhibit 142: Meril Life Sciences Pvt. Ltd. - Key offerings
- 12.12 Olympus Corp.
- Exhibit 143: Olympus Corp. - Overview
- Exhibit 144: Olympus Corp. - Business segments
- Exhibit 145: Olympus Corp. - Key news
- Exhibit 146: Olympus Corp. - Key offerings
- Exhibit 147: Olympus Corp. - Segment focus
- 12.13 SinuSys Corp.
- Exhibit 148: SinuSys Corp. - Overview
- Exhibit 149: SinuSys Corp. - Product / Service
- Exhibit 150: SinuSys Corp. - Key offerings
- 12.14 Sklar Surgical Instruments
- Exhibit 151: Sklar Surgical Instruments - Overview
- Exhibit 152: Sklar Surgical Instruments - Product / Service
- Exhibit 153: Sklar Surgical Instruments - Key offerings
- 12.15 Smith and Nephew plc
- Exhibit 154: Smith and Nephew plc - Overview
- Exhibit 155: Smith and Nephew plc - Business segments
- Exhibit 156: Smith and Nephew plc - Key news
- Exhibit 157: Smith and Nephew plc - Key offerings
- Exhibit 158: Smith and Nephew plc - Segment focus
- 12.16 Stryker Corp.
- Exhibit 159: Stryker Corp. - Overview
- Exhibit 160: Stryker Corp. - Business segments
- Exhibit 161: Stryker Corp. - Key news
- Exhibit 162: Stryker Corp. - Key offerings
- Exhibit 163: Stryker Corp. - Segment focus
- 12.17 Summit Medical LLC
- Exhibit 164: Summit Medical LLC - Overview
- Exhibit 165: Summit Medical LLC - Product / Service
- Exhibit 166: Summit Medical LLC - Key offerings
13 Appendix
- 13.2 Inclusions and exclusions checklist
- Exhibit 167: Inclusions checklist
- Exhibit 168: Exclusions checklist
- 13.3 Currency conversion rates for US$
- Exhibit 169: Currency conversion rates for US$
- 13.4 Research methodology
- Exhibit 170: Research methodology
- Exhibit 171: Validation techniques employed for market sizing
- Exhibit 172: Information sources
- 13.5 List of abbreviations
- Exhibit 173: List of abbreviations
About Us
Technavio is a leading global technology research and advisory company. Their research and analysis focuses on emerging market trends and provides actionable insights to help businesses identify market opportunities and develop effective strategies to optimize their market positions. With over 500 specialized analysts, Technavio's report library consists of more than 17,000 reports and counting, covering 800 technologies, spanning across 50 countries. Their client base consists of enterprises of all sizes, including more than 100 Fortune 500 companies. This growing client base relies on Technavio's comprehensive coverage, extensive research, and actionable market insights to identify opportunities in existing and potential markets and assess their competitive positions within changing market scenarios.
Contact
Technavio Research
Jesse Maida
Media & Marketing Executive
US: +1 844 364 1100
UK: +44 203 893 3200
Email: media@technavio.com
Website: www.technavio.com/
View original content to download multimedia:https://www.prnewswire.com/news-releases/sinus-dilation-devices-market-to-grow-at-a-cagr-of-8-54-from-2022-to-2027--driven-by-the-high-prevalence-of-chronic-sinusitis---technavio-301763260.html
SOURCE Technavio


