Shore Bancshares Reports First Quarter 2022 Financial Results
Shore Bancshares Reports First Quarter 2022 Financial Results
PR Newswire
EASTON, Md., April 28, 2022
EASTON, Md., April 28, 2022 /PRNewswire/ — Shore Bancshares, Inc. (NASDAQ – SHBI) (the “Company”) reported net income of $5.613 million or $0.28 …
Share this:


Shore Bancshares Reports First Quarter 2022 Financial Results
PR Newswire
EASTON, Md., April 28, 2022
EASTON, Md., April 28, 2022 /PRNewswire/ -- Shore Bancshares, Inc. (NASDAQ - SHBI) (the "Company") reported net income of $5.613 million or $0.28 per diluted common share for the first quarter of 2022, compared to net income of $2.723 million or $0.16 per diluted common share for the fourth quarter of 2021, and net income of $3.998 million or $0.34 per diluted common share for the first quarter of 2021. Net income, excluding merger related expenses for the first quarter of 2022 was $6.156 million or $0.31 per diluted common share, compared to net income, excluding merger related expenses of $7.914 million or $0.46 per diluted common share for the fourth quarter of 2021.
When comparing net income, excluding merger related expenses, for the first quarter of 2022 to the fourth quarter of 2021, net income decreased $1.8 million, primarily due increases in noninterest expenses of $3.7 million and provision for credit losses of $2.3 million, partially offset by increases in net interest income of $1.8 million and noninterest income of $917 thousand. When comparing net income, excluding merger related expenses, for the first quarter of 2022 to the first quarter of 2021, net income increased $2.4 million, primarily due to increases in net interest income of $8.6 million and noninterest income of $3.5 million, partially offset by an increase in noninterest expenses of $9.1 million.
"We are pleased to announce our first quarter earnings and financial results," said Lloyd L. "Scott" Beatty, Jr., President and Chief Executive Officer. "We saw significant growth in both loans and deposits during the quarter, resulting from our ability to be competitive in all areas of our footprint. Our current size allows us the ability to originate larger loans than some of our competitors, while providing the opportunity for borrowers to remain with a local community bank. We are already experiencing the advantages of having a stronger presence in Central Maryland, particularly Anne Arundel County, and continue to capitalize on opportunities in our Delaware market."
Balance Sheet Review
Total assets were $3.494 billion at March 31, 2022, a $34.4 million, or 1.0%, increase when compared to $3.460 billion at the end of 2021. This increase was due to an increase in loans held for investment of $61.9 million, or 2.9%, partially offset by a decrease in loans held for sale of $24.8 million, or 65.8%. The positive organic loan growth for loans held for investment was due to strong loan demand, specifically within our commercial real estate, construction and consumer portfolios, while loan demand for residential real estate was limited by an increasing interest rate environment and lack of inventory. As of March 31, 2022, the Company had 114 Paycheck Protection Program ("PPP") loans totaling $14.9 million that were outstanding.
Total deposits increased $42.3 million, or 1.4%, when compared to December 31, 2021. The increase in total deposits was primarily due to $171.3 million in additional checking deposits, partially offset by decreases in money market and savings deposits of $77.9 million and noninterest-bearing deposits of $51.1 million.
Total stockholders' equity increased $1.2 million, or less than 1%, when compared to December 31, 2021, primarily due to first quarter earnings, partially offset by unrealized losses of $2.2 million on available for sale securities during the quarter, which are recorded in accumulated other comprehensive loss. At March 31, 2022, the ratio of total equity to total assets was 10.07% and the ratio of total tangible equity to total tangible assets was 8.22%.
Review of Quarterly Financial Results
Net interest income was $22.4 million for the first quarter of 2022, compared to $20.6 million for the fourth quarter of 2021 and $13.8 million for the first quarter of 2021. The increase in net interest income when compared to the fourth quarter of 2021 was primarily due to increases in interest and fees on loans of $1.5 million, interest on taxable investment securities of $322 thousand and interest on deposits with other banks of $85 thousand, partially offset by increases in expense on interest-bearing deposits of $86 thousand and long-term borrowings of $25 thousand. The improvement in interest and fees on loans was due to an increase in the average balance of loans of $248.6 million, or 13.2%. The acquisition of loans from Severn had a significant impact on the average balance of loans due to carrying these loans for a full quarter but was also complemented by significant organic loan growth of $61.9 million, fees received from PPP loan forgiveness of $272 thousand and accretion income from loans acquired of $258 thousand. The increase in interest on deposits with other banks was primarily due to an increase in the average balance of $100.6 million, or 20.7%, combined with an increase in the yield on these deposits of 4bps due to an increase in the Fed funds rate during the first quarter. The increase in interest on taxable investment securities was driven by an increase in the average balance within these securities of $62.3 million, or 13.3%, due to a full quarter of acquired securities from Severn and additional purchases of held to maturity securities during the first quarter of 2022. The increase in deposits with other banks and investment securities was primarily due to excess liquidity. The increase in interest expense on interest-bearing deposits was primarily due an increase in the average balance of interest-bearing deposits of $284.4 million, or 15.4%, the result of both a full quarter of deposits acquired from Severn and $93.3 million in organic deposit growth during the first quarter of 2022. The rates paid on interest-bearing deposits decreased slightly to 26bps in the first quarter of 2022 from 27bps in the fourth quarter of 2021, maintaining a low cost of funds on core deposits. The increase in interest expenses was due to a full quarter of additional long-term debt, specifically the junior subordinated debt acquired from Severn.
The increase in net interest income when compared to the first quarter of 2021 was primarily due to increases in interest and fees on loans of $7.7 million, interest on taxable investment securities of $1.1 million and interest on deposits with other banks of $207 thousand, partially offset by increases in expense on interest-bearing deposits of $174 thousand and long-term borrowings of $175 thousand. The increase in interest income was due to a higher average balance in loans, taxable investment securities and deposits with other banks of $684.9 million, $303.2 million and $397.6 million, respectively. These assets were significantly impacted by the acquisition of Severn in the fourth quarter of 2021 as well as organic loan growth and excess liquidity throughout 2021 and 2022. Interest-bearing liabilities also increased when compared to the first quarter of 2021 due to a higher average balance in interest-bearing deposits of $902.9 million, coupled with the addition of long-term advances from the FHLB of $10.1 million and subordinated debt of $18.2 million net of a fair value adjustment of $2.4 million, both of which were acquired from Severn in the fourth quarter of 2021. The long-term advances from the FHLB are set to mature in October of 2022 and the subordinated debt acquired from Severn may be called at any time.
The Company's net interest margin decreased to 2.78% for the first quarter of 2022 from 2.87% for the fourth quarter of 2021 and 3.00% for the first quarter of 2021. The decrease in net interest margin in the first quarter of 2022 when compared to the fourth quarter of 2021, was primarily due to lower yields on loans of 13bps resulting from decreases in accretion income on the acquired loan portfolio and PPP fee income. In addition, excess liquidity continues to put downward pressure on earning assets due to excess cash being invested in lower yielding assets. The decrease in net interest margin in the first quarter of 2022 when compared to the first quarter of 2021, was primarily due to a lower yield on taxable investment securities of 14bps, which was magnified by an increase in the average balance in these securities of $303.2 million, partially offset by a higher yield on loans of 17bps and lower rates paid on interest-bearing liabilities of 13bps. As previously mentioned, excess liquidity when compared to the first quarter of 2021 continues to compress the overall net interest margin. Absent excess liquidity of $400 million, we estimate our margin for the first quarter of 2022 would have been 3.07%.
The provision for credit losses was $600 thousand for the three months ended March 31, 2022. The comparable amounts were $(1.7) million and $425 thousand for the three months ended December 31, 2021 and March 31, 2021, respectively. The increase in the provision for credit losses during the first quarter of 2022 as compared to the prior quarter was primarily attributed to the Company's reduction of pandemic related qualitative factors. The ratio of the allowance for credit losses to period-end loans, excluding PPP loans and acquired loans, was 0.92% at March 31, 2022, compared to 0.93% at December 31, 2021 and 1.11% at March 31, 2021. The decreased percentage of the allowance to total loans, excluding PPP loans and acquired loans, as compared to the fourth quarter of 2021, was due to further reduced pandemic qualitative factors previously mentioned, partially offset by the addition of organic loan growth in the first quarter of 2022 which required additional reserves. The decreased percentage of the allowance to total loans, excluding PPP loans and acquired loans, as compared to the first quarter of 2021, was primarily due to improved credit quality and reduced pandemic qualitative factors, during the fourth quarter of 2021 and first quarter of 2022. The Company reported net recoveries of $166 thousand in the first quarter of 2022, compared to net recoveries of $142 thousand in the fourth quarter of 2021 and no net charge offs or recoveries in the first quarter of 2021.
At March 31, 2022, nonperforming assets were $3.9 million, compared to $3.8 million at December 31, 2021. The balance of nonperforming assets slightly increased due to increases in nonaccrual loans of $62 thousand, or 2.2%, and other real estate owned of $29 thousand, or 5.5%. Accruing troubled debt restructurings ("TDRs") decreased $663 thousand, or 11.7% at March 31, 2022 compared to December 31, 2021. When comparing the first quarter of 2022 to the first quarter of 2021, nonperforming assets decreased $2.4 million, or 38.3%, primarily due to decreases in nonaccrual loans of $2.0 million, or 41.6%, and loans 90 days past due and still accruing of $729 thousand, or 61.4%. Accruing TDRs decreased $1.5 million, or 22.5%, and other real estate owned increased $356 thousand, or 173.7%, mainly due to acquiring other real estate owned from the Severn acquisition. The ratio of nonperforming assets and accruing TDRs to total assets was 0.25%, 0.27% and 0.63% at March 31, 2022, December 31, 2021 and March 31, 2021, respectively. In addition, the ratio of accruing TDRs to total loans at March 31, 2022 was 0.23%, compared to 0.27% at December 31, 2021 and 0.44% at March 31, 2021.
Total noninterest income for the first quarter of 2022 increased $917 thousand, or 17.9%, when compared to the fourth quarter of 2021 and increased $3.5 million, or 136.4%, when compared to the first quarter of 2021. The increase compared to the fourth quarter of 2021 was primarily due to increases in revenue associated with the mortgage division of $919 thousand, service charges on deposit accounts of $125 thousand and revenue from Mid-Maryland Title Company, Inc. ("Mid-MD") of $76 thousand, partially offset by a reduction in other noninterest income primarily related to higher expenses related to retirement funding costs as well as lower other loan fee income. The increase in noninterest income when compared to the first quarter of 2021, was among all noninterest income categories, but primarily impacted by the addition of mortgage-banking revenue of $1.9 million, service charges on deposit accounts of $685 thousand, additional rental fee income of $345 thousand and Mid-MD revenue of $323 thousand.
Total noninterest expense, excluding merger related expenses, for the first quarter of 2022 increased $3.7 million, or 15.8%, when compared to the fourth quarter of 2021 and increased $9.1 million, or 86.7%, when compared to the first quarter of 2021. The increase in noninterest expense when compared to the fourth and first quarters of 2021 was primarily due to increases in salaries and wages, employee related benefits, occupancy expense, data processing, amortization of intangible assets and legal and professional fees, which were all significantly impacted by adding Severn and its operations for a full quarter in 2022. In addition, salaries and wages were impacted by incentive increases which took effect in January.
Shore Bancshares Information
Shore Bancshares is a financial holding company headquartered in Easton, Maryland and is the largest independent bank holding company located on Maryland's Eastern Shore. It is the parent company of Shore United Bank. Shore Bancshares engages in trust and wealth management services through Wye Financial Partners, a division of Shore United Bank.
Additional information is available at www.shorebancshares.com.
Forward-Looking Statements
The statements contained herein that are not historical facts are forward-looking statements (as defined by the Private Securities Litigation Reform Act of 1995) based on management's current expectations and beliefs concerning future developments and their potential effects on the Company. Such statements involve inherent risks and uncertainties, many of which are difficult to predict and are generally beyond the control of the Company. There can be no assurance that future developments affecting the Company will be the same as those anticipated by management. These statements are evidenced by terms such as "anticipate," "estimate," "should," "expect," "believe," "intend," and similar expressions. Although these statements reflect management's good faith beliefs and projections, they are not guarantees of future performance and they may not prove true. These projections involve risk and uncertainties that could cause actual results to differ materially from those addressed in the forward-looking statements. While there is no assurance that any list of risks and uncertainties or risk factors is complete, below are certain factors which could cause actual results to differ materially from those contained or implied in the forward-looking statements: changes in general economic, political, or industry conditions; geopolitical concerns, including the ongoing war in Ukraine; the magnitude and duration of the COVID-19 pandemic and related variants and mutations and their impact on the global economy and financial market conditions and our business, results of operations, and financial condition; uncertainty in U.S. fiscal and monetary policy, including the interest rate policies of the Board of Governors of the Federal Reserve System; inflation/deflation, interest rate, market, and monetary fluctuations; volatility and disruptions in global capital and credit markets; the transition away from USD LIBOR and uncertainty regarding potential alternative reference rates, including SOFR; competitive pressures on product pricing and services; success, impact, and timing of our business strategies, including market acceptance of any new products or services; the impact of changes in financial services policies, laws, and regulations, including those concerning taxes, banking, securities, and insurance, and the application thereof by regulatory bodies; cybersecurity threats and the cost of defending against them, including the costs of compliance with potential legislation to combat cybersecurity at a state, national, or global level; and other factors that may affect our future results. For a discussion of these risks and uncertainties, see the section of the periodic reports filed by Shore Bancshares, Inc. with the Securities and Exchange Commission entitled "Risk Factors".
The Company specifically disclaims any obligation to update any factors or to publicly announce the result of revisions to any of the forward-looking statements included herein to reflect future events or developments.
Shore Bancshares, Inc. Financial Highlights (Unaudited) (Dollars in thousands, except per share data) | |||||||||
For the Three Months Ended | |||||||||
March 31, | |||||||||
2022 | 2021 | Change | |||||||
PROFITABILITY FOR THE PERIOD | |||||||||
Net interest income | $ | 22,430 | $ | 13,800 | 62.5 | % | |||
Provision for credit losses | 600 | 425 | 41.2 | ||||||
Noninterest income | 6,046 | 2,557 | 136.4 | ||||||
Noninterest expense | 20,332 | 10,499 | 93.7 | ||||||
Income before income taxes | 7,544 | 5,433 | 38.9 | ||||||
Income tax expense | 1,931 | 1,435 | 34.6 | ||||||
Net income | $ | 5,613 | $ | 3,998 | 40.4 | ||||
Return on average assets | 0.65 | % | 0.82 | % | (17) | bp | |||
Return on average assets excluding amortization of | 0.76 | 0.82 | (6) | ||||||
Return on average equity | 6.45 | 8.28 | (183) | ||||||
Return on average tangible equity - Non-GAAP (1), (2) | 9.40 | 9.40 | — | ||||||
Net interest margin | 2.78 | 3.00 | (22) | ||||||
Efficiency ratio - GAAP | 71.40 | 64.19 | 721 | ||||||
Efficiency ratio - Non-GAAP (1), (2) | 66.93 | 63.28 | 365 | ||||||
PER SHARE DATA | |||||||||
Basic and diluted net income per common share | $ | 0.28 | $ | 0.34 | (17.6) | % | |||
Dividends paid per common share | $ | 0.12 | $ | 0.12 | — | ||||
Book value per common share at period end | 17.73 | 16.69 | 6.2 | ||||||
Tangible book value per common share at period end - Non- | 14.19 | 15.06 | (5.8) | ||||||
Market value at period end | 20.48 | 17.02 | 20.3 | ||||||
Market range: | |||||||||
High | 21.41 | 18.10 | 18.3 | ||||||
Low | 19.34 | 12.99 | 48.9 | ||||||
AVERAGE BALANCE SHEET DATA | |||||||||
Loans | $ | 2,135,734 | $ | 1,450,883 | 47.2 | % | |||
Investment securities | 531,017 | 227,816 | 133.1 | ||||||
Earning assets | 3,253,549 | 1,867,930 | 74.2 | ||||||
Assets | 3,477,481 | 1,975,951 | 76.0 | ||||||
Deposits | 3,044,213 | 1,742,666 | 74.7 | ||||||
Stockholders' equity | 353,011 | 195,791 | 80.3 | ||||||
CREDIT QUALITY DATA | |||||||||
Net (recoveries) charge-offs | $ | (166) | $ | — | (100.0) | % | |||
Nonaccrual loans | $ | 2,848 | $ | 4,880 | (41.6) | ||||
Loans 90 days past due and still accruing | 459 | 1,188 | (61.4) | ||||||
Other real estate owned | 561 | 205 | — | ||||||
Total nonperforming assets | 3,868 | 6,273 | (38.3) | ||||||
Accruing troubled debt restructurings (TDRs) excluding acquired | 5,004 | 6,456 | (22.5) | ||||||
Total nonperforming assets and accruing TDRs excluding acquired | $ | 8,872 | $ | 12,729 | (30.3) | ||||
CAPITAL AND CREDIT QUALITY RATIOS | |||||||||
Period-end equity to assets | 10.07 | % | 9.61 | % | 46 | bp | |||
Period-end tangible equity to tangible assets - Non-GAAP (1) | 8.22 | 8.76 | (54) | ||||||
Annualized net (recoveries) charge-offs to average loans | (0.03) | — | (3) | ||||||
Allowance for credit losses as a percent of: | |||||||||
Period-end loans (3) | 0.67 | 0.98 | (31) | ||||||
Period-end loans (4) | 0.92 | 1.11 | (19) | ||||||
Nonaccrual loans | 516.50 | 293.30 | 223 | ||||||
Nonperforming assets | 380.30 | 228.17 | 152 | ||||||
Accruing TDRs | 293.96 | 221.70 | 72 | ||||||
Nonperforming assets and accruing TDRs | 165.80 | 112.44 | 53 | ||||||
As a percent of total loans: | |||||||||
Nonaccrual loans | 0.13 | 0.33 | (20) | ||||||
Accruing TDRs | 0.23 | 0.44 | (21) | ||||||
Nonaccrual loans and accruing TDRs | 0.36 | 0.78 | (42) | ||||||
As a percent of total loans+other real estate owned: | |||||||||
Nonperforming assets | 0.18 | 0.43 | (25) | ||||||
Nonperforming assets and accruing TDRs | 0.41 | 0.87 | (46) | ||||||
As a percent of total assets: | |||||||||
Nonaccrual loans | 0.08 | 0.24 | (16) | ||||||
Nonperforming assets | 0.11 | 0.31 | (20) | ||||||
Accruing TDRs | 0.14 | 0.32 | (18) | ||||||
Nonperforming assets and accruing TDRs | 0.25 | 0.63 | (38) | ||||||
(1) | See the recociliation table that begins on page 14 of 15. | ||||||
(2) | This ratio excludes merger related expenses (Non-GAAP). | ||||||
(3) | As of March 31, 2022 and March 31, 2021, these ratios included all loans held for investment, including PPP loans of $14.9 million and $129.1 million, respectively. | ||||||
(4) | As of March 31, 2022 and March 31, 2021, these ratios exclude PPP loans, acquired loans, and the associated purchase discount mark on the acquired loans from both Severn and Northwest. | ||||||
Shore Bancshares, Inc. Consolidated Balance Sheets (Unaudited) (In thousands, except per share data) | ||||||||||||
March 31, 2022 | ||||||||||||
March 31, | December 31, | March 31, | compared to | |||||||||
2022 | 2021 | 2021 | December 31, 2021 | |||||||||
ASSETS | ||||||||||||
Cash and due from banks | $ | 16,206 | $ | 16,919 | $ | 14,553 | (4.2) | % | ||||
Interest-bearing deposits with other banks | 554,770 | 566,694 | 212,533 | (2.1) | ||||||||
Cash and cash equivalents | 570,976 | 583,613 | 227,086 | (2.2) | ||||||||
Investment securities available for sale (at fair value) | 106,695 | 116,982 | 124,103 | (8.8) | ||||||||
Investment securities held to maturity (at amortized cost) | 407,138 | 404,594 | 125,929 | 0.6 | ||||||||
Equity securities, at fair value | 1,305 | 1,372 | 1,382 | (4.9) | ||||||||
Restricted securities | 9,894 | 4,159 | 3,189 | 137.9 | ||||||||
Loans held for sale, at fair value | 12,906 | 37,749 | - | (65.8) | ||||||||
Loans held for investment | 2,181,106 | 2,119,175 | 1,461,522 | 2.9 | ||||||||
Less: allowance for credit losses | (14,710) | (13,944) | (14,313) | 5.5 | ||||||||
Loans, net | 2,166,396 | 2,105,231 | 1,447,209 | 2.9 | ||||||||
Premises and equipment, net | 52,049 | 51,624 | 25,308 | 0.8 | ||||||||
Goodwill | 63,281 | 63,421 | 17,518 | (0.2) | ||||||||
Other intangible assets, net | 7,018 | 7,535 | 1,593 | (6.9) | ||||||||
Other real estate owned, net | 561 | 532 | 205 | 5.5 | ||||||||
Mortgage servicing rights | 5,113 | 4,087 | — | 25.1 | ||||||||
Right of use assets, net | 10,180 | 11,370 | 7,229 | (10.5) | ||||||||
Other assets | 80,985 | 67,867 | 58,880 | 19.3 | ||||||||
Total assets | $ | 3,494,497 | $ | 3,460,136 | $ | 2,039,631 | 1.0 | |||||
LIABILITIES | ||||||||||||
Noninterest-bearing deposits | $ | 876,415 | $ | 927,497 | $ | 533,823 | (5.5) | |||||
Interest-bearing deposits | 2,192,080 | 2,098,739 | 1,266,813 | 4.4 | ||||||||
Total deposits | 3,068,495 | 3,026,236 | 1,800,636 | 1.4 | ||||||||
Securities sold under retail repurchase agreements | — | 4,143 | 3,501 | (100.0) | ||||||||
Advances from FHLB - long-term | 10,094 | 10,135 | — | (0.4) | ||||||||
Subordinated debt | 42,840 | 42,762 | 24,460 | 0.2 | ||||||||
Total borrowings | 52,934 | 57,040 | 27,961 | |||||||||
Lease liabilities | 10,397 | 11,567 | 7,329 | (10.1) | ||||||||
Accrued expenses and other liabilities | 10,807 | 14,600 | 7,601 | (26.0) | ||||||||
Total liabilities | 3,142,633 | 3,109,443 | 1,843,527 | 1.1 | ||||||||
COMMITMENTS AND CONTINGENCIES | ||||||||||||
STOCKHOLDERS' EQUITY | ||||||||||||
Common stock, par value $0.01; authorized 35,000,000 shares | 198 | 198 | 118 | — | ||||||||
Additional paid in capital | 200,640 | 200,473 | 51,445 | 0.1 | ||||||||
Retained earnings | 153,198 | 149,966 | 143,794 | 2.2 | ||||||||
Accumulated other comprehensive income (loss) | (2,172) | 56 | 747 | (3,978.6) | ||||||||
Total stockholders' equity | 351,864 | 350,693 | 196,104 | 0.3 | ||||||||
Total liabilities and stockholders' equity | $ | 3,494,497 | $ | 3,460,136 | $ | 2,039,631 | 1.0 | |||||
Period-end common shares outstanding | 19,843 | 19,808 | 11,752 | 0.2 | ||||||||
Book value per common share | $ | 17.73 | $ | 17.71 | $ | 16.69 | 0.1 | |||||
Shore Bancshares, Inc. Consolidated Statements of Income (Unaudited) (In thousands, except per share data) | |||||||||
For the Three Months Ended | |||||||||
March 31, | |||||||||
2022 | 2021 | % Change | |||||||
INTEREST INCOME | |||||||||
Interest and fees on loans | $ | 22,085 | $ | 14,366 | 53.7 | % | |||
Interest on investment securities: | |||||||||
Taxable | 1,985 | 931 | 113.2 | ||||||
Interest on deposits with other banks | 254 | 47 | 440.4 | ||||||
Total interest income | 24,324 | 15,344 | 58.5 | ||||||
INTEREST EXPENSE | |||||||||
Interest on deposits | 1,358 | 1,184 | 14.7 | ||||||
Interest on short-term borrowings | 2 | 1 | 100.0 | ||||||
Interest on long-term borrowings | 534 | 359 | 48.7 | ||||||
Total interest expense | 1,894 | 1,544 | 22.7 | ||||||
NET INTEREST INCOME | 22,430 | 13,800 | 62.5 | ||||||
Provision for credit losses | 600 | 425 | 41.2 | ||||||
NET INTEREST INCOME AFTER PROVISION | |||||||||
FOR CREDIT LOSSES | 21,830 | 13,375 | 63.2 | ||||||
NONINTEREST INCOME | |||||||||
Service charges on deposit accounts | 1,359 | 674 | 101.6 | ||||||
Trust and investment fee income | 514 | 407 | 26.3 | ||||||
Interchange credits | 1,038 | 869 | 19.4 | ||||||
Mortgage-banking revenue | 1,867 | — | — | ||||||
Title Company revenue | 323 | — | — | ||||||
Other noninterest income | 945 | 607 | 55.7 | ||||||
Total noninterest income | 6,046 | 2,557 | 136.4 | ||||||
NONINTEREST EXPENSE | |||||||||
Salaries and wages | 9,562 | 4,142 | 130.9 | ||||||
Employee benefits | 2,662 | 1,844 | 44.4 | ||||||
Occupancy expense | 1,567 | 814 | 92.5 | ||||||
Furniture and equipment expense | 429 | 307 | 39.7 | ||||||
Data processing | 1,607 | 1,127 | 42.6 | ||||||
Directors' fees | 190 | 149 | 27.5 | ||||||
Amortization of intangible assets | 517 | 126 | 310.3 | ||||||
FDIC insurance premium expense | 343 | 185 | 85.4 | ||||||
Other real estate owned, net | (6) | 1 | (700.0) | ||||||
Legal and professional fees | 637 | 516 | 23.4 | ||||||
Merger related expenses | 730 | — | — | ||||||
Other noninterest expenses | 2,094 | 1,288 | 62.6 | ||||||
Total noninterest expense | 20,332 | 10,499 | 93.7 | ||||||
Income before income taxes | 7,544 | 5,433 | 38.9 | ||||||
Income tax expense | 1,931 | 1,435 | 34.6 | ||||||
NET INCOME | $ | 5,613 | $ | 3,998 | 40.4 | ||||
Weighted average shares outstanding - basic | 19,828 | 11,745 | 68.8 | ||||||
Weighted average shares outstanding - diluted | 19,828 | 11,747 | 68.8 | ||||||
Basic and diluted net income per common share | $ | 0.28 | $ | 0.34 | (17.6) | ||||
Dividends paid per common share | 0.12 | 0.12 | — | ||||||
Shore Bancshares, Inc. Consolidated Average Balance Sheets (Unaudited) (Dollars in thousands) | |||||||||||
For the Three Months Ended | |||||||||||
March 31, | |||||||||||
2022 | 2021 | ||||||||||
Average | Yield/ | Average | Yield/ | ||||||||
balance | rate | balance | rate | ||||||||
Earning assets | |||||||||||
Loans (1), (2), (3) | $ | 2,135,734 | 4.20 | % | $ | 1,450,883 | 4.03 | % | |||
Investment securities | |||||||||||
Taxable | 531,017 | 1.49 | 227,816 | 1.63 | |||||||
Interest-bearing deposits | 586,798 | 0.18 | 189,231 | 0.10 | |||||||
Total earning assets | 3,253,549 | 3.01 | % | 1,867,930 | 3.34 | % | |||||
Cash and due from banks | (15,253) | 19,245 | |||||||||
Other assets | 253,424 | 103,010 | |||||||||
Allowance for credit losses | (14,239) | (14,234) | |||||||||
Total assets | $ | 3,477,481 | $ | 1,975,951 | |||||||
Interest-bearing liabilities | |||||||||||
Demand deposits | $ | 589,737 | 0.16 | % | $ | 438,340 | 0.14 | % | |||
Money market and savings deposits | 1,075,791 | 0.23 | 510,881 | 0.18 | |||||||
Certificates of deposit $100,000 or more | 286,587 | 0.40 | 130,745 | 1.26 | |||||||
Other time deposits | 175,683 | 0.57 | 144,919 | 1.10 | |||||||
Interest-bearing deposits | 2,127,798 | 0.26 | 1,224,885 | 0.39 | |||||||
Securities sold under retail repurchase | |||||||||||
agreements and federal funds purchased | 2,770 | 0.29 | 2,238 | 0.18 | |||||||
Advances from FHLB - long-term | 10,116 | 0.57 | — | — | |||||||
Subordinated debt | 42,804 | 4.93 | 24,443 | 5.96 | |||||||
Total interest-bearing liabilities | 2,183,488 | 0.35 | % | 1,251,566 | 0.50 | % | |||||
Noninterest-bearing deposits | 916,415 | 517,781 | |||||||||
Accrued expenses and other liabilities | 24,567 | 10,813 | |||||||||
Stockholders' equity | 353,011 | 195,791 | |||||||||
Total liabilities and stockholders' equity | $ | 3,477,481 | $ | 1,975,951 | |||||||
Net interest spread | 2.66 | % | 2.84 | % | |||||||
Net interest margin | 2.78 | % | 3.00 | % | |||||||
(1) | All amounts are reported on a tax-equivalent basis computed using the statutory federal income tax rate of 21.0%, exclusive of nondeductible interest expense. | ||||||
(2) | Average loan balances include nonaccrual loans. | ||||||
(3) | Interest income on loans includes accreted loan fees, net of costs and accretion of discounts on acquired loans, which are included in the yield calculations. | ||||||
Shore Bancshares, Inc. Financial Highlights By Quarter (Unaudited) (Dollars in thousands, except per share data) | ||||||||||||||||||||
1st Quarter | 4th Quarter | 3rd Quarter | 2nd Quarter | 1st Quarter | Q1 2022 | Q1 2022 | ||||||||||||||
2022 | 2021 | 2021 | 2021 | 2021 | compared to | compared to | ||||||||||||||
Q1 2022 | Q4 2021 | Q3 2021 | Q2 2021 | Q1 2021 | Q4 2021 | Q1 2021 | ||||||||||||||
PROFITABILITY FOR THE PERIOD | ||||||||||||||||||||
Taxable-equivalent net interest income | $ | 22,469 | $ | 20,652 | $ | 15,623 | $ | 14,141 | $ | 13,836 | 8.8 | % | 62.4 | % | ||||||
Less: Taxable-equivalent adjustment | 39 | 13 | 34 | 38 | 36 | 200.0 | 8.3 | |||||||||||||
Net interest income | 22,430 | 20,639 | 15,589 | 14,103 | 13,800 | 8.7 | 62.5 | |||||||||||||
Provision for credit losses | 600 | (1,723) | 290 | 650 | 425 | 134.8 | 41.2 | |||||||||||||
Noninterest income | 6,046 | 5,129 | 2,909 | 2,903 | 2,557 | 17.9 | 136.4 | |||||||||||||
Noninterest expense | 20,332 | 23,497 | 11,934 | 10,876 | 10,499 | (13.5) | 93.7 | |||||||||||||
Income before income taxes | 7,544 | 3,994 | 6,274 | 5,480 | 5,433 | 88.9 | 38.9 | |||||||||||||
Income tax expense | 1,931 | 1,271 | 1,657 | 1,449 | 1,435 | 51.9 | 34.6 | |||||||||||||
Net income | $ | 5,613 | $ | 2,723 | $ | 4,617 | $ | 4,031 | $ | 3,998 | 106.1 | 40.4 | ||||||||
Return on average assets | 0.65 | % | 0.36 | % | 0.84 | % | 0.78 | % | 0.82 | % | 29 | bp | (17) | bp | ||||||
Return on average assets excluding | 0.76 | 1.07 | 0.94 | 0.86 | 0.82 | (31) | (6) | |||||||||||||
Return on average equity | 6.45 | 3.59 | 9.12 | 8.19 | 8.28 | 286 | (183) | |||||||||||||
Return on average tangible equity - Non-GAAP (1) | 9.40 | 13.06 | 11.12 | 9.89 | 9.40 | (366) | — | |||||||||||||
Net interest margin | 2.78 | 2.87 | 2.99 | 2.91 | 3.00 | (9) | (22) | |||||||||||||
Efficiency ratio - GAAP | 71.40 | 91.19 | 64.52 | 63.95 | 64.19 | (1,979) | 721 | |||||||||||||
Efficiency ratio - Non-GAAP (1), (2) | 66.93 | 60.13 | 60.92 | 60.90 | 63.28 | 680 | 365 | |||||||||||||
PER SHARE DATA | ||||||||||||||||||||
Basic and diluted net income per common share | $ | 0.28 | $ | 0.16 | $ | 0.39 | $ | 0.34 | $ | 0.34 | 75.0 | % | (17.6) | % | ||||||
Dividends paid per common share | 0.12 | 0.12 | 0.12 | 0.12 | 0.12 | — | — | |||||||||||||
Book value per common share at period end | 17.73 | 17.71 | 17.15 | 16.91 | 16.69 | 0.1 | 6.2 | |||||||||||||
Tangible book value per common share | 14.19 | 14.12 | 15.55 | 15.29 | 15.06 | 0.5 | (5.8) | |||||||||||||
Market value at period end | 20.48 | 20.85 | 17.73 | 16.75 | 17.02 | (1.8) | 20.3 | |||||||||||||
Market range: | ||||||||||||||||||||
High | 21.41 | 23.19 | 18.00 | 18.01 | 18.10 | (7.7) | 18.3 | |||||||||||||
Low | 19.34 | 17.50 | 16.35 | 16.10 | 12.99 | 10.5 | 48.9 | |||||||||||||
AVERAGE BALANCE SHEET DATA | ||||||||||||||||||||
Loans | $ | 2,135,734 | $ | 1,887,126 | $ | 1,487,281 | $ | 1,444,684 | $ | 1,450,883 | 13.2 | % | 47.2 | % | ||||||
Investment securities | 531,017 | 468,724 | 334,205 | 286,121 | 227,816 | 13.3 | 133.1 | |||||||||||||
Earning assets | 3,253,549 | 2,842,097 | 2,071,505 | 1,949,509 | 1,867,930 | 14.5 | 74.2 | |||||||||||||
Assets | 3,477,481 | 3,037,262 | 2,184,448 | 2,061,214 | 1,975,951 | 14.5 | 76.0 | |||||||||||||
Deposits | 3,044,213 | 2,547,151 | 1,943,225 | 1,822,148 | 1,742,666 | 19.5 | 74.7 | |||||||||||||
Stockholders' equity | 353,011 | 301,095 | 200,881 | 197,532 | 195,791 | 17.2 | 80.3 | |||||||||||||
CREDIT QUALITY DATA | ||||||||||||||||||||
Net (recoveries) charge-offs | $ | (166) | $ | (142) | $ | (147) | $ | (125) | $ | — | (16.9) | % | (100.0) | % | ||||||
Nonaccrual loans | $ | 2,848 | $ | 2,786 | $ | 3,457 | $ | 3,947 | $ | 4,880 | 2.2 | (41.6) | ||||||||
Loans 90 days past due and still accruing | 459 | 508 | 748 | 752 | 1,188 | (9.6) | (61.4) | |||||||||||||
Other real estate owned | 561 | 532 | 203 | 203 | 205 | 5.5 | 173.7 | |||||||||||||
Total nonperforming assets | $ | 3,868 | $ | 3,826 | $ | 4,408 | $ | 4,902 | $ | 6,273 | 1.1 | (38.3) | ||||||||
Accruing troubled debt restructurings | $ | 5,004 | $ | 5,667 | $ | 5,750 | $ | 6,338 | $ | 6,456 | (11.7) | (22.5) | ||||||||
Total nonperforming assets and accruing TDRs | $ | 8,872 | $ | 9,493 | $ | 10,158 | $ | 11,240 | $ | 12,729 | (6.5) | (30.3) | ||||||||
CAPITAL AND CREDIT QUALITY RATIOS | ||||||||||||||||||||
Period-end equity to assets | 10.07 | % | 10.14 | % | 8.92 | % | 9.37 | % | 9.61 | % | (7) | bp | 46 | bp | ||||||
Period-end tangible equity to tangible assets - Non-GAAP (1) | 8.22 | 8.25 | 8.15 | 8.55 | 8.76 | (3) | (54) | |||||||||||||
Annualized net (recoveries) charge-offs to average loans | (0.03) | (0.03) | (0.04) | (0.03) | — | — | (3) | |||||||||||||
Allowance for credit losses as a percent of: | ||||||||||||||||||||
Period-end loans (3) | 0.67 | 0.66 | 1.04 | 1.02 | 0.98 | 1 | (31) | |||||||||||||
Period-end loans (4) | 0.92 | 0.93 | 1.10 | 1.12 | 1.11 | (1) | (19) | |||||||||||||
Nonaccrual loans | 516.50 | 500.50 | 449.09 | 382.27 | 293.30 | 1,600 | 223 | |||||||||||||
Nonperforming assets | 380.30 | 364.45 | 352.20 | 307.79 | 228.17 | 1,585 | 152 | |||||||||||||
Accruing TDRs | 293.96 | 246.06 | 270.00 | 238.06 | 221.70 | 4,790 | 72 | |||||||||||||
Nonperforming assets and accruing TDRs | 165.80 | 146.89 | 152.84 | 134.23 | 112.44 | 1,891 | 53 | |||||||||||||
As a percent of total loans: | ||||||||||||||||||||
Nonaccrual loans | 0.13 | 0.13 | 0.23 | 0.27 | 0.33 | — | (20) | |||||||||||||
Accruing TDRs excluding acquired | 0.23 | 0.27 | 0.38 | 0.43 | 0.44 | (4) | (21) | |||||||||||||
Nonaccrual loans and accruing TDRs excluding acquired | 0.36 | 0.40 | 0.62 | 0.70 | 0.78 | (4) | (42) | |||||||||||||
As a percent of total loans+other real estate owned: | ||||||||||||||||||||
Nonperforming assets | 0.18 | 0.18 | 0.29 | 0.33 | 0.43 | — | (25) | |||||||||||||
Nonperforming assets and accruing TDRs | 0.41 | 0.45 | 0.68 | 0.76 | 0.87 | (4) | (46) | |||||||||||||
As a percent of total assets: | ||||||||||||||||||||
Nonaccrual loans | 0.08 | 0.08 | 0.15 | 0.19 | 0.24 | — | (16) | |||||||||||||
Nonperforming assets | 0.11 | 0.11 | 0.19 | 0.23 | 0.31 | — | (20) | |||||||||||||
Accruing TDRs | 0.14 | 0.16 | 0.25 | 0.30 | 0.32 | (2) | (18) | |||||||||||||
Nonperforming assets and accruing TDRs | 0.25 | 0.27 | 0.44 | 0.53 | 0.63 | (2) | (38) | |||||||||||||
(1) | See the reconciliation table that begins on page 14 of 15. | ||||||
(2) | This ratio excludes merger related expenses (Non-GAAP). | ||||||
(3) | Includes all loans held for investment, including PPP loan balances for all periods shown. | ||||||
(4) | For all periods shown, these ratios exclude PPP loans, acquired loans, and the associated purchase discount mark on the acquired loans from both Severn and Northwest. | ||||||
Shore Bancshares, Inc. Consolidated Statements of Income By Quarter (Unaudited) (In thousands, except per share data) | ||||||||||||||||||||
Q1 2022 | Q1 2022 | |||||||||||||||||||
compared to | compared to | |||||||||||||||||||
Q1 2022 | Q4 2021 | Q3 2021 | Q2 2021 | Q1 2021 | Q4 2021 | Q1 2021 | ||||||||||||||
INTEREST INCOME | ||||||||||||||||||||
Interest and fees on loans | $ | 22,085 | $ | 20,564 | $ | 15,484 | $ | 14,381 | $ | 14,366 | 7.4 | % | 53.7 | % | ||||||
Interest on investment securities: | ||||||||||||||||||||
Taxable | 1,985 | 1,663 | 1,318 | 1,095 | 931 | 19.4 | 113.2 | |||||||||||||
Interest on deposits with other banks | 254 | 169 | 97 | 55 | 47 | 50.3 | 440.4 | |||||||||||||
Total interest income | 24,324 | 22,396 | 16,899 | 15,531 | 15,344 | 8.6 | 58.5 | |||||||||||||
INTEREST EXPENSE | ||||||||||||||||||||
Interest on deposits | 1,358 | 1,272 | 949 | 1,056 | 1,184 | 6.8 | 14.7 | |||||||||||||
Interest on short-term borrowings | 2 | 3 | 2 | 2 | 1 | (33.3) | 100.0 | |||||||||||||
Interest on long-term borrowings | 534 | 482 | 359 | 370 | 359 | 10.8 | 48.7 | |||||||||||||
Total interest expense | 1,894 | 1,757 | 1,310 | 1,428 | 1,544 | 7.8 | 22.7 | |||||||||||||
NET INTEREST INCOME | 22,430 | 20,639 | 15,589 | 14,103 | 13,800 | 8.7 | 62.5 | |||||||||||||
Provision for credit losses | 600 | (1,723) | 290 | 650 | 425 | 134.8 | 41.2 | |||||||||||||
NET INTEREST INCOME AFTER PROVISION | ||||||||||||||||||||
FOR CREDIT LOSSES | 21,830 | 22,362 | 15,299 | 13,453 | 13,375 | (2.4) | 63.2 | |||||||||||||
NONINTEREST INCOME | ||||||||||||||||||||
Service charges on deposit accounts | 1,359 | 1,234 | 805 | 683 | 674 | 10.1 | 101.6 | |||||||||||||
Trust and investment fee income | 514 | 522 | 477 | 475 | 407 | (1.5) | 26.3 | |||||||||||||
Gains on sales and calls of investment securities | — | — | 2 | — | — | — | — | |||||||||||||
Interchange credits | 1,038 | 1,043 | 1,016 | 1,036 | 869 | (0.5) | 19.4 | |||||||||||||
Mortgage-banking revenue | 1,867 | 948 | — | — | — | 96.9 | — | |||||||||||||
Title Company revenue | 323 | 247 | — | — | — | 30.8 | — | |||||||||||||
Other noninterest income | 945 | 1,135 | 609 | 709 | 607 | (16.7) | 55.7 | |||||||||||||
Total noninterest income | 6,046 | 5,129 | 2,909 | 2,903 | 2,557 | 17.9 | 136.4 | |||||||||||||
NONINTEREST EXPENSE | ||||||||||||||||||||
Salaries and wages | 9,562 | 7,727 | 5,091 | 4,262 | 4,142 | 23.7 | 130.9 | |||||||||||||
Employee benefits | 2,662 | 2,271 | 1,654 | 1,493 | 1,844 | 17.2 | 44.4 | |||||||||||||
Occupancy expense | 1,567 | 1,263 | 843 | 770 | 814 | 24.1 | 92.5 | |||||||||||||
Furniture and equipment expense | 429 | 385 | 449 | 412 | 307 | 11.4 | 39.7 | |||||||||||||
Data processing | 1,607 | 1,487 | 1,170 | 1,217 | 1,127 | 8.1 | 42.6 | |||||||||||||
Directors' fees | 190 | 170 | 147 | 154 | 149 | 11.8 | 27.5 | |||||||||||||
Amortization of intangible assets | 517 | 381 | 107 | 120 | 126 | 35.7 | 310.3 | |||||||||||||
FDIC insurance premium expense | 343 | 362 | 245 | 223 | 185 | (5.2) | 85.4 | |||||||||||||
Other real estate owned expenses, net | (6) | (2) | 4 | 1 | 1 | (200.0) | (700.0) | |||||||||||||
Legal and professional fees | 637 | 150 | 428 | 648 | 516 | 324.7 | 23.4 | |||||||||||||
Merger related expenses | 730 | 7,615 | 538 | 377 | — | (90.4) | — | |||||||||||||
Other noninterest expenses | 2,094 | 1,688 | 1,258 | 1,199 | 1,288 | 24.1 | 62.6 | |||||||||||||
Total noninterest expense | 20,332 | 23,497 | 11,934 | 10,876 | 10,499 | (13.5) | 93.7 | |||||||||||||
Income before income taxes | 7,544 | 3,994 | 6,274 | 5,480 | 5,433 | 88.9 | 38.9 | |||||||||||||
Income tax expense | 1,931 | 1,271 | 1,657 | 1,449 | 1,435 | 51.9 | 34.6 | |||||||||||||
NET INCOME | $ | 5,613 | $ | 2,723 | $ | 4,617 | $ | 4,031 | $ | 3,998 | 106.1 | 40.4 | ||||||||
Weighted average shares outstanding - basic | 19,828 | 17,180 | 11,752 | 11,752 | 11,745 | 15.4 | 68.8 | |||||||||||||
Weighted average shares outstanding - diluted | 19,828 | 17,180 | 11,752 | 11,754 | 11,747 | 15.4 | 68.8 | |||||||||||||
Basic and diluted net income per common share | $ | 0.28 | $ | 0.16 | $ | 0.39 | $ | 0.34 | $ | 0.34 | 75.0 | (17.6) | ||||||||
Dividends paid per common share | 0.12 | 0.12 | 0.12 | 0.12 | 0.12 | — | — | |||||||||||||
Shore Bancshares, Inc. Consolidated Average Balance Sheets By Quarter (Unaudited) (Dollars in thousands) | ||||||||||||||||||||||||||||||
Average balance | ||||||||||||||||||||||||||||||
Q1 2022 | Q1 2022 | |||||||||||||||||||||||||||||
compared to | compared to | |||||||||||||||||||||||||||||
Q1 2022 | Q4 2021 | Q3 2021 | Q2 2021 | Q1 2021 | Q4 2021 | Q1 2021 | ||||||||||||||||||||||||
Average | Yield/ | Average | Yield/ | Average | Yield/ | Average | Yield/ | Average | Yield/ | |||||||||||||||||||||
balance | rate | balance | rate | balance | rate | balance | rate | balance | rate | |||||||||||||||||||||
Earning assets | ||||||||||||||||||||||||||||||
Loans (1), (2), (3) | $ | 2,135,734 | 4.20 | % | $ | 1,887,126 | 4.33 | % | $ | 1,487,281 | 4.14 | % | $ | 1,444,684 | 4.00 | % | $ | 1,450,883 | 4.03 | % | 13.2 | % | 47.2 | % | ||||||
Investment securities | ||||||||||||||||||||||||||||||
Taxable | 531,017 | 1.49 | 468,724 | 1.42 | 334,205 | 1.58 | 286,121 | 1.53 | 227,816 | 1.63 | 13.3 | 133.1 | ||||||||||||||||||
Interest-bearing deposits | 586,798 | 0.18 | 486,247 | 0.14 | 250,019 | 0.15 | 218,704 | 0.10 | 189,231 | 0.10 | 20.7 | 210.1 | ||||||||||||||||||
Total earning assets | 3,253,549 | 3.01 | % | 2,842,097 | 3.11 | % | 2,071,505 | 3.24 | % | 1,949,509 | 3.20 | % | 1,867,930 | 3.34 | % | 14.5 | 74.2 | |||||||||||||
Cash and due from banks | (15,253) | 22,625 | 19,453 | 16,908 | 19,245 | (167.4) | (179.3) | |||||||||||||||||||||||
Other assets | 253,424 | 188,399 | 108,989 | 109,457 | 103,010 | 34.5 | 146.0 | |||||||||||||||||||||||
Allowance for credit losses | (14,239) | (15,859) | (15,499) | (14,660) | (14,234) | (10.2) | — | |||||||||||||||||||||||
Total assets | $ | 3,477,481 | $ | 3,037,262 | $ | 2,184,448 | $ | 2,061,214 | $ | 1,975,951 | 14.5 | 76.0 | ||||||||||||||||||
Interest-bearing liabilities | ||||||||||||||||||||||||||||||
Demand deposits | $ | 589,737 | 0.16 | % | $ | 494,081 | 0.14 | % | $ | 462,950 | 0.14 | % | $ | 405,473 | 0.13 | % | $ | 438,340 | 0.14 | % | 19.4 | 34.5 | ||||||||
Money market and savings deposits | 1,075,791 | 0.23 | 1,001,115 | 0.26 | 644,330 | 0.18 | 605,202 | 0.17 | 510,881 | 0.18 | 7.5 | 110.6 | ||||||||||||||||||
Certificates of deposit $100,000 or more | 286,587 | 0.40 | 174,268 | 0.49 | 136,059 | 0.71 | 135,376 | 1.04 | 130,745 | 1.26 | 64.5 | 119.2 | ||||||||||||||||||
Other time deposits | 175,683 | 0.57 | 173,975 | 0.50 | 142,777 | 0.68 | 143,821 | 0.90 | 144,919 | 1.10 | 1.0 | 21.2 | ||||||||||||||||||
Interest-bearing deposits | 2,127,798 | 0.26 | 1,843,439 | 0.27 | 1,386,116 | 0.27 | 1,289,872 | 0.33 | 1,224,885 | 0.39 | 15.4 | 73.7 | ||||||||||||||||||
Securities sold under retail repurchase agreements | ||||||||||||||||||||||||||||||
and federal funds purchased | 2,770 | 0.29 | 3,972 | 0.30 | 2,718 | 0.29 | 3,123 | 0.26 | 2,238 | 0.18 | (30.3) | 23.8 | ||||||||||||||||||
Advances from FHLB - long-term | 10,116 | 0.57 | 6,630 | 2.21 | — | — | — | — | — | — | 100.0 | 100.0 | ||||||||||||||||||
Subordinated debt | 42,804 | 4.93 | 36,589 | 5.12 | 24,504 | 5.81 | 24,474 | 6.06 | 24,443 | 5.96 | 17.0 | 75.1 | ||||||||||||||||||
Total interest-bearing liabilities | 2,183,488 | 0.35 | % | 1,890,630 | 0.37 | % | 1,413,338 | 0.37 | % | 1,317,469 | 0.43 | % | 1,251,566 | 0.50 | % | 15.5 | 74.5 | |||||||||||||
Noninterest-bearing deposits | 916,415 | 703,712 | 557,109 | 532,276 | 517,781 | 30.2 | 77.0 | |||||||||||||||||||||||
Accrued expenses and other liabilities | 24,567 | 141,825 | 13,120 | 13,937 | 10,813 | (82.7) | 127.2 | |||||||||||||||||||||||
Stockholders' equity | 353,011 | 301,095 | 200,881 | 197,532 | 195,791 | 17.2 | 80.3 | |||||||||||||||||||||||
Total liabilities and stockholders' equity | $ | 3,477,481 | $ | 3,037,262 | $ | 2,184,448 | $ | 2,061,214 | $ | 1,975,951 | 14.5 | 76.0 | ||||||||||||||||||
Net interest spread | 2.66 | % | 2.74 | % | 2.87 | % | 2.77 | % | 2.84 | % | ||||||||||||||||||||
Net interest margin | 2.78 | % | 2.87 | % | 2.99 | % | 2.91 | % | 3.00 | % | ||||||||||||||||||||
(1) | All amounts are reported on a tax-equivalent basis computed using the statutory federal income tax rate of 21.0%, exclusive of nondeductible interest expense. | ||||||
(2) | Average loan balances include nonaccrual loans. | ||||||
(3) | Interest income on loans includes accreted loan fees, net of costs and accretion of discounts on acquired loans, which are included in the yield calculations. | ||||||
Shore Bancshares, Inc. Reconciliation of Generally Accepted Accounting Principles (GAAP) and Non-GAAP Measures (Unaudited) (In thousands, except per share data) | ||||||||||||||||||||||
YTD | YTD | |||||||||||||||||||||
Q1 2022 | Q4 2021 | Q3 2021 | Q2 2021 | Q1 2021 | 3/31/2022 | 3/31/2021 | ||||||||||||||||
The following reconciles return on average equity and return | ||||||||||||||||||||||
Net Income | $ | 5,613 | $ | 2,723 | $ | 4,617 | $ | 4,031 | $ | 3,998 | $ | 5,613 | $ | 3,998 | ||||||||
Net Income - annualized (A) | $ | 22,764 | $ | 10,803 | $ | 18,317 | $ | 16,168 | $ | 16,214 | $ | 22,764 | $ | 16,214 | ||||||||
Net income, excluding net amortization of intangible assets | ||||||||||||||||||||||
and merger related expenses | $ | 6,541 | $ | 8,176 | $ | 5,098 | $ | 4,402 | $ | 4,092 | $ | 6,541 | $ | 4,092 | ||||||||
Net income, excluding net amortization of intangible assets | $ | 26,527 | $ | 32,437 | $ | 20,226 | $ | 17,656 | $ | 16,595 | $ | 26,527 | $ | 16,595 | ||||||||
Return on average assets excluding net amortization of intangible assets | 0.76 | % | 1.07 | % | 0.94 | % | 0.86 | % | 0.82 | % | 0.76 | % | 0.82 | % | ||||||||
Average stockholders' equity (C) | $ | 353,011 | $ | 301,095 | $ | 200,881 | $ | 197,532 | $ | 195,791 | $ | 353,011 | $ | 195,791 | ||||||||
Less: Average goodwill and other intangible assets | (70,711) | (52,692) | (18,942) | (19,053) | (19,178) | (70,711) | (19,178) | |||||||||||||||
Average tangible equity (D) | $ | 282,300 | $ | 248,403 | $ | 181,939 | $ | 178,479 | $ | 176,613 | $ | 282,300 | $ | 176,613 | ||||||||
Return on average equity (GAAP) (A)/(C) | 6.45 | % | 3.59 | % | 9.12 | % | 8.19 | % | 8.28 | % | 6.45 | % | 8.28 | % | ||||||||
Return on average tangible equity (Non-GAAP) (B)/(D) | 9.40 | % | 13.06 | % | 11.12 | % | 9.89 | % | 9.40 | % | 9.40 | % | 9.40 | % | ||||||||
The following reconciles GAAP efficiency ratio and non | ||||||||||||||||||||||
Noninterest expense (E) | $ | 20,332 | $ | 23,497 | $ | 11,934 | $ | 10,876 | $ | 10,499 | $ | 20,332 | $ | 10,499 | ||||||||
Less: Amortization of intangible assets | (517) | (381) | (107) | (120) | (126) | (517) | (126) | |||||||||||||||
Merger Expenses | (730) | (7,615) | (538) | (377) | — | (730) | — | |||||||||||||||
Adjusted noninterest expense (F) | $ | 19,085 | $ | 15,501 | $ | 11,289 | $ | 10,379 | $ | 10,373 | $ | 19,085 | $ | 10,373 | ||||||||
Net interest income (G) | 22,430 | 20,639 | 15,589 | 14,103 | 13,800 | 22,430 | 13,800 | |||||||||||||||
Add: Taxable-equivalent adjustment | 39 | 13 | 34 | 38 | 36 | 39 | 36 | |||||||||||||||
Taxable-equivalent net interest income (H) | $ | 22,469 | $ | 20,652 | $ | 15,623 | $ | 14,141 | $ | 13,836 | $ | 22,469 | $ | 13,836 | ||||||||
Noninterest income (I) | $ | 6,046 | $ | 5,129 | $ | 2,909 | $ | 2,903 | $ | 2,557 | $ | 6,046 | 2,557 | |||||||||
Less: Investment securities (gains) | — | — | (2) | — | — | — | — | |||||||||||||||
Adjusted noninterest income (J) | $ | 6,046 | $ | 5,129 | $ | 2,907 | $ | 2,903 | $ | 2,557 | $ | 6,046 | $ | 2,557 | ||||||||
Efficiency ratio (GAAP) (E)/(G)+(I) | 71.40 | % | 91.19 | % | 64.52 | % | 63.95 | % | 64.19 | % | 71.40 | % | 64.19 | % | ||||||||
Efficiency ratio (Non-GAAP) (F)/(H)+(J) | 66.93 | % | 60.13 | % | 60.92 | % | 60.90 | % | 63.28 | % | 66.93 | % | 63.28 | % | ||||||||
The following reconciles book value per common share | ||||||||||||||||||||||
Stockholders' equity (L) | $ | 351,864 | $ | 350,693 | $ | 201,607 | $ | 198,682 | $ | 196,104 | ||||||||||||
Less: Goodwill and other intangible assets | (70,299) | (70,956) | (18,883) | (18,991) | (19,111) | |||||||||||||||||
Tangible equity (M) | $ | 281,565 | $ | 279,737 | $ | 182,724 | $ | 179,691 | $ | 176,993 | ||||||||||||
Shares outstanding (N) | 19,843 | 19,808 | 11,752 | 11,752 | 11,752 | |||||||||||||||||
Book value per common share (GAAP) (L)/(N) | $ | 17.73 | $ | 17.71 | $ | 17.15 | $ | 16.91 | $ | 16.69 | ||||||||||||
Tangible book value per common share (Non-GAAP) (M)/(N) | $ | 14.19 | $ | 14.12 | $ | 15.55 | $ | 15.29 | $ | 15.06 | ||||||||||||
The following reconciles equity to assets and tangible equity | ||||||||||||||||||||||
Stockholders' equity (O) | $ | 351,864 | $ | 350,693 | $ | 201,607 | $ | 198,682 | $ | 196,104 | ||||||||||||
Less: Goodwill and other intangible assets | (70,299) | (70,956) | (18,883) | (18,991) | (19,111) | |||||||||||||||||
Tangible equity (P) | $ | 281,565 | $ | 279,737 | $ | 182,724 | $ | 179,691 | $ | 176,993 | ||||||||||||
Assets (Q) | $ | 3,494,497 | $ | 3,460,136 | $ | 2,260,774 | $ | 2,120,260 | $ | 2,039,631 | ||||||||||||
Less: Goodwill and other intangible assets | (70,299) | (70,956) | (18,883) | (18,991) | (19,111) | |||||||||||||||||
Tangible assets (R) | $ | 3,424,198 | $ | 3,389,180 | $ | 2,241,891 | $ | 2,101,269 | $ | 2,020,520 | ||||||||||||
Period-end equity/assets (GAAP) (O)/(Q) | 10.07 | % | 10.14 | % | 8.92 | % | 9.37 | % | 9.61 | % | ||||||||||||
Period-end tangible equity/tangible assets (Non-GAAP) (P)/(R) | 8.22 | % | 8.25 | % | 8.15 | % | 8.55 | % | 8.76 | % | ||||||||||||
Note 1: | Management believes that reporting tangible equity and tangible assets more closely approximates the adequacy of capital for regulatory purposes. | ||||||
Note 2: | Management believes that reporting the non-GAAP efficiency ratio more closely measures its effectiveness of controlling cash-based operating activities. | ||||||
View original content to download multimedia:https://www.prnewswire.com/news-releases/shore-bancshares-reports-first-quarter-2022-financial-results-301535782.html
SOURCE Shore Bancshares, Inc.
Government
Survey Shows Declining Concerns Among Americans About COVID-19
Survey Shows Declining Concerns Among Americans About COVID-19
A new survey reveals that only 20% of Americans view covid-19 as "a major threat"…
Share this:


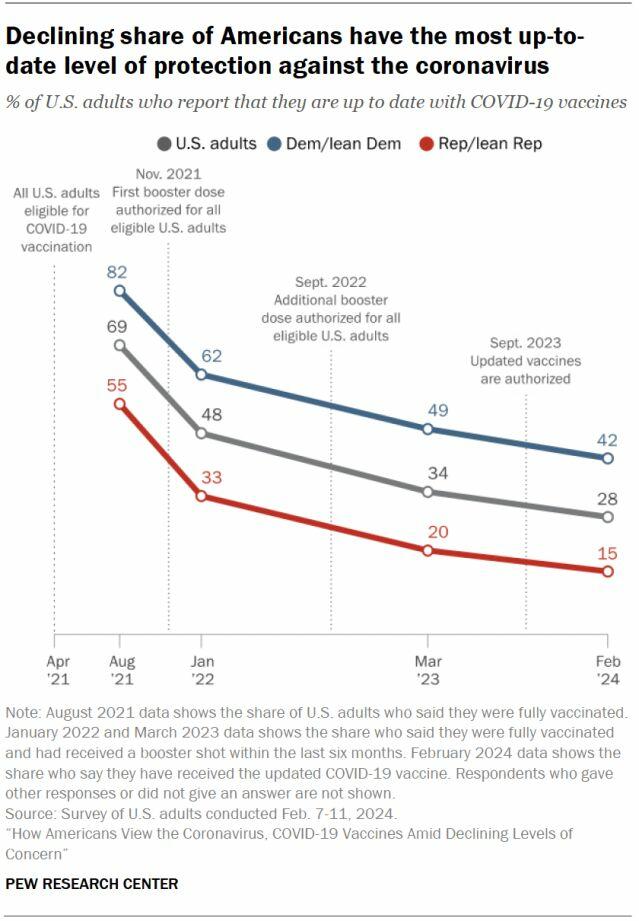
A new survey reveals that only 20% of Americans view covid-19 as "a major threat" to the health of the US population - a sharp decline from a high of 67% in July 2020.
What's more, the Pew Research Center survey conducted from Feb. 7 to Feb. 11 showed that just 10% of Americans are concerned that they will catch the disease and require hospitalization.
"This data represents a low ebb of public concern about the virus that reached its height in the summer and fall of 2020, when as many as two-thirds of Americans viewed COVID-19 as a major threat to public health," reads the report, which was published March 7.
According to the survey, half of the participants understand the significance of researchers and healthcare providers in understanding and treating long COVID - however 27% of participants consider this issue less important, while 22% of Americans are unaware of long COVID.
What's more, while Democrats were far more worried than Republicans in the past, that gap has narrowed significantly.
"In the pandemic’s first year, Democrats were routinely about 40 points more likely than Republicans to view the coronavirus as a major threat to the health of the U.S. population. This gap has waned as overall levels of concern have fallen," reads the report.
More via the Epoch Times;
The survey found that three in ten Democrats under 50 have received an updated COVID-19 vaccine, compared with 66 percent of Democrats ages 65 and older.
Moreover, 66 percent of Democrats ages 65 and older have received the updated COVID-19 vaccine, while only 24 percent of Republicans ages 65 and older have done so.
“This 42-point partisan gap is much wider now than at other points since the start of the outbreak. For instance, in August 2021, 93 percent of older Democrats and 78 percent of older Republicans said they had received all the shots needed to be fully vaccinated (a 15-point gap),” it noted.
COVID-19 No Longer an Emergency
The U.S. Centers for Disease Control and Prevention (CDC) recently issued its updated recommendations for the virus, which no longer require people to stay home for five days after testing positive for COVID-19.
The updated guidance recommends that people who contracted a respiratory virus stay home, and they can resume normal activities when their symptoms improve overall and their fever subsides for 24 hours without medication.
“We still must use the commonsense solutions we know work to protect ourselves and others from serious illness from respiratory viruses, this includes vaccination, treatment, and staying home when we get sick,” CDC director Dr. Mandy Cohen said in a statement.
The CDC said that while the virus remains a threat, it is now less likely to cause severe illness because of widespread immunity and improved tools to prevent and treat the disease.
“Importantly, states and countries that have already adjusted recommended isolation times have not seen increased hospitalizations or deaths related to COVID-19,” it stated.
The federal government suspended its free at-home COVID-19 test program on March 8, according to a website set up by the government, following a decrease in COVID-19-related hospitalizations.
According to the CDC, hospitalization rates for COVID-19 and influenza diseases remain “elevated” but are decreasing in some parts of the United States.
Government
Rand Paul Teases Senate GOP Leader Run – Musk Says “I Would Support”
Rand Paul Teases Senate GOP Leader Run – Musk Says "I Would Support"
Republican Kentucky Senator Rand Paul on Friday hinted that he may jump…
Share this:


Republican Kentucky Senator Rand Paul on Friday hinted that he may jump into the race to become the next Senate GOP leader, and Elon Musk was quick to support the idea. Republicans must find a successor for periodically malfunctioning Mitch McConnell, who recently announced he'll step down in November, though intending to keep his Senate seat until his term ends in January 2027, when he'd be within weeks of turning 86.
So far, the announced field consists of two quintessential establishment types: John Cornyn of Texas and John Thune of South Dakota. While John Barrasso's name had been thrown around as one of "The Three Johns" considered top contenders, the Wyoming senator on Tuesday said he'll instead seek the number two slot as party whip.
Paul used X to tease his potential bid for the position which -- if the GOP takes back the upper chamber in November -- could graduate from Minority Leader to Majority Leader. He started by telling his 5.1 million followers he'd had lots of people asking him about his interest in running...
Thousands of people have been asking if I'd run for Senate leadership...
— Rand Paul (@RandPaul) March 8, 2024
...then followed up with a poll in which he predictably annihilated Cornyn and Thune, taking a 96% share as of Friday night, with the other two below 2% each.
????????️VOTE NOW ????️ ???? Who would you like to be the next Senate leader?
— Rand Paul (@RandPaul) March 8, 2024
Elon Musk was quick to back the idea of Paul as GOP leader, while daring Cornyn and Thune to follow Paul's lead by throwing their names out for consideration by the Twitter-verse X-verse.
I would support Rand Paul and suspect that other candidates will not actually run polls out of concern for the results, but let’s see if they will!
— Elon Musk (@elonmusk) March 8, 2024
Paul has been a stalwart opponent of security-state mass surveillance, foreign interventionism -- to include shoveling billions of dollars into the proxy war in Ukraine -- and out-of-control spending in general. He demonstrated the latter passion on the Senate floor this week as he ridiculed the latest kick-the-can spending package:
This bill is an insult to the American people. The earmarks are all the wasteful spending that you could ever hope to see, and it should be defeated. Read more: https://t.co/Jt8K5iucA4 pic.twitter.com/I5okd4QgDg
— Senator Rand Paul (@SenRandPaul) March 8, 2024
In February, Paul used Senate rules to force his colleagues into a grueling Super Bowl weekend of votes, as he worked to derail a $95 billion foreign aid bill. "I think we should stay here as long as it takes,” said Paul. “If it takes a week or a month, I’ll force them to stay here to discuss why they think the border of Ukraine is more important than the US border.”
Don't expect a Majority Leader Paul to ditch the filibuster -- he's been a hardy user of the legislative delay tactic. In 2013, he spoke for 13 hours to fight the nomination of John Brennan as CIA director. In 2015, he orated for 10-and-a-half-hours to oppose extension of the Patriot Act.
Among the general public, Paul is probably best known as Capitol Hill's chief tormentor of Dr. Anthony Fauci, who was director of the National Institute of Allergy and Infectious Disease during the Covid-19 pandemic. Paul says the evidence indicates the virus emerged from China's Wuhan Institute of Virology. He's accused Fauci and other members of the US government public health apparatus of evading questions about their funding of the Chinese lab's "gain of function" research, which takes natural viruses and morphs them into something more dangerous. Paul has pointedly said that Fauci committed perjury in congressional hearings and that he belongs in jail "without question."
Musk is neither the only nor the first noteworthy figure to back Paul for party leader. Just hours after McConnell announced his upcoming step-down from leadership, independent 2024 presidential candidate Robert F. Kennedy, Jr voiced his support:
Mitch McConnell, who has served in the Senate for almost 40 years, announced he'll step down this November.
— Robert F. Kennedy Jr (@RobertKennedyJr) February 28, 2024
Part of public service is about knowing when to usher in a new generation. It’s time to promote leaders in Washington, DC who won’t kowtow to the military contractors or…
In a testament to the extent to which the establishment recoils at the libertarian-minded Paul, mainstream media outlets -- which have been quick to report on other developments in the majority leader race -- pretended not to notice that Paul had signaled his interest in the job. More than 24 hours after Paul's test-the-waters tweet-fest began, not a single major outlet had brought it to the attention of their audience.
That may be his strongest endorsement yet.
Government
The Great Replacement Loophole: Illegal Immigrants Score 5-Year Work Benefit While “Waiting” For Deporation, Asylum
The Great Replacement Loophole: Illegal Immigrants Score 5-Year Work Benefit While "Waiting" For Deporation, Asylum
Over the past several…
Share this:


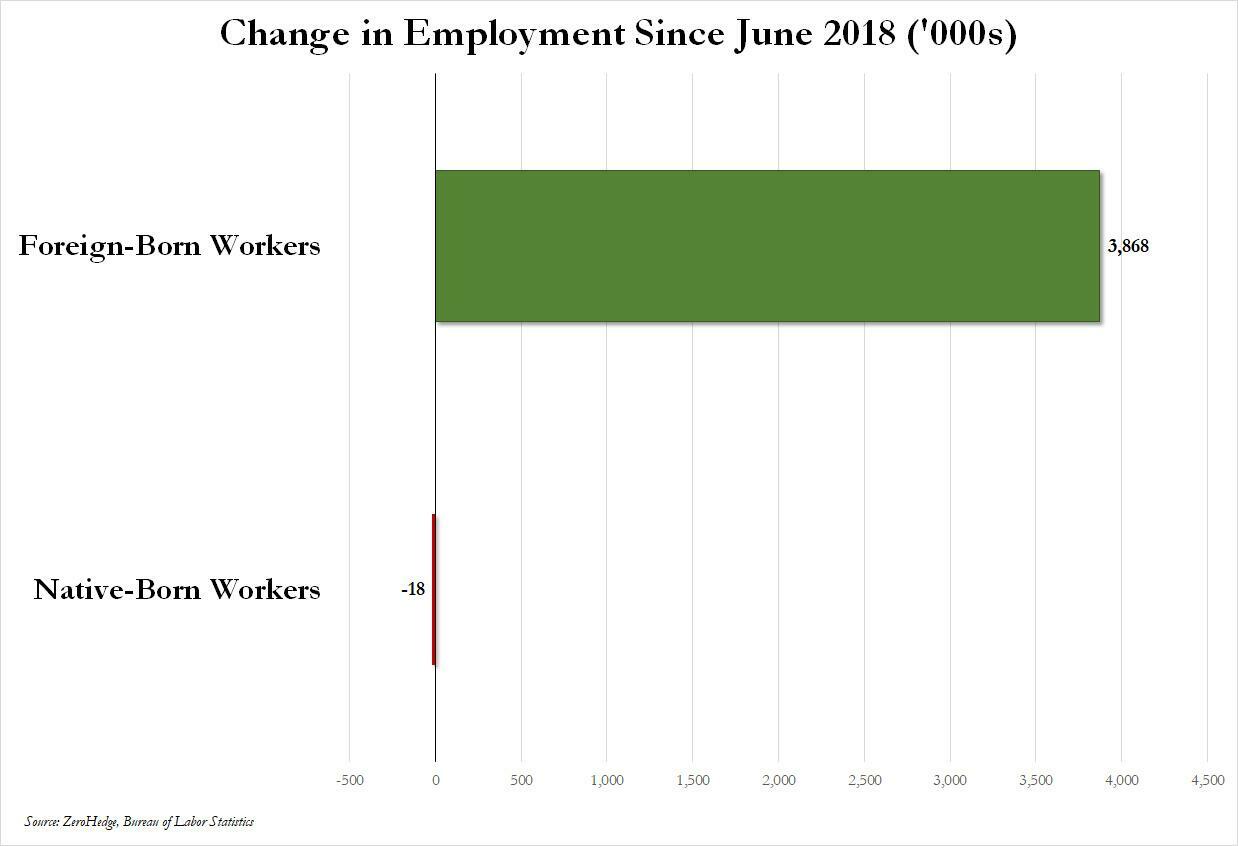
Over the past several months we've pointed out that there has been zero job creation for native-born workers since the summer of 2018...
... and that since Joe Biden was sworn into office, most of the post-pandemic job gains the administration continuously brags about have gone foreign-born (read immigrants, mostly illegal ones) workers.
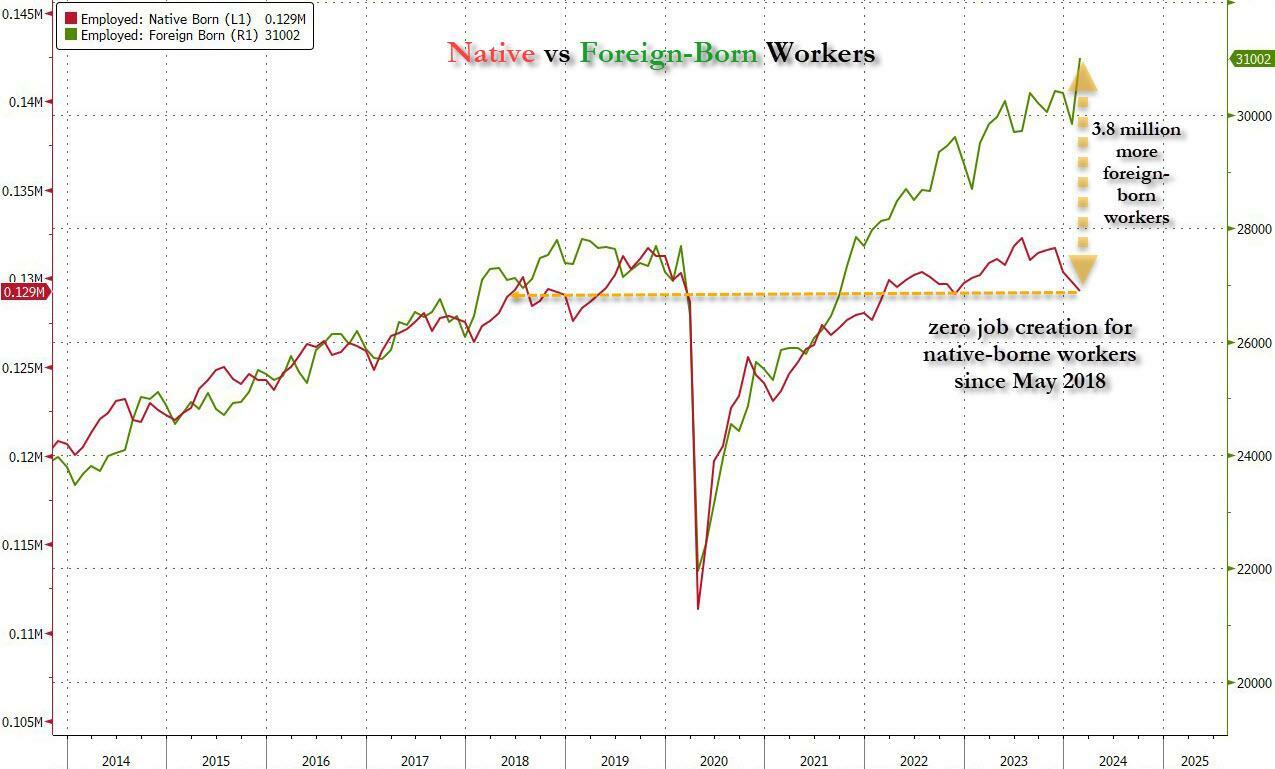
And while the left might find this data almost as verboten as FBI crime statistics - as it directly supports the so-called "great replacement theory" we're not supposed to discuss - it also coincides with record numbers of illegal crossings into the United States under Biden.
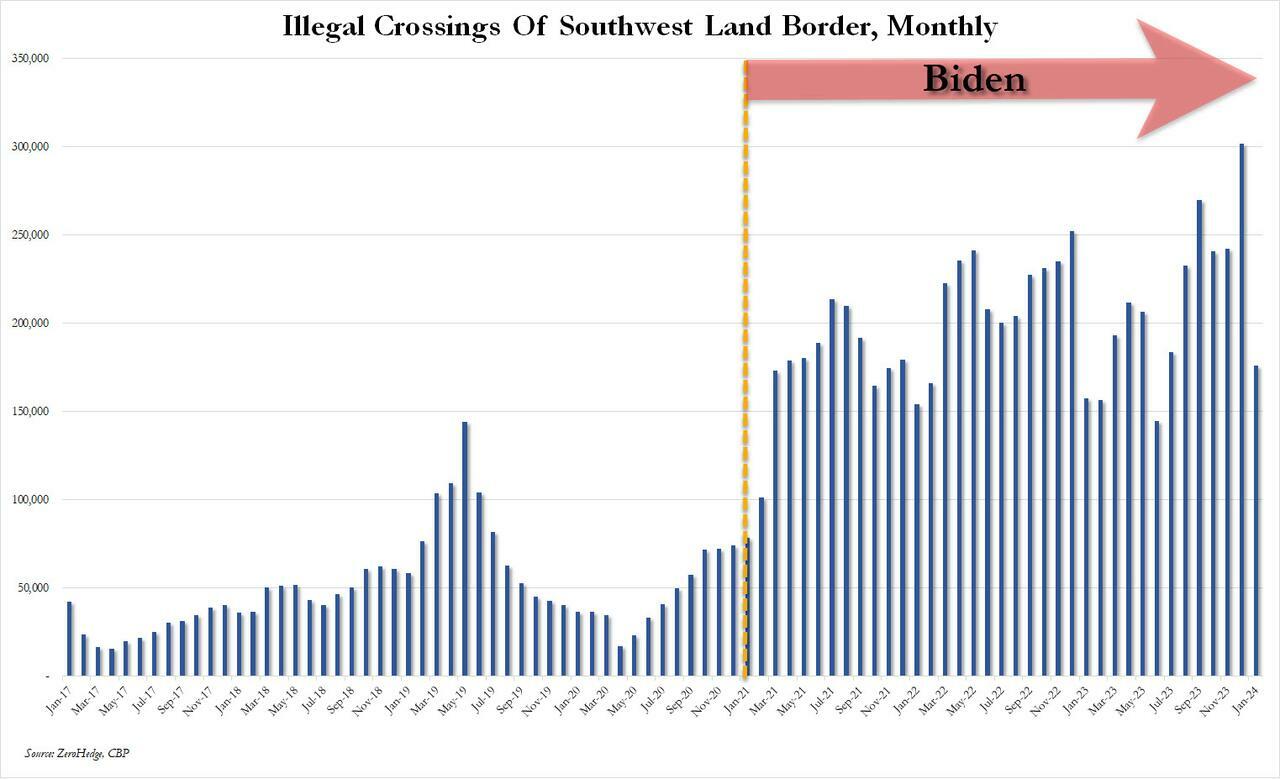
In short, the Biden administration opened the floodgates, 10 million illegal immigrants poured into the country, and most of the post-pandemic "jobs recovery" went to foreign-born workers, of which illegal immigrants represent the largest chunk.

'But Tyler, illegal immigrants can't possibly work in the United States whilst awaiting their asylum hearings,' one might hear from the peanut gallery. On the contrary: ever since Biden reversed a key aspect of Trump's labor policies, all illegal immigrants - even those awaiting deportation proceedings - have been given carte blanche to work while awaiting said proceedings for up to five years...

... something which even Elon Musk was shocked to learn.
Wow, learn something new every day https://t.co/8MDtEEZGam
— Elon Musk (@elonmusk) March 10, 2024
Which leads us to another question: recall that the primary concern for the Biden admin for much of 2022 and 2023 was soaring prices, i.e., relentless inflation in general, and rising wages in particular, which in turn prompted even Goldman to admit two years ago that the diabolical wage-price spiral had been unleashed in the US (diabolical, because nothing absent a major economic shock, read recession or depression, can short-circuit it once it is in place).
Well, there is one other thing that can break the wage-price spiral loop: a flood of ultra-cheap illegal immigrant workers. But don't take our word for it: here is Fed Chair Jerome Powell himself during his February 60 Minutes interview:
PELLEY: Why was immigration important?
POWELL: Because, you know, immigrants come in, and they tend to work at a rate that is at or above that for non-immigrants. Immigrants who come to the country tend to be in the workforce at a slightly higher level than native Americans do. But that's largely because of the age difference. They tend to skew younger.
PELLEY: Why is immigration so important to the economy?
POWELL: Well, first of all, immigration policy is not the Fed's job. The immigration policy of the United States is really important and really much under discussion right now, and that's none of our business. We don't set immigration policy. We don't comment on it.
I will say, over time, though, the U.S. economy has benefited from immigration. And, frankly, just in the last, year a big part of the story of the labor market coming back into better balance is immigration returning to levels that were more typical of the pre-pandemic era.
PELLEY: The country needed the workers.
POWELL: It did. And so, that's what's been happening.
Translation: Immigrants work hard, and Americans are lazy. But much more importantly, since illegal immigrants will work for any pay, and since Biden's Department of Homeland Security, via its Citizenship and Immigration Services Agency, has made it so illegal immigrants can work in the US perfectly legally for up to 5 years (if not more), one can argue that the flood of illegals through the southern border has been the primary reason why inflation - or rather mostly wage inflation, that all too critical component of the wage-price spiral - has moderated in in the past year, when the US labor market suddenly found itself flooded with millions of perfectly eligible workers, who just also happen to be illegal immigrants and thus have zero wage bargaining options.
None of this is to suggest that the relentless flood of immigrants into the US is not also driven by voting and census concerns - something Elon Musk has been pounding the table on in recent weeks, and has gone so far to call it "the biggest corruption of American democracy in the 21st century", but in retrospect, one can also argue that the only modest success the Biden admin has had in the past year - namely bringing inflation down from a torrid 9% annual rate to "only" 3% - has also been due to the millions of illegals he's imported into the country.
We would be remiss if we didn't also note that this so often carries catastrophic short-term consequences for the social fabric of the country (the Laken Riley fiasco being only the latest example), not to mention the far more dire long-term consequences for the future of the US - chief among them the trillions of dollars in debt the US will need to incur to pay for all those new illegal immigrants Democrat voters and low-paid workers. This is on top of the labor revolution that will kick in once AI leads to mass layoffs among high-paying, white-collar jobs, after which all those newly laid off native-born workers hoping to trade down to lower paying (if available) jobs will discover that hardened criminals from Honduras or Guatemala have already taken them, all thanks to Joe Biden.


Veterans Affairs Kept COVID-19 Vaccine Mandate In Place Without Evidence


The Coming Of The Police State In America


Beloved mall retailer files Chapter 7 bankruptcy, will liquidate


‘I couldn’t stand the pain’: the Turkish holiday resort that’s become an emergency dental centre for Britons who can’t get treated at home


February Employment Situation


Rand Paul Teases Senate GOP Leader Run – Musk Says “I Would Support”


Low Iron Levels In Blood Could Trigger Long COVID: Study


Walmart has really good news for shoppers (and Joe Biden)


Another beloved brewery files Chapter 11 bankruptcy
Walmart joins Costco in sharing key pricing news
-

 Uncategorized2 weeks ago
All Of The Elements Are In Place For An Economic Crisis Of Staggering Proportions
-

 Uncategorized1 month ago
Cathie Wood sells a major tech stock (again)
-

 Uncategorized3 weeks ago
California Counties Could Be Forced To Pay $300 Million To Cover COVID-Era Program
-

 Uncategorized2 weeks ago
Apparel Retailer Express Moving Toward Bankruptcy
-

 Uncategorized3 weeks ago
Industrial Production Decreased 0.1% in January
-

 International3 days ago
Walmart launches clever answer to Target’s new membership program
-

 International3 days ago
EyePoint poaches medical chief from Apellis; Sandoz CFO, longtime BioNTech exec to retire
-

 Uncategorized3 weeks ago
RFK Jr: The Wuhan Cover-Up & The Rise Of The Biowarfare-Industrial Complex